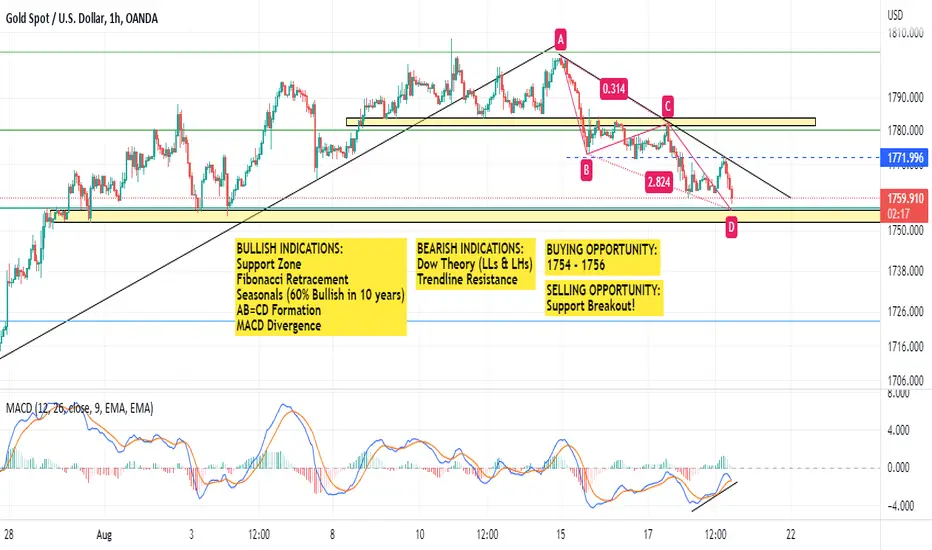
XAU/USD (BUYING OPPORTUNITY)BULLISH BIAS! OANDA:XAUUSD
BULLISH INDICATIONS:
Support Zone
Fibonacci Retracement
Seasonals (60% Bullish in 10 years)
AB=CD Formation
Best of Luck!
Macdivergence
Bitcoin long-term view - bottom after MACD divergenceBitcoin long-term view - bottom after MACD divergence
Looking back to 2014-15 and 2018 we had a huge bullish divergence with lower lows on price chart but higher lows in MACD histogram
A further confirmation can be found by a higher high on MACD histrogram after the MACD cross - called valid bull point in the chart
Will history repeat dear Crypto Nation?
*not financial advice
do your own research before investing

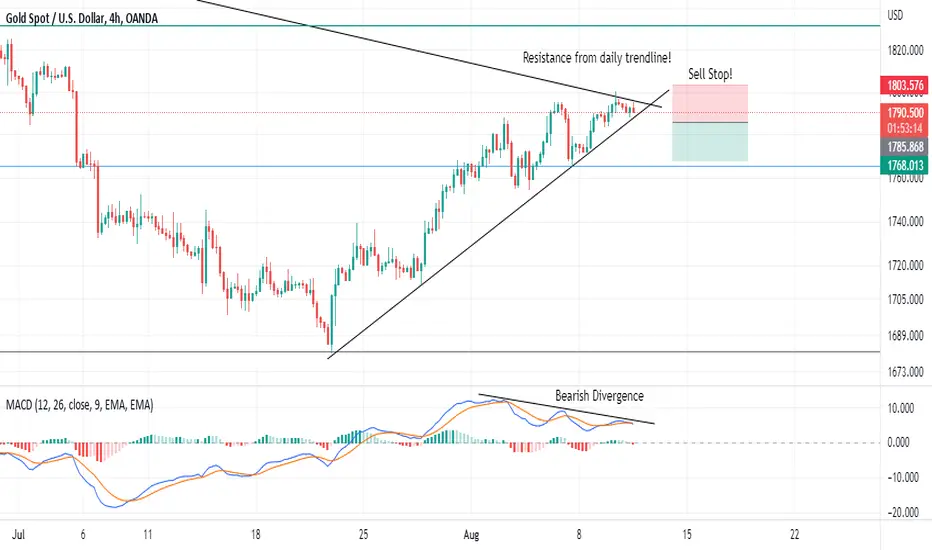
XAU/USD (Bearish Divergence)Short Idea! OANDA:XAUUSD
Bearish Divergence!
Daily Trendline!
Set a Sell Stop with RR=1:1
Best of Luck!
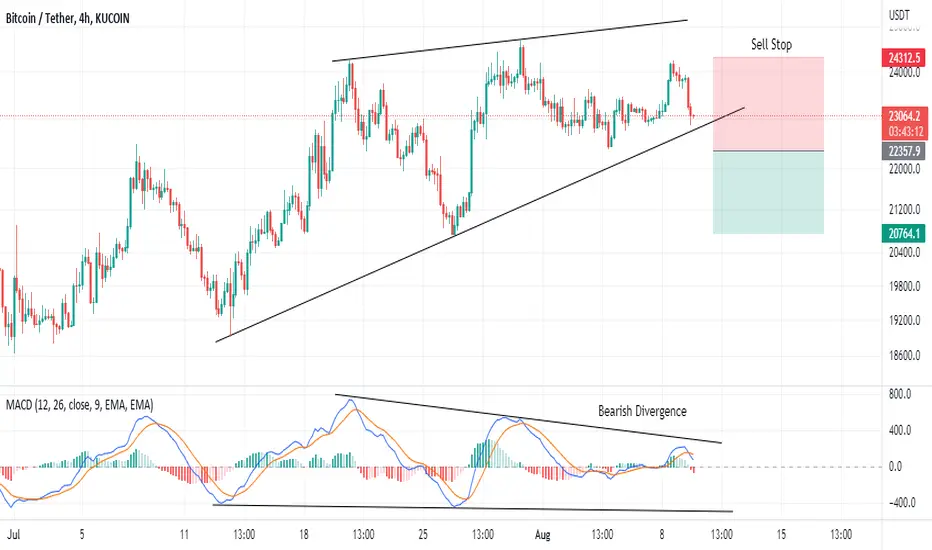
BTC/USDT (Bearish Divergence)Set Sell Stop!
Bearish Divergence on MACD!
We set a sell stop after the consilidation breakout!
Your feedback would be appreciated!
Best of Luck!
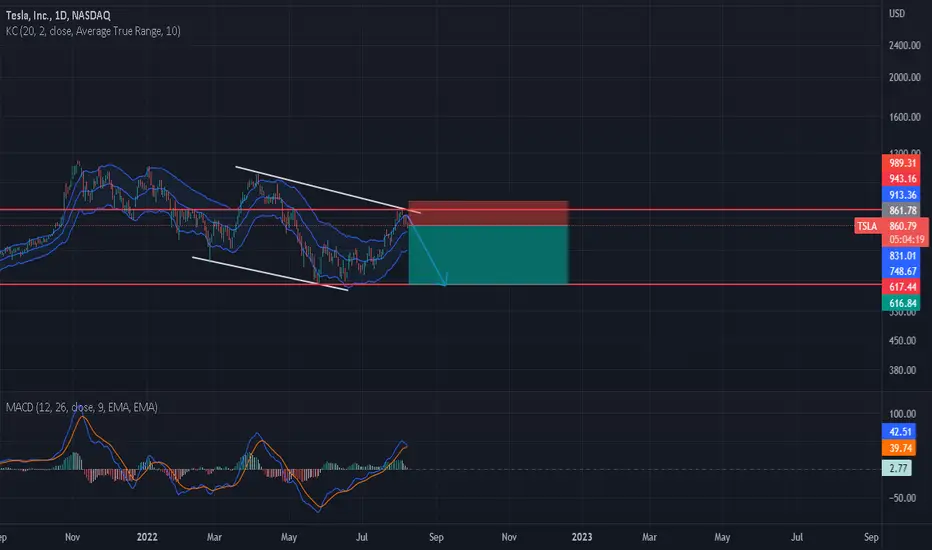
Tesla SHORT (NEW)Tesla is in a downtrend. Kelther's Channel upper band has just been crossed by some candles. MACD indicator is showing a probable change of trend from Bullish to bearish.
Entry, Stop and Target profit in the chart.
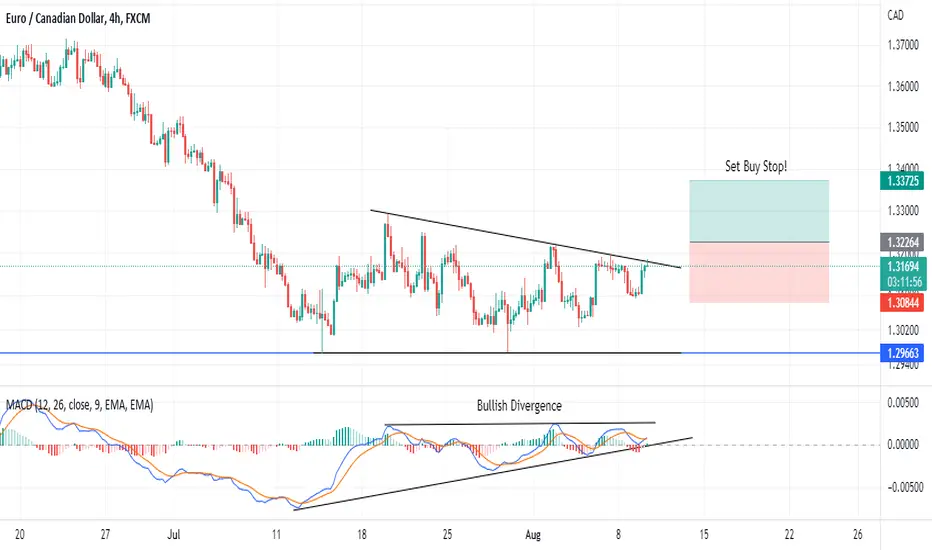
EUR/CAD (Bullish Divergence)Set a Buy Stop! FX:EURCAD
Bullish Divergence on MACD!
Buy Stop set above all good resistance levels!
Your feedback would be appreciated!
Best of luck!
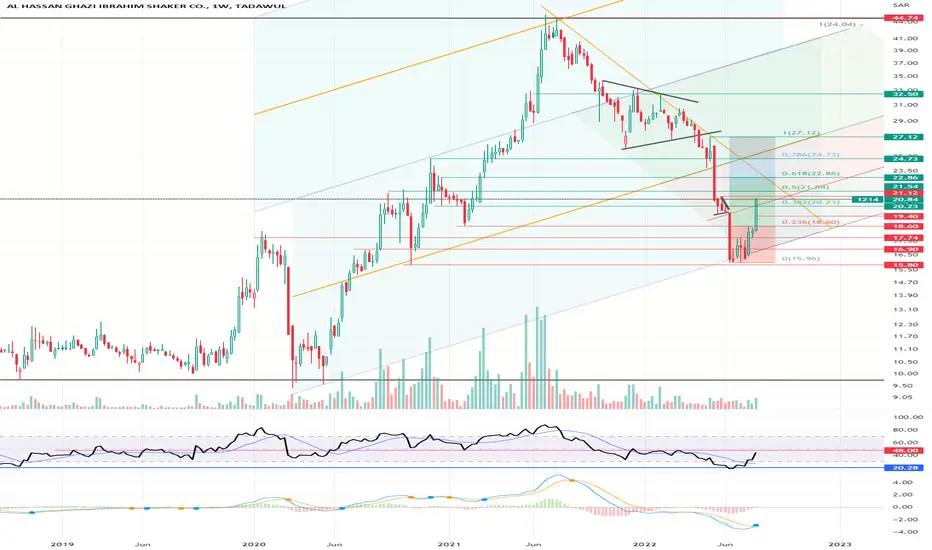
Important price points for TASI 1214 Shaker WeeklyTASI TADAWUL:1214 1214 Shaker
After target reached for 1st bearish flag and near 2nd bearish flag a divergence using RSI divergence strategy as shown on previous post.
Updated Logarithmic and Fibonacci Multiples with possible targets are indicated on the chart.
MACD and RSI points are also indicated.
Current price 20.84 is at center point of the horizontal channel.
The Impeccable by zyberalThis strategy works differently than others, it uses the IchimokuTenkan, Kijun, and Senkou periods to compute a general sense of market trend. Then I used the MACD fast, slow, and smooth with custom inputs to compute a optimum cross for finding macro bottoms and tops for any asset. This strategy doesn't trade on weekends and does not have a set TP (take profit) for each long or short. This strategy is invite only, please comment down below and follow me for access. Enjoy!
GBP/USD - Wait For A Break, Close & Retest Of The Channel TopHi Traders,
Today we are looking at trading GBP/USD on the 1-hour time frame.
We can see that price reached a high of 1.228 and then slowly began its fall bouncing between the bottom and top of this descending channel.
We have had two taps on the bottom and four taps on the top. I have put little arrows to show exactly where the price has been touching.
I always look for a minimum of 2 taps on either side to confirm a channel.
I also look for price respecting the middle line of a channel that helps to confirm a true channel as price always seems to treat the middle line as some sort of Support or Resistance. We can clearly this happening on the chart.
So, now that we can confirm that this is a downwards channel, what should we be looking for?
Well, we look for some sort of bullish divergence on the MACD.
We look at the histogram as well as the MA Lines.
Looking at the histogram, we can see that price is sloping upwards. I have drawn an arrow to show this clearly. This tells us that the volume of sellers is weakening and buyers should be stepping in at some point.
Looking at the MA lines of the MACD, we don’t see this as yet. So, we have what we call partial divergence.
Now, we are waiting for a break from the channel top. We want the price to close above the top of the channel with a clear break and close. If we see that, we can then wait for a retrace back down to the top of the channel before opening up a long position targeting the previous high of around 1.228.
This is how we trade Ascending and Descending channels. We want divergence showing a possible change in trend, a break and close above the channel, and then a retrace back down to the channel top before entering into a long position.
These patterns work extremely well when we have full divergence as confluence.
It works just s well with partial divergence but as it's only partial divergence, I would not class it as an ‘A’ grade setup. This means I would class it as a ‘B’ or ‘C’ grade setup, which means I would not risk my usual amount on this position. I would risk less as I know the probability of this setup performing well is not as strong as a setup with full divergence.
As most of you know, I am a swing trader and I look for setups on higher time frames. However, when I am in front of my charts and I do have the time to trade shorter time frame setups, I will take advantage of that.
Hope you all have a great Wednesday.
The Vortex Trader.


USDJPY waiting for bullish confirmation to go longUSDJPY waiting for bullish confirmation to go long. Thanks for watching.

GBPUSD bullish retracement might be overGBPUSD bullish retracement might be over. Thanks for watching.

EURUSD some room left for the bullish retracementEURUSD some room left for the bullish retracement. Thanks for watching

Bitcoin Weekly MACD will cross bullish ?Bitcoin Weekly MACD will cross bullish ? Thanks for watching.

ETHEREUM price above Kumo (daily),will tenak kijun follow?ETHEREUM price above Kumo (daily),will tenak kijun follow? Thanks for watching

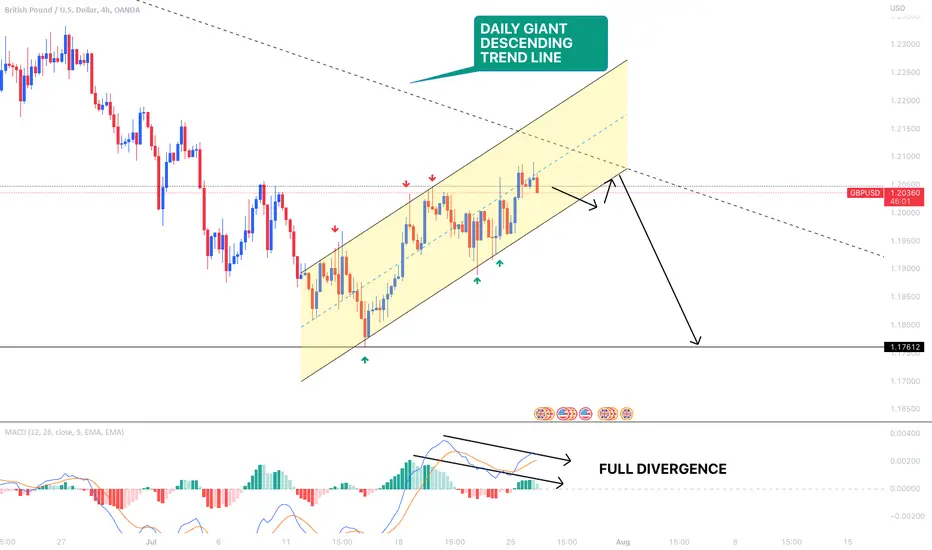
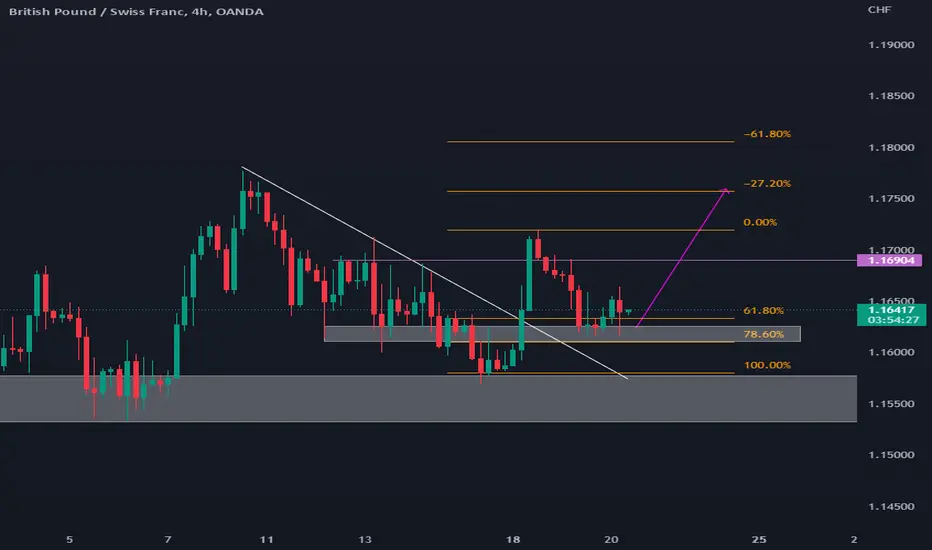
GBP/USD Daily Descending Trend line Hi Traders,
Have a look at GBP/USD on the 4-hour and daily chart today.
Having a look at the Daily time frame, we can see that price has been respecting this bearish trend line since the 20th of February 2022. We've had 5 taps so far on this giant daily trend line. Currently, it looks like the price is pushing to print its 6th tap.
Now, we don’t know whether or not this next tap will be the one to finally break us out of this bearish pressure that we have been in for the greater part of 2022.
However, if we were analyzing a trend, we can see that this trend is not bullish. Our bias must remain bearish until proven otherwise. Now, I am no fortune teller and I am not one of those traders that say that they can pick out where the exact bottom is. I only trade setups that make sense to me. So having said that, let's go deeper into the 4-hour time frame.
This chart shows that price has been pushing upwards, bouncing inside this ascending channel.
What do we look for on ascending channels? Usually, we look for a break and retest of the channel bottom. This means we are waiting for a possible bearish break of this channel with a retest of the bottom of the channel. If we see that, we can open up a short position with our targets being previous support around the 1.176 price level.
What's interesting to look for is that if this channel breaks to the downside and retests just as the price is touching or tapping the daily descending trend line, well then that gives us huge confluence to go short.
To add to that confluence, we have divergence on the MACD Histogram. As price makes higher highs within the ascending channel, we can see the histogram make lower lows showing that the bulls that are there right now might start to run out of steam and the giant daily bears might be biding their time, waiting for that perfect moment to push price back down.
To sum up my current thoughts .. Do nothing until shown a reason to jump in. I cannot force these charts and bend them to my will. Therefore, we wait until these patterns present themselves to us on a silver platter. Then, we jump in and take full advantage of the offering.
Hope you all have a fantastic Tuesday.
See you all on the next one.
The Vortex Trader.
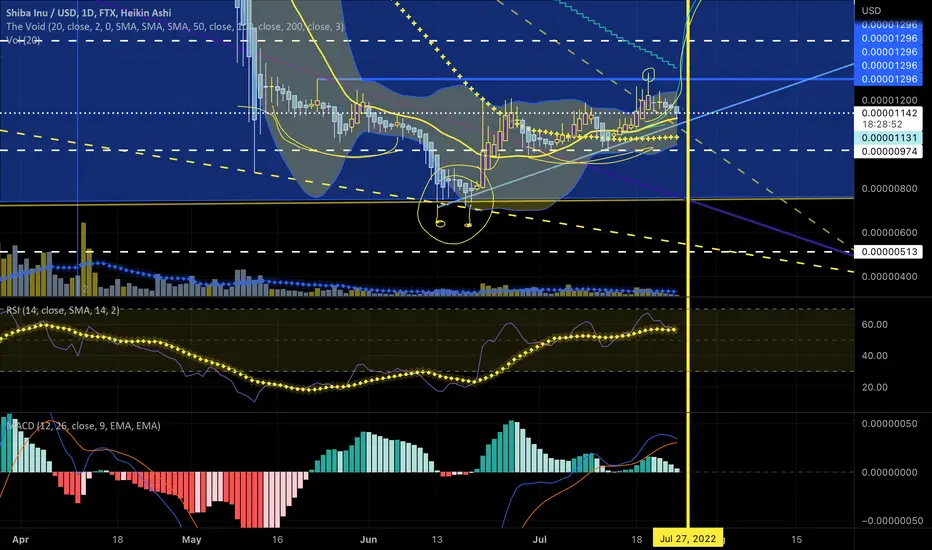
$Shib Inverse Head and Shoulders Pattern FormingI’ve been seeing the inverse head and shoulders pattern forming since June. If thesis is valid, and BTC doesn’t take the entire crypto market down with it, we might see a recover to the 2 levels.
FTX:SHIBUSD
Elliot wave TheoryJust an idea, speculation. This could indicate another push down but the macd is still strong and it is above 50 so this can very much be wrong.

EURUSD likely to retraceEURUSD likely to retrace, the current downtrend might take a break before it resumes.

Is NASDAQ100 about to experience a BULLISH PULLBACK ?Checkout my NASDAQ 100 analysis by ichimoku and macd

DAX 40 Descending Channel On The Daily Hi Traders,
Having a look a the DAX today on the daily and 4 hours.
I have highlighted the descending channel that we have been in since mid-June. Descending channels are a great pattern and can usually present a great setup with a high risk to reward as the targets for the channel entries are usually up where the channel began.
We can classify this as a channel as we have a minimum of two taps on either side and if we adjust slightly to cover the wicks then we can say we have three taps on either side. I have shown these taps on the chart with small arrows indicating where the rice has touched the top and bottom of the channel.
I have added a line that cuts through the channel In a horizontal fashion. This line indicated previous support flipped resistance and we can see that price has respected this line. It was supported and when it flipped to the resistance we had a nice short bounce off of it. We need to see a break above this resistance to confirm bullish action.
Looking at the MACD below, we have divergence across the histogram. As the price continued to make lower lows, the histogram was trending upwards which indicated to us that the sellers have been weakening. This is usually a good sign when looking at descending channels in any time frame because once we see this partial divergence we can start waiting patiently for a break of the channel top.
Let's move on to the volume. Notice how the volume has decreased dramatically since we began the descending channel. If we see a break above the channel top, we need to see accompanying strong bullish volume.
THE SETUP
Usually, the way I would wait for a setup is, that we need to see the price break above the channel top as this is descending resistance. Once we see this impulsive break, we need to see the price close above the channel top confirming that this channel is indeed broken. As I am a patient break and retest trader and as this is on the daily time frame, I would wait for the price to come back down and retest the channel top as support before triggering a long position and trading the DAX to the upside. Targets would be around the 13700 level. This is a psychological whole number that adds confluence to the target as well as it being the price where the descending channel began.
This would be a long-term swing trade as this could take time to play out. Until we see that break, there is no point in even looking for a retest or long position in this time frame.
Until then, let's keep watching and keep our eyes open.
Hope you all have a wonderful Thursday.
See you all on the next one.
The Vortex Trader.
