GBPUSD – Pound Stumbles on Political Risk and NFP FearGBPUSD – Pound Stumbles on Political Risk and NFP Fear: Reversal or Breakdown?
🧭 MACRO SNAPSHOT – All Eyes on UK Politics and US Jobs
The British Pound came under renewed pressure on Wednesday, losing nearly 0.8% intraday, driven largely by escalating political uncertainty in the UK. Concerns over early elections, party leadership instability, and fiscal doubts have weighed on GBP sentiment.
Meanwhile, the US Dollar remains supported ahead of the June Non-Farm Payrolls (NFP) release. With recent labor data showing signs of weakness (ADP: -33K), today’s NFP is expected to shape short-term Fed expectations. A weak report may cap USD gains and provide a rebound opportunity for GBP – but risk is two-sided.
📊 TECHNICAL STRUCTURE – H4 Chart Insights:
Trend Channel: GBPUSD is still trading within an ascending channel, but recent rejection at 1.3769 raises caution.
EMA Signals: Price has broken below EMA 13 and 34, showing momentum loss. EMA 89 is the next possible support near 1.3570.
Fibonacci Zones:
0.382: 1.3543
0.5: 1.3466
0.618: 1.3390
Key Levels to Watch:
Resistance: 1.3681 – 1.3769
Support: 1.3570 – 1.3450 (golden pocket)
The price is likely to test the midline or lower bound of the channel before resuming a move higher, assuming macro tailwinds don’t intensify GBP selling.
🎯 TRADE PLAN:
🔵 Buy Setup (Reversal from Demand Zone):
Entry: 1.3450 – 1.3460
SL: 1.3390
TP: 1.3570 → 1.3680 → 1.3760
Bias: Counter-trend rebound from golden pocket & ascending trendline
🔴 Sell Setup (Short-term pullback):
Entry: 1.3680 – 1.3700
SL: 1.3765
TP: 1.3570 → 1.3450
Bias: Fade weak bullish momentum near prior high resistance
📌 Risk Context:
Today’s US NFP report is high-impact – expect volatility spikes and spread widening. UK political headlines could cause gaps or sharp reversals. Traders are advised to reduce size or wait for clear rejection/confirmation candles before entry.
Macro

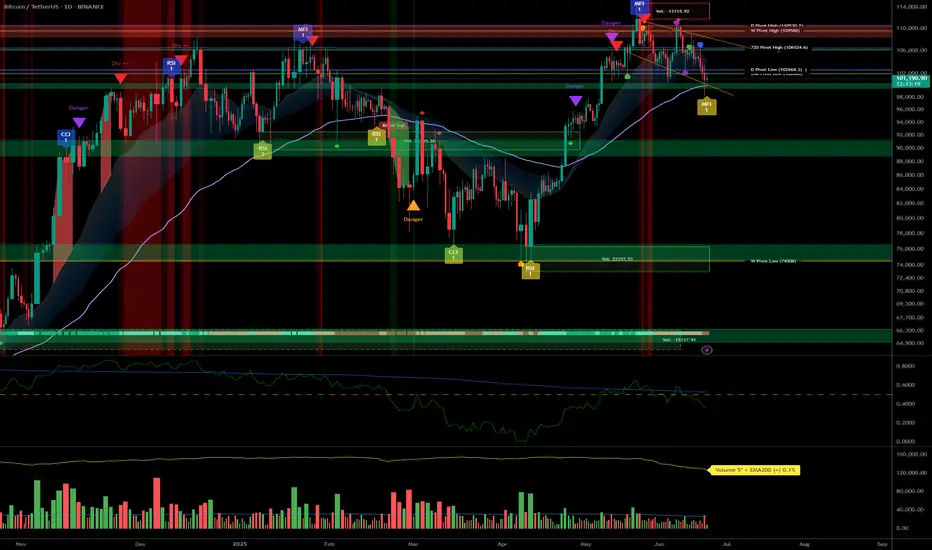
Bitcoin Uptrend Momentum, Key Buy Zone at 106.3K–105.9K__________________________________________________________________________________
Technical Overview – Summary Points
__________________________________________________________________________________
Momentum : Uptrend confirmed across all timeframes ≥1H; no signs of exhaustion or overheating.
Major supports : 106,319, 99,581, 98,133 USD
Major resistances : 108,239, 108,685, 111,949 USD (ATH)
Volume : Normal on higher TFs, very high on 30min/15min (potential breakout or institutional shake-out).
Behavior : Risk On / Risk Off Indicator = Strong Buy from 1D to 1H, neutral on 15min; ISPD DIV neutral across all TFs (no extreme behaviors).
__________________________________________________________________________________
Strategic Summary
__________________________________________________________________________________
Bias : Bullish as long as 98,133 is held on daily closes; structural buying pressure confirmed.
Opportunities : Swing accumulation on pullbacks to 106,319–105,900; targeting 108,700 then 111,949 on breakouts.
Risk : Geopolitical catalyst or break below D Pivot Low 98,133.
Macro catalyst : No major events (Fed, CPI, NFP) over the next 48h. Watch Powell’s speech (2 July).
Action Plan : Long entry on pullback to 106,300–105,900, stop <105,900, targets at 108,700 then 111,900. Exit on daily close below 98,133.
__________________________________________________________________________________
Multi-Timeframe Analysis
__________________________________________________________________________________
1D – Daily : Strong uptrend; balanced volumes; supports at 98,134 / 99,581; resistance at 108,239–111,949.
12H/6H/4H : Positive confluence. Accumulate on any return to support; no behavioral excesses detected.
2H–1H : Rising volumes, no divergences; strong timing for entries on dips.
30min/15min : Very high volume (breakout/shake-out); structure remains bullish. 15min Risk On / Risk Off Indicator =Neutral → watch for short-term consolidation or traps but broader trend holds.
Clear bullish confluence on all TFs ≥1H, with no behavioral or macro warning.
Short-term risks on micro-TFs (extreme volume, possible shake-out).
Accumulation zone on 106,300–105,900 pullbacks, invalidation below 98,133.
__________________________________________________________________________________
Cross-Analysis & Strategic Synthesis
__________________________________________________________________________________
Trend : No reversal signals. All indicators (volume, price action, Risk On / Risk Off Indicator) point to trend continuation.
Macro & newsflow : Monetary status quo, no negative catalyst in the short term. Only open risk: geopolitical tensions, closely monitored.
On-chain & fund flows : Ongoing ETF inflows, stable capitals, strong HODL trend, SSR stable.
Risk management : Stop <105,900, hedge on geopolitical signals.
Summary:
All TFs ≥1H aligned in bullish cycle, corrections = structured long accumulation opportunities.
Key buy zone: 106,300 – 105,900; prudent stop <105,900; main targets 108,700 and ATH.
Closely monitor for Powell/Fed headlines.
__________________________________________________________________________________

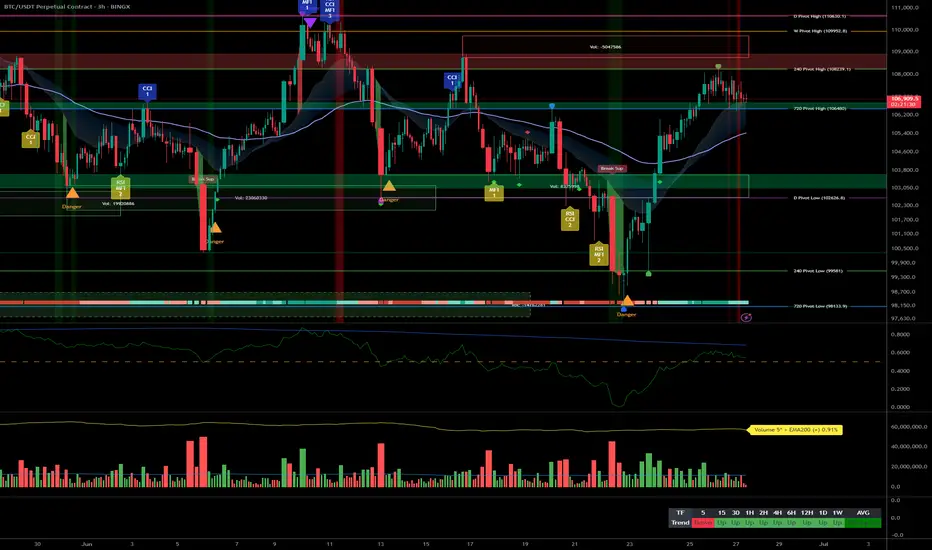
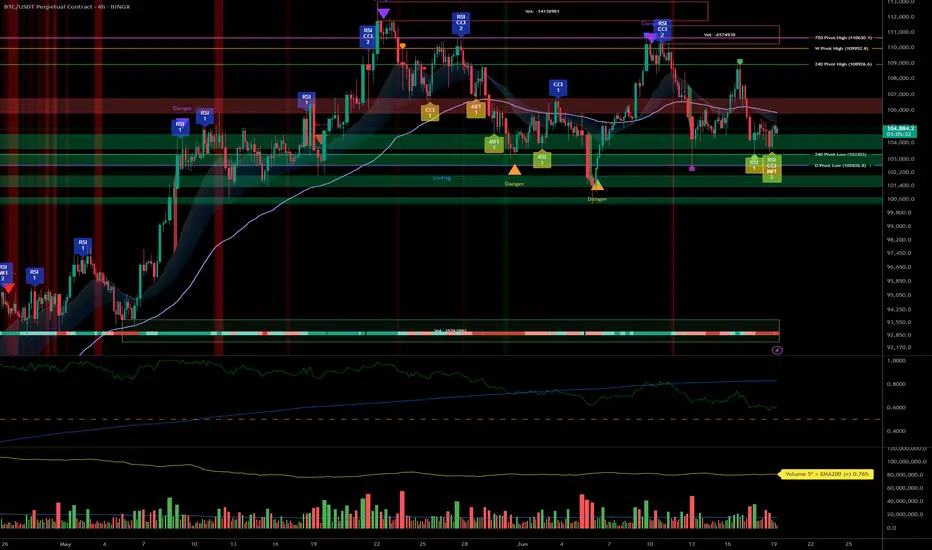
Bitcoin Controlled consolidation above 106,480 Technical Overview – Summary Points
➤ BTC trades in the 1st quartile of its yearly range (100k – 111k).
➤ Stacked resistance zone: 108,239 to 110,603 USDT → potential seller exhaustion.
➤ Key support at 106,480; defensive cluster 102,626–99,581.
➤ Risk On / Risk Off Indicator = Strong Buy; ISPD Divergence = Neutral.
➤ Normal volume, but lack of fresh capital → sustainability of rally questionable.
__________________________________________________________________________________
Strategic Summary
➤ HTF trend bullish above 106,480; breakout > 108,239 targets 109,950 / 110,600.
➤ Buy swing pullbacks on 106,480 or 104,600. Invalidation < 102,626 = drop to 99k.
➤ Tactical short scalps around 108,250–109,000.
➤ Core PCE = major catalyst (June 27).
➤ Watch spot volumes, funding, and Risk On / Risk Off signals.
__________________________________________________________________________________
Multi-Timeframe Analysis
➤ 1D : bullish bias > 106,480; danger < 102,626.
➤ 12H : bullish consolidation; confirmed breakout > 108,239.
➤ 6H : compression; buy dips 106,480 / 104,600.
➤ 4H : lateral-bullish; key support = 104,600.
➤ 2H : neutral-bullish; triggers = 107,800 / 106,000.
➤ 1H : bull flag; micro-divergence, prefer long > 106,950.
➤ 30 min : tight triangle; breakout at 107,200 / 106,650 = signal.
➤ 15 min : bearish < 106,950, expected bounce on 106,480.
__________________________________________________________________________________
Macro, News & On-Chain Analysis
➤ Macro backdrop: “Higher for longer” stance continues, no FOMC imminent.
➤ Core PCE June 27: upside surprise (2.7% YoY vs 2.6% expected) – USD supported, potential headwind for risk assets.
➤ Pacific Region: ongoing tensions in Taiwan Strait and South China Sea:
- Increased military activity: air incursions, naval maneuvers.
- High risk of escalation flagged by defense analysts & social feeds.
- Risk sentiment: volatile – sudden events could trigger risk-off.
➤ On-chain: Range 100–110k; weak spot volume; cautious leverage; no major sell-side imbalance.
__________________________________________________________________________________
Conclusion
➤ BTC maintains a controlled bullish bias > 106,480.
➤ Swing buy zones = 106,480 & 104,600; targets 109,950 / 110,600.
➤ Main risk: break < 102,626 = sell-off toward 99k.
➤ Monitor Core PCE and geopolitical risk in the Pacific region.
__________________________________________________________________________________
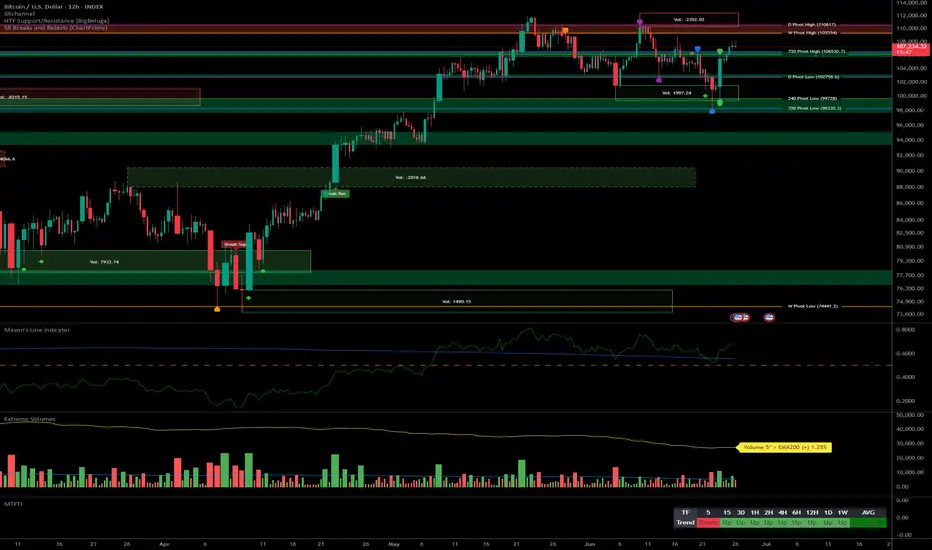
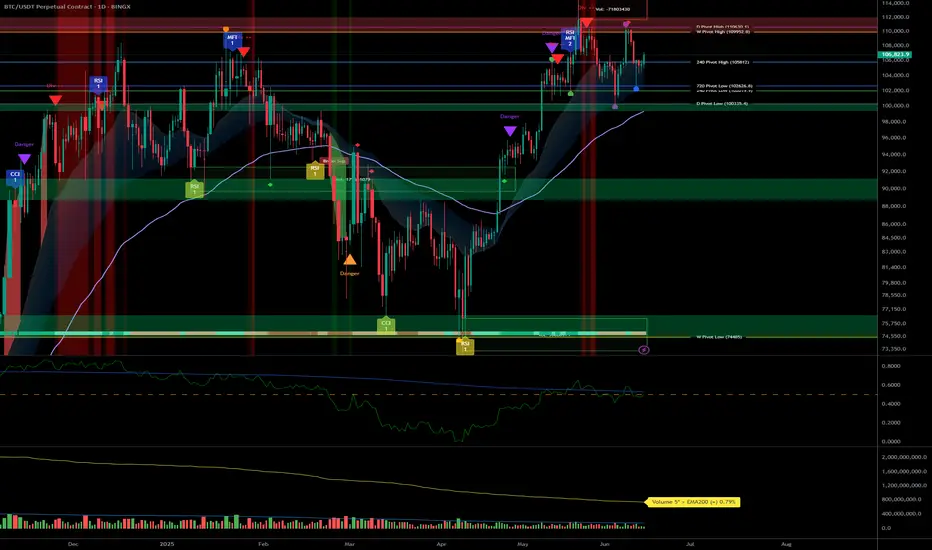
BTC multi-timeframe: bullish momentum and strong support zones__________________________________________________________________________________
Technical Overview – Summary Points
__________________________________________________________________________________
Momentum: Clear bullish bias across all timeframes (MTFTI Up everywhere except 5min). Weak selling pressure, no distribution or capitulation signals.
Support/Resistance: Key resistances: 110647–109554 (HTF). Major supports: 102756 (D Pivot Low), 98330 (720 Pivot Low). Multiple buy zones on retracement.
Volume: Recent volumes below "extreme" threshold, no euphoria/capitulation detected.
Multi-TF Behavior: Global bullish alignment, volatility present intraday, but no confirmed reversal risk. Risk On / Risk Off Indicator shows no major anomaly.
__________________________________________________________________________________
Strategic Summary
__________________________________________________________________________________
Strategic Bias: Structurally bullish market. Prioritize tactical buys on pullback, active risk management.
Opportunities: Reinforce long positions on $106k/$103k/$100k retrace. Partial targets below 110–111k.
Risk Zones: Rejection under 106500–107000 with extreme volume spike = short-term top signal. Invalidation if H1 < 106k or H4 < 102.7k.
Macro Catalysts: US calendar (GDP, durable goods, jobless claims), geopolitics (Russia/Ukraine). No systemic alert, but caution required.
Action Plan: Filter entries on technical supports, exit on extreme sell volume or macro shock.
__________________________________________________________________________________
Multi-Timeframe Analysis
__________________________________________________________________________________
1D: Compression below historical resistances (109–111k), solid momentum, potential buy zone 102750–98330.
12H: Multiple resistances, uptrend, support confluence 102756–106530 pivot key.
6H: Price under resistance cluster (106530), possible profit-taking on rejection, strong support 102756.
4H: High-range structure, reinforced supports, next breakout could trigger acceleration with volume.
2H: Pivot zone 106500–107200, caution below close, buy zone on correction.
1H: Support stacking structure, no clear breakdown, critical node, aggressive buy 106100–105800.
30min: Compression at range high, caution on buying resistance, key spots 106000/104500.
15min: Possible buyer exhaustion under 108k, tactical buy on support 106000–106500 if confirmed.
Summary: Strong bullish alignment, same key supports, no panic. Risk On / Risk Off Indicator neutral, controlled market, possible whipsaw on short-term TFs but no major reversal sign.
__________________________________________________________________________________
Macro, News & On-Chain Analysis
__________________________________________________________________________________
Macro: Fed and traditional markets calm, no monetary alert. Israel/Iran ceasefire, increased volatility in Europe (Russia/Ukraine). Moderate risk-on sentiment.
Calendar: June 26: US durable goods/GDP/jobless claims (potential volatility).
On-chain: BTC range $100–110k, fundamental support $93–100k, no panic/capitulation. Low spot volumes, bullish digestion phase.
__________________________________________________________________________________
Conclusion
__________________________________________________________________________________
Dominant bias: Up/moderately bullish in short term, focus on retracement buying.
Risk management: Stop H4 < $102.7k, H1 < $106k, scalping: break of 106k with extreme volumes.
Action zones: Reinforce on $106k/$103k/$100k retrace, partial TP below 110–111k, extension if confirmed breakout.
Monitor: Volume, support reactions, macro catalysts.
Summary:
Technical and on-chain context remains bullish; best approach is tactical buying on pullback with dynamic stops. Stay agile in case of extreme selling volume or macro shocks. Act on signals, protect capital.
__________________________________________________________________________________
Upward Momentum, Caution Near 106,500–110,000 Resistance__________________________________________________________________________________
Technical Overview – Summary Points
Momentum: Strong bullish bias on mid/long-term (1D-4H), short-term "Down" divergences (1H/2H). Overall alignment, no capitulation/euphoria signals.
Key supports / resistances: Supports at 103,300/102,600 (D Pivot Low, 720 Pivot). Major resistances: 106,480–109,952. Price compression under daily/weekly resistance, technical rejection risk.
Volumes: Normal to moderately high, 1H abnormal volumes signal possible squeeze.
Multi-TF: Bullish confluence 1D–6H, short-term Down divergences, caution required for late long entries under resistance.
Risk On / Risk Off Indicator: "Strong Buy" signal consolidated across all timeframes except 15min (neutral ST), sector bullish.
ISPD DIV: Neutral on all TFs – no behavioral overheating or exhaustion.
__________________________________________________________________________________
Strategic Summary
Overall bias: Bullish HTF setup (1D–4H), buy opportunities on dips towards 103,300/102,600, stop <102,000.
Risk zones: 106,480–109,950 = resistance cluster, active management required. Technical invalidation below 102,000.
Macro catalysts: Window of increased volatility 15:00–16:00 UTC (CB Consumer Confidence & Powell speech). Middle East geopolitics = “wildcard”, caution on any escalation.
Action plan: Buy on pullback, manage actively >106,000, mandatory protection during news hours, reassess post-macro-volatility.
__________________________________________________________________________________
Multi-Timeframe Analysis
1D & 12H: Upward momentum confirmed, solid supports, no exhaustion signals, Risk On / Risk Off Indicator "Strong Buy".
6H–4H: Technical and behavioral confirmation, constructive volumes, caution near immediate resistances.
2H–1H: Short-term downside divergence, 1H very high volumes = potential squeeze or shakeout, active caution required under resistance.
30min–15min: Consolidation/digestion; Risk On / Risk Off Indicator neutral at 15min, no impulsive entry point yet.
Summary: Robust up-structure on HTF, buy-side strategies on dips favoured, active management imperative near resistance and macro volatility events.
__________________________________________________________________________________
Fundamental, On-Chain & Macro Risks Analysis
Macro news: No immediate catalysts except USD news (CB Consumer Confidence, Powell) at 15:00-16H00 UTC, source of temporary volatility – no prevailing trend in question at this stage.
On-chain / Market: High volumes, institutional leadership, no “retail” panic, no flush/fomo, healthy structure.
Leverage: OI >$95B, stablecoin dominance, risk contained except on external triggers (macro, geopolitical).
Geopolitics: Middle East context = spike risk, active management mandatory on escalation.
__________________________________________________________________________________
Summary:
• Dominant bias Up (buy on dips >102,600), active management below major resistances (106,500–110,000).
• Key stop <102,000 (invalidation).
• Increased risk window: 15:00–16:00 UTC (USD news).
• Monitor leverage, adjust exposure ahead of key catalysts.
A TA Macro Look into Bitcoin to assess directionThis is a look into the macro developments happening currently in Bitcoin.
This is strictly a TA look into the big picture. We zoom out to Timeframes bigger than 1W.
At times zooming in to check (3 Day, 5 Day, maybe 1D) for potential swing trades.
I tend to look into things like price action, indicators, volume and other data to sway probabilities of where an asset may go and determine best opportunities of supply and demand zones based on my interpretations.
So jumping right in this is a look into price action on the 1 Month timeframe.
Notice trend lines drawn.
Notice the Ascending channel.
Notice the Blue rectangle zone.
Notice this months (June) Candle
Our current June candle is in a critical area.
We are around the horizontal resistance zone, indicated by red horizontal line.
This red horizontal resistance line is a powerful one.
Our previous interaction generated a massive Bearish engulfing monthly candle.
This area is not to be joked with and would urge to consider looking for more signs or better data to support continuation of bull run. If not a sell off is in the cards.
Notice our current June candle
Having equal length upper and lower wicks indicate that this month was neutral.
Bulls nor the Bears came on top.
If we close around this in 8 days.
Probabilities would be 50/50 just based on price action and candles for price movement in July.
We would need to look for other signs in indicators or something else, in other words look for confluence of multiple signs whether bull or bear.
The Ascending channel is also in my opinion over extended.
Notice the price action touch points on Green ascending support line.
The duration between touches is coming down.
2nd touch happened 365 days after first. Which was the initial part of Crypto bull market.
3rd touch happened 214 days after.
We are currently 61 days in after 3rd touch. Considering this and being logical, we could be getting close to another touch.
But consider also that the duration can extend well into in the 100's (of days), before we touch.
Notice also the Blue rectangle zone. This marks a side ways range of bitcoin.
The orange horizontal line is mid point of this blue zone.
A scenario could be that price goes to where the orange horizontal line meets the green sloping support line.
The confluence of these 2 support lines, can be a decent area for potential bounce (which can be temporary).
A break down of these 2 lines could also lead Bitcoin back down to the lower border of the Blue rectangle also indicated by Green horizontal line, which is a massive supply zone at the moment.
This scenario in my opinion would be a high probability trade by looking for bounce up but please keep in mind this does not mean a bull run would continue.
Look for more posts as things develop on Bitcoin.
DISCLAIMER: This is not financial advice, i am not a financial advisor. The thoughts expressed in the posts are my opinion and for educational purposes. Do not use my ideas for the basis of your trading strategy, make sure to work out your own strategy and when trading always spend majority of your time on risk management strategy.

Major Support Confluence, Tactical Rebound or Looming Flush?__________________________________________________________________________________
Technical Overview – Summary Points
__________________________________________________________________________________
Momentum: BTC is working a major daily support zone (102.6–103k USDT) with strong confluence across 1D, 12H, and 2H pivots. Technical rebound in play, but still no strong behavioral catalyst.
Supports / Resistances: Key support clusters at 102.3–103.3k (2H, 720min, daily pivots). Main resistances: 106.4k–110k.
Volume: Very high on 2H/1H near supports, hinting at possible washout/profit-taking. No buy climax identified.
Risk On / Risk Off Indicator: Strong bullish signal from 1D to 30min (neutral on 15min), while lower TFs remain under selling pressure.
Multi-TF Behavior (ISPD DIV): No excess or euphoria: market is waiting/compressed, caution is necessary in the short term.
__________________________________________________________________________________
Strategic Summary
__________________________________________________________________________________
Global Bias: Tactical bullish but cautious — confirmation on clean rebound needed to strengthen conviction.
Opportunities: Technical entries in the 102.6–103.3k zone with stops below 102k (aggressive) or 97.5k (defensive). Profit-taking zones at 106.4k/109.9k/110k.
Risk Areas: Invalidated below 97.5k (swing), potential flush down to 94k/88–89k. Heightened vigilance around macro releases.
Macro Catalysts: PMI prints (June 23), Fed on pause, increased geopolitical risks (latent volatility and cross-asset caution).
Action Plan: Prioritize active management: reduced position sizing, mechanical stops, and real-time bias adjustment based on volume and behavioral response.
__________________________________________________________________________________
Multi-Timeframe Analysis
__________________________________________________________________________________
1D–12H: Major supports (D Pivot Low 102626.8), structural uptrend, strong Risk On signal, but no behavioral/volume extremes.
6H–4H: Ongoing technical rebound, moderately high volume, support confluence, BUT short-term TF pressure remains.
2H–1H: Very high volume at support, possible local flush, but still no bullish behavioral confirmation—monitor for rapid volatility.
30min–15min: Tentative stabilization post-support absorption, no clear psychological excess, risk of further downside if rebound not confirmed; Risk On / Risk Off Indicator is neutral at 15min.
Summary: Bullish structural setup, but fragile micro dynamics—discipline and speed are key.
__________________________________________________________________________________
Fundamental & On-chain Overview
__________________________________________________________________________________
External factors: Fed on hold, US inflation slightly higher, robust economy, increased geopolitical risks (hot spots Israel–Iran, Ukraine–Russia). Latent risk-off sentiment but not yet materialized.
Calendar to watch: June 23, 09:45–10:00 UTC (US PMI & home sales).
On-chain: Low user activity, high institutional volumes, off-chain flow dominance, leverage high (mostly in stablecoins, limiting crypto-margined liquidation spirals), no euphoria or panic detected.
Risk/reward synthesis: Key technical buy zone 102.6–103.3k (stop < 102k/97.5k), targets 106.4k/109.9–110k. Below 97.5k: bearish bias, defensive risk management needed.
__________________________________________________________________________________
Final strategic synthesis
__________________________________________________________________________________
BTC remains "structurally strong but tactically fragile": major support confluence and bullish sectoral signal, but persistent micro selling pressure and macro/cross-asset uncertainty. Only entries on clear technical signals, mechanical stops and active risk management offer rational short-term setups in this volatile and compressed environment.
__________________________________________________________________________________
BTC – Bullish bias under review: 102k/103k supports in focus__________________________________________________________________________________
Technical Overview – Summary Points
__________________________________________________________________________________
Momentum : Dominant on all major timeframes (1D, 12H, 6H, 4H). Risk On / Risk Off Indicator signals STRONG BUY except on 15min (neutral).
Support/Resistance : Structurally key pivot zone 102k–106k; major supports 102k/103k. Potential breakout above 106k (swing target 109k).
Volumes : Normal across all timeframes. No excess signals, no accumulation/capitulation peaks.
Multi-TF Behaviors : Horizontal consolidation with bullish dominance. Short-term bearish divergence on 2H–15min, micro-TF in correction only, no panic.
__________________________________________________________________________________
Strategic Summary
__________________________________________________________________________________
Global Bias : Solid bullish structure as long as 102k/103k hold. “Risk On” maintained by sector outperformance.
Opportunities : Entries on pullback/main base 103k–104k; breakouts to watch above 106k.
Risk Zones : Clear invalidation <102k, potential rapid flush to 97k–88k; keep strict stop-loss below 102.5k.
Macro Catalysts : FOMC, Fed projections, Middle East geopolitics keep volatility high, but no shock. Price action leads near-term strategy.
Action Plan : Swing buy on confirmed support, dynamic hedge post-news, monitor volumes/closures on key pivots.
__________________________________________________________________________________
Multi-Timeframe Analysis
__________________________________________________________________________________
1D : Bullish momentum, major supports intact (102k/105k). Risk On / Risk Off Indicator = STRONG BUY, stable volume, no excess. Healthy structure for long swings.
12H : Positive bias, range 102.6k–106k. Risk On / Risk Off Indicator = STRONG BUY.
6H : Presumed accumulation 103k–106k, momentum still strong. No volume weakness.
4H : Range oscillation, structural support test at 103k. Sector outperformance, neutral volume.
2H : First sign of short-term weakness. Divergent with higher TFs but no panic.
1H : Technical rebound towards 104.8k possible as long as 103k support holds.
30min : Short-term trend remains bearish (trend 30min = down). Correction/purge ongoing.
15min : Neutral momentum, supports being tested. No panic or melt-down observed.
Summary : Strong bullish confluence on higher TFs, temporary divergence on micro-TFs. “Range with bullish bias” scenario as long as 102k/103k holds the structure.
__________________________________________________________________________________
Macro and Fundamental Analysis
__________________________________________________________________________________
FED/FOMC (June 18) : Rates unchanged, “data dependent” guidance. Raised volatility but no risk-off shift.
Market Sentiment : BTC technical structure holds, moderate post-FOMC volatility.
S&P500 : Above all key moving averages. Sector momentum (software, uranium, semis) remains dominant.
Energy Level : Weak oil = little macro pressure against BTC.
Geopolitics : Israel–Iran escalation / US posture reinforced. High FX/oil volatility but BTC resilient (>102k), no panic on record.
Economic Calendar : Closely watching BoE & SNB, but low BTC impact odds.
Implications : Post-news phase = ideal for range trading, no rupture event expected within 48h.
__________________________________________________________________________________
Strategic synthesis & R/R guidance
__________________________________________________________________________________
Long on pullback 103–104k, swing targets 106/109k. Optimal R/R (>2.5) if stop 102.5k (D Pivot Low).
Invalidation area : Clean close <102k or heavy downside volume (capitulation via ISPD/volumes).
Risk Management : Dynamic stops, partial hedge post-FOMC during macro volatility.
Conclusion : Bullish structure preserved. Range trading scenario dominant, no extreme signals or panic. Actions: support watch, technical buy on confirmed pullback.
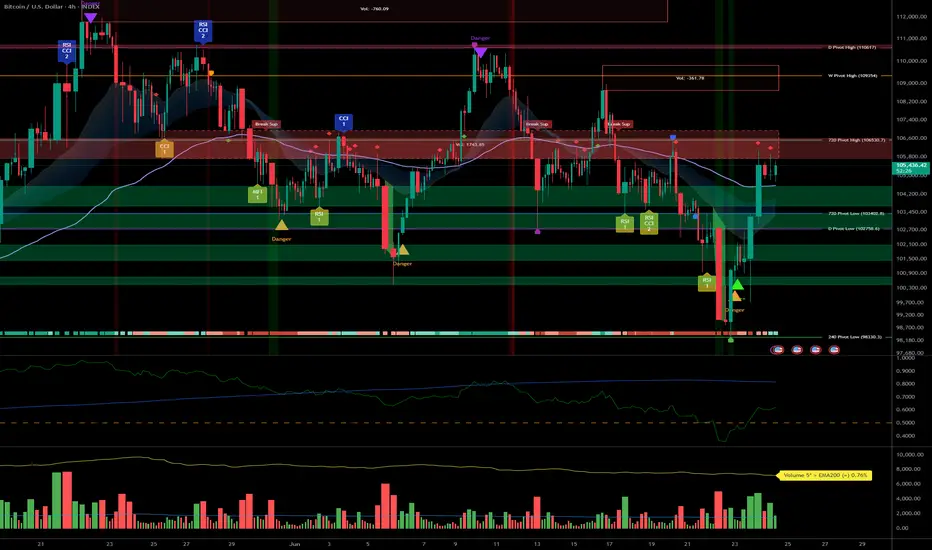
HTF Consolidation: Key Alerts, Vital Supports, FOMC & Geopolitic__________________________________________________________________________________
Technical Overview – Summary Points
__________________________________________________________________________________
Momentum: Strong bullish signal across sector indicators (Risk On / Risk Off Indicator), especially on daily and 12H. Momentum remains robust within consolidation.
Support/Resistance : Key zone at 104429–102600 (short- and long-term pivots); major resistance at 106000–109950.
Volume : Normal to high, with peaks at major supports on 1H/2H (potential sign of absorption/defensive buying).
Behavior across timeframes :
ISPD neutral on most TFs, only 2H gives a buy signal (possible tactical bounce).
All LTFs (≤1H) are down, HTFs (≥1D) are up → corrective structure, awaiting catalyst.
__________________________________________________________________________________
Strategic Summary
__________________________________________________________________________________
Overall bias : Underlying bullish, but market consolidates on key technical zones.
Opportunities : Swing buy at 104429/102600, tight stop below 100k, take profit 109950+.
Risk zones : Clear break below 100350/100000 invalidates the setup (risk-off or tactical short).
Macro catalysts : FOMC, Iran–Israel tensions, economic calendar (monitor Jobless Claims, Crude, Fed statement).
Action plan :
Capital preservation before FOMC.
Tactical entries only on key support; tight stops, prudent sizing.
No breakout chasing without macro/fundamental validation.
Hedge/volatility play via options possible (IV low, caution for post-event spike).
__________________________________________________________________________________
Multi-Timeframe Analysis
__________________________________________________________________________________
1D/12H/6H :
Supports: 104429, 102626, 100353.
Resistances: 106000–109952.
Risk On / Risk Off Indicator = Strong Buy.
No extreme volume, ISPD neutral; mature range.
HTF consolidation, bullish underlying momentum.
4H/2H :
Key zone at 104429–102600 (technical defense); 2H is the first true behavioral buy signal.
Very high volume at support, favoring a "spike bounce" scenario.
“Up” confluence on Risk On / Risk Off Indicator, volume, and ISPD for short-term bounce.
MTFTI: 2H is one of the “Up” TFs; LTFs remain Down.
1H/30min/15min :
Structurally bearish, elevated volume (absorption/protection) on 1H.
No behavioral excesses.
Intraday weakness but supports tested and defended.
__________________________________________________________________________________
Macro / Fundamental analysis
__________________________________________________________________________________
Market in wait-and-see mode : FOMC upcoming, no hike expected but high impact from tone/forward guidance (increased volatility risk).
Geopolitics : Iran–Israel escalation, risk-off climate, nervous risk assets.
On-chain : Supports tested (STH ~97.6k). Persistent LTH accumulation. Low option IV → underpriced volatility risk.
Risk/Reward swing : 2:1/3:1 buying 104429–102600, stop < 100k, take profit 109950+.
__________________________________________________________________________________
Final synthesis: Bias, Opportunities, Risks
__________________________________________________________________________________
Directional bias : Bullish on HTF, neutral/undecided on short-term. Wait-and-see until strong catalyst confirmed (FOMC, geopolitical de-escalation).
Opportunities : Tactical buy on supports, profit-taking on resistance or confirmed breakout.
Risks : Invalidation below 100k; sudden spike in FOMC/Israel–Iran escalation = risk-off or selloff.
Recommended action : Protect capital before FOMC. Swing tactical entry only on confirmed support. No breakout chasing without macro validation. Leverage potential post-FOMC vol spike via options.

BTC/USDT: Sector Momentum and Decision Zone Ahead of the Fed__________________________________________________________________________________
Technical Overview – Summary Points
➤ Strong multi-timeframe bullish momentum, confirmed by the Risk On / Risk Off Indicator signaling “Strong Buy” across all timeframes (daily, 12H, 6H, 4H down to intraday).
➤ Major supports (102,600–104,250 $) act as the market’s anchor; the 105,800–106,100 $ resistance remains the key level to break for a confirmed further bullish leg.
➤ Volumes are weak to normal, with no recent distribution, climax, or panic/extreme behavior (ISPD DIV neutral); market remains rational.
➤ Short-term TFs (1H, 2H) are more hesitant—favoring consolidation/range, suitable for scalping or risk management rather than directional breakout trades.
__________________________________________________________________________________
Strategic Summary
➤ Dominant bullish technical context, but facing key resistance, with macro and on-chain signaling for active caution.
➤ Opportunity: Buying pullbacks on 104,250–102,600 $, targeting extension if clean breakout above 106,100 $. Partial profit-taking into the 110–111k $ highs.
➤ Risk zone: Invalidation if there is a decisive break <102,000 $ or major red volume climax on failed resistance retest.
➤ Key catalysts this week: Fed/FOMC decision, major geopolitical events.
➤ Plan: Favour methodical accumulation pre-Fed, reinforce/swing post-announcement according to technical resolution.
__________________________________________________________________________________
Multi-Timeframe Analysis
1D : Trading below broad 105,800–111,000 $ resistance, Risk On / Risk Off Indicator strongly positive, normal volumes, no euphoria (ISPD DIV neutral). Healthy structure, upward bias confirmed.
12H/6H : Consolidation at major support; recent rebounds from 102–104k, no exhaustion signals. MTFTI Up but 2H-1H corrective divergence.
4H/2H : Range market, major supports defended, no breakout yet. MTFTI locally Down, indicating mild internal corrective dynamic.
1H/30min/15min : Intraday range, technical micro-bounces, weak directional bias, moderate volumes, no abnormal behavior. Scalping preferred below resistance, rigorous risk management.
Risk On / Risk Off Indicator : Strong aligned buy signal across all TFs, sector environment supportive.
__________________________________________________________________________________
Multi-Timeframe Key Points Summary
Strong bullish market, behavioral and technical stability.
Breakout >106,100 $ = legitimate bullish extension, 110k+ target.
Invalidation below 102k $: go to cash, wait for stabilization.
Volatility expected around (Fed/geopolitical) events: adjust sizing/stops accordingly.
__________________________________________________________________________________
Fundamental, Macro & On-Chain Analysis
Fed (FOMC June 17–18): Major breakout/volatility catalyst.
Geopolitical tensions (Israel/Iran): Risk-off spikes expected, watch liquidity zones.
On-chain: Key support at 100–102k $; no major distribution, long-term holders remain strong, options/futures point to underpriced volatility risk.
Strategy: Prefer gradual accumulation on supports, reduce exposure pre-Fed, confirm new swings post-FOMC.
__________________________________________________________________________________
Action Plan Summary
Accumulate on pullback 104,250–102,600 $, stop below 101,900 $.
Breakout >106,100 $: Target 110k–111k $, partial TP, monitor volume/volatility.
Avoid overtrading pre-FOMC or amid major geopolitical news.
Risk/Reward >2 on pullback – strict management mandatory.
__________________________________________________________________________________
Conclusion & Context Mastery
The market remains structurally bullish and supported by the combination of technical, sector and on-chain factors. However, macro/geopolitical volatility requires increased caution as the FOMC approaches. Focus on support entries, avoid chasing resistance until confirmed, and apply tight stops in this catalyst-rich context.
__________________________________________________________________________________
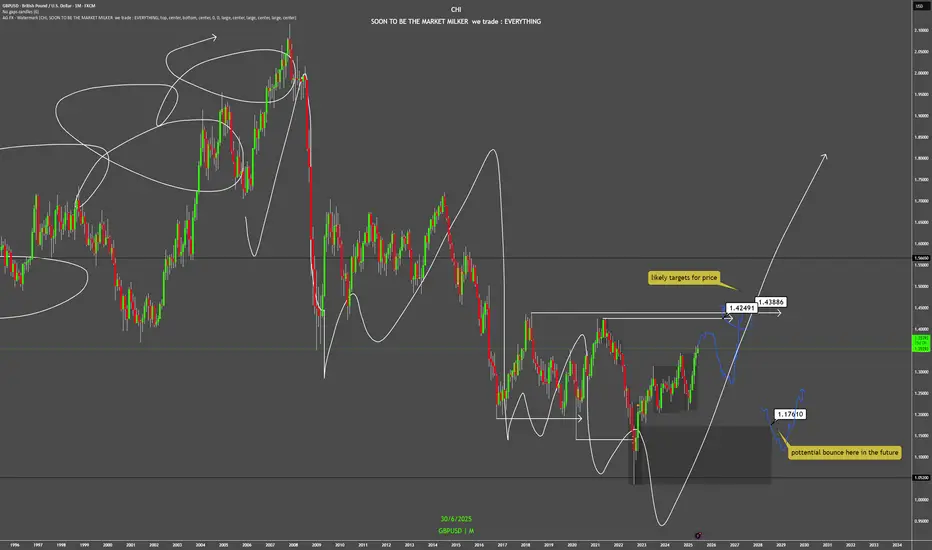
Macro Analysis (GBP/USD)Likely aiming for 1.42491 and 1.43886 as potential targets.
There's also a possibility of a bounce near 1.17610 in the future.
The yearly timeframe failed at 1.05200 back in 2022, suggesting we're sitting at the bottom of the range.
Quick analysis — Despite all the social and political controversy in the UK, the macro chart clearly shows a long-term downtrend. Until price closes strongly above 1.43886, that's when this pair might have a chance vs the US dollar. (1.72062 for some stronger confidence lol)
That said, the past five monthly candles have all been green, showing some momentum and short to mid-term strength. Could easily just be a pullback before continuing lower, breaking below 1.05200, which honestly, wouldn’t surprise me.
But hey, let’s keep it to the charts. WOMEN lie, men lie, but numbers don’t. And this is all just numbers printed in a chart.
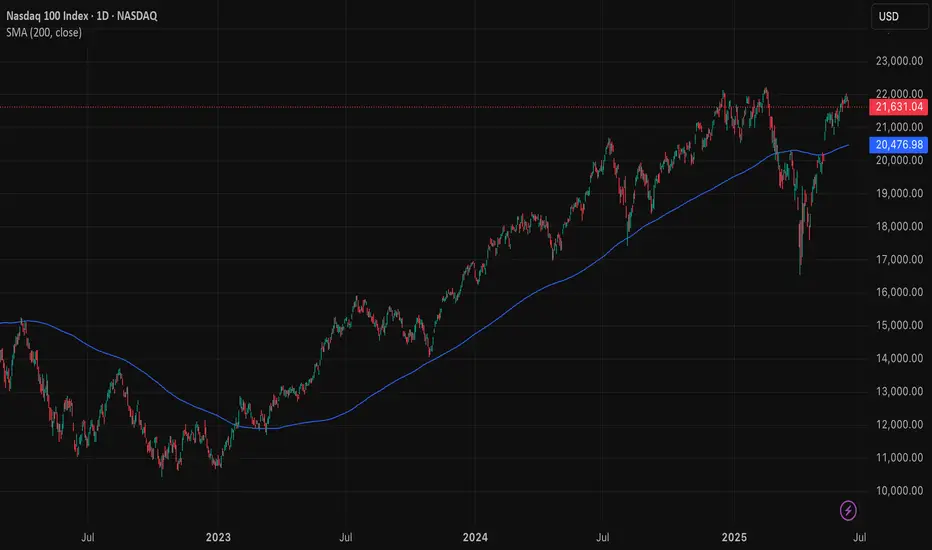
Nasdaq must hold its line, otherwise more downsideMarkets are on edge. The Nasdaq is hovering just above its 200-day moving average and with so much angst in the market, this line must hold. If it breaks, risk sentiment could unravel quickly, and we could see a retest of recent 2025 lows.
The trigger isn’t hard to find. Rising tensions in the Middle East are putting upward pressure on oil and energy. A sustained rally in crude would reignite inflation fears just as central banks begin easing. Powell was supposed to start cutting, but wars are always complicated.
Higher energy costs hit consumers, slow growth and force policymakers to rethink their next moves. That’s a headwind for tech and growth names.
Equities have enjoyed a solid run this year, pricing in a soft landing. But that assumption now feels shaky. Particularly for risky assets like the Nasdaq. The Dow might do better relative. The market isn’t just worried about geopolitics. It’s digesting the reality that inflation remains sticky. Bond yields are rising. Rate cuts are being pushed back. And oil isn’t helping.
If the Nasdaq holds its 200-day line, the bulls stay in control. But a break below will shift the momentum. That’s why this week matters.
We’re watching a simple but powerful signal. Stay above 20,500 and markets can stabilise. Break below, and volatility returns.
This trade is only for the brave. The story is shifting. Stay alert.
The forecasts provided herein are intended for informational purposes only and should not be construed as guarantees of future performance. This is an example only to enhance a consumer's understanding of the strategy being described above and is not to be taken as Blueberry Markets providing personal advice.
BTCUSDT: Pro Analysis, Major Swing Supports, Risk Focus__________________________________________________________________________________
Technical Overview – Summary Points
__________________________________________________________________________________
Momentum & Trends : Short-term consolidation (<1H frames), dominant uptrend 2H–1W. BTC market structure is “Up” across all higher timeframes.
Supports/Resistances :
Major supports: 100,300 – 101,600 USDT (1D/4H/2H pivots)
Resistances: 109,000 – 111,500 USDT (1D/W/12H pivots)
Volume : Recent bearish climax absorbed, back to normal volumes, no current excess.
Multi-TF Behavioral Read : Behavioral indicators (ISPD DIV) are neutral; no extreme sentiment. Risk On / Risk Off Indicator confirms structural buy-side.
__________________________________________________________________________________
Strategic Summary
__________________________________________________________________________________
Global Bias : Bullish trend on high TFs, technical consolidation short term.
Opportunities : Swing entries on return ≥101.6k, TP at 109k/111.5k. Manage position sizes actively before Fed.
Risk Zones : Invalidation <100.3k daily; key area to monitor. Short-term stop-loss below 99.9k.
Macro Catalysts : FOMC (June 17–18) = expected volatility, no major macro risk now. Watch Mideast tensions. Rising tensions in the Middle East (Israel/Iran): volatile climate, potential risk-off sentiment on certain assets, but no widespread panic; to be monitored in case of rapid escalation (possible increased BTC volatility).
Action Plan : Favor gradual entries on major supports, reduce leverage pre-macro events, active volatility and stops monitoring.
__________________________________________________________________________________
Multi-Timeframe Analysis
__________________________________________________________________________________
1D / 12H: Key support at 100.3k–101.6k, major resistance 109–111.5k. Repeated rejections at resistance, mature range. Normal volume, consolidating momentum.
6H / 4H: Strong lateral structure, ISPD/Volume neutral. Technical play around 101.6k, gradual profit-taking below 109k.
2H / 1H: Start of institutional reaction (moderate to high volumes). Bearish climax absorbed, possible short-term rebound at local support 99.9k–101.6k.
30min / 15min: Micro-range, short-term consolidation, some volume spikes on corrections. Downtrend confirmed on lower TFs, despite macro/swing bullish confluence.
ISPD & Risk On / Risk Off Indicator Summary:
ISPD DIV = Neutral across all timeframes.
Risk On / Risk Off Indicator = STRONG BUY on all horizons (US tech strong).
Cross-timeframe Synthesis : BTC market is accumulating on supports under favorable tech sector influence. Short-term consolidation seen as post-shakeout setup for potential resumed uptrend.
__________________________________________________________________________________
Final Synthesis & Operational Plan
__________________________________________________________________________________
BTC market remains in a dominant swing bullish bias, supported by tech sector momentum and on-chain inflows. Key support zones (100.3–101.6k) offer attractive technical swing entries, with targets at 109–111.5k. However, strict risk management is essential ahead of the upcoming FOMC, rising Middle East tensions (Israel/Iran), and the potential for sudden volatility spikes.
Strategy: Maintain bullish exposure with partial profit-taking and reduced leverage into macro/geopolitical events. Systematic stops remain below 99.9k.
__________________________________________________________________________________

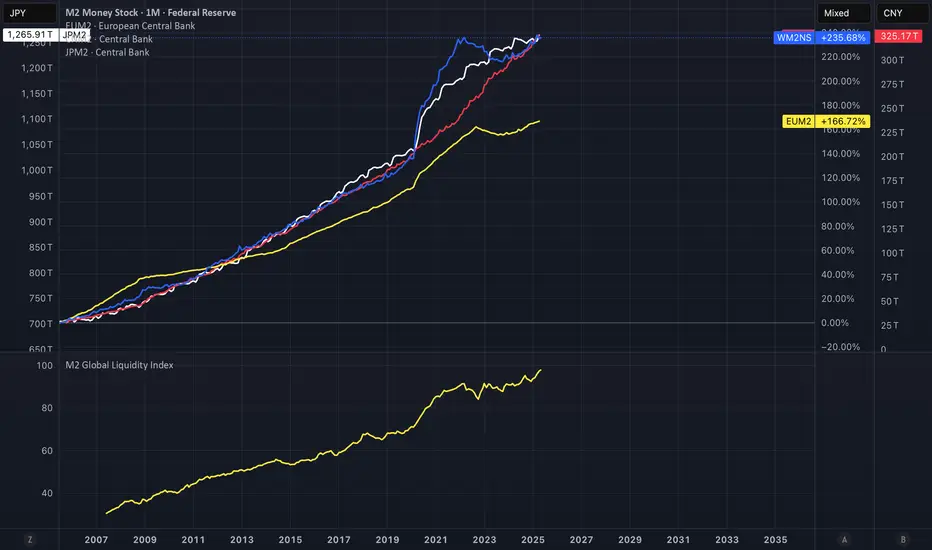
Global M2 Money SupplyWith more money than ever before in circulation available. Asset prices should go up..
Do you agree or disagree?
Bitcoin: Firm supports, play the breakout or dip ahead of CPI__________________________________________________________________________________
Technical Overview – Summary Points
__________________________________________________________________________________
Structurally bullish momentum across all timeframes. No bearish divergence or signs of capitulation detected.
Major supports: 108,291.5; 106,743.9. Key resistances: 109,997.81; 111,949.
Normal volume, robust buying dynamics without climax, no excess in the flows.
Risk On / Risk Off Indicator : “ Strong Buy ” signal from 1D to 1H; only M15 is neutral (micro-consolidation).
No exhaustion or massive profit-taking behaviour. ISPD DIV neutral across all timeframes.
__________________________________________________________________________________
Strategic Summary
__________________________________________________________________________________
Overall bias: Structurally bullish, strong momentum, no imminent major reversal. Possible consolidation ahead of US CPI.
Risk zones: 109.9k–111.9k (historic resistance), key macro event June 11 (CPI).
Catalysts: US inflation figures (CPI), Fed speeches, low implied BTC option volatility.
Action plan: Buy on retracement towards 108.2k/106.7k, or confirmed breakout >111.9k; technical stops below 108.2k & 106.7k; trim risk before CPI if actively managing.
__________________________________________________________________________________
Multi-Timeframe Analysis
__________________________________________________________________________________
1D: Approaching historic resistance, “very strong” trend, no weakness detected.
12H/6H/4H: Strong buying pressure, full indicator alignment, close to a break/rejection at 110–111k.
2H/1H: Persistent intraday momentum, no bearish alert, moderate to dynamic volumes (notably 2H).
30min: Healthy trend, buying pressure, no sign of topping out. Squeeze scenario possible if broken.
15min: Neutral phase, micro-consolidation with supported volume, swift resumption possible post-break resolution.
Risk On / Risk Off Indicator: Strong Buy on all timeframes except 15min (neutral/short pause).
ISPD DIV: Neutral everywhere, environment supports bullish trend continuation.
Volumes: Normal to moderate, no distribution alert or bull trap detected.
__________________________________________________________________________________
Strategic Recap
__________________________________________________________________________________
Primary trend: Structurally bullish, strong multi-timeframe confluence.
Key signal: Accumulation on support, breakout/extension to be considered only on significant volume.
Opportunity: Entry on technical pullback (108.2k/106.7k) or confirmed breakout (>111.9k), swing target 115.4k
Critical risks: US CPI release, extended resistance, hidden volatility
Risk management: Stop below 108.2k/106.7k, reduce cash risk ahead of macro events as needed.
Summary: As long as 108.2k-106.7k support holds, pullbacks are buying opportunities. Strong conviction for upside if 111.9k is broken. Anticipate volatility around US CPI.
__________________________________________________________________________________

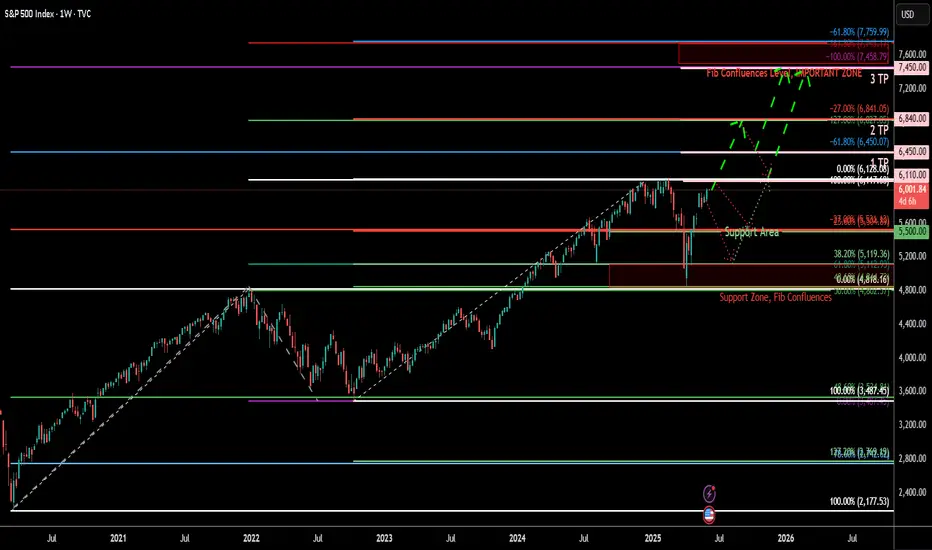
S&P 500 Index (SPX) Weekly TF – 2025
Chart Context:
Tools Used: 3 Fibonacci Tools:
1. One **Fibonacci retracement** (from ATH to bottom)
2. Two **Trend-Based Fibonacci Extensions**
* Key Levels and Zones:
* **Support Zone** (Fib Confluence): \~4,820–5,100
* **Support Area (shallow pullback)**: \~5,500–5,600
* **Resistance & TP Zones:**
* TP1: **6,450** (Fib confluence & -61.8%)
* TP2: **6,840** (-27%)
* TP3: **7,450–7,760** (Major Confluence)
Technical Observations:
* SPX is approaching a **critical resistance** near previous ATH (\~6,128) with projected upward trajectory.
* The **green dashed path** suggests a rally continuation from current \~6,000 levels to TP1 (\~6,450), TP2 (\~6,840), and eventually TP3 (\~7,450–7,760), IF no major macro shock hits.
* The **purple dotted path** suggests a potential retracement first to \~5,600 (shallow correction) or deeper into \~5,120 or even 4,820 zone before continuing the bullish rally.
* The major support zone around **4,820–5,120** includes key Fib retracement levels (38.2% and 61.8%) from both extensions and historical breakout levels.
Fundamental Context:
* US economy shows **resilience** amid soft-landing narrative, though inflation remains sticky.
* The **Federal Reserve** is expected to cut rates in **Q3–Q4 2025**, boosting equity valuations.
* Liquidity expansion and dovish outlook support risk assets, including **equities and crypto**.
* However, **AI-driven tech rally** may be overstretched; a correction could follow earnings disappointments or macro surprises (e.g., jobs or CPI shocks).
Narrative Bias & Scenarios:
**Scenario 1 – Correction Before Rally (Purple Path)**
* If SPX faces macro pushback (e.g., high CPI, hawkish Fed), expect retracement to:
* 5,600 = Fib -23.6% zone
* 5,120–4,820 = Major Fib Confluence Zone
* These would act as **accumulation zones**, setting up next leg up toward TP1 and beyond.
* **Effect on Gold**: May rise temporarily due to risk-off move.
* **Effect on Crypto**: Could stall or correct, especially altcoins.
**Scenario 2 – Straight Rally (Green Path)**
* If Fed confirms cuts and macro remains soft:
* SPX breaks ATH (\~6,128)
* Hits TP1 (\~6,450), TP2 (\~6,840)
* Eventually reaches confluence at **TP3 (7,450–7,760)**
* **Effect on Gold**: May struggle; investor preference for equities.
* **Effect on Crypto**: Strong risk-on appetite, altseason continuation.
Indicators Used:
* 3 Fibonacci levels (retracement + 2 extensions)
* Trendlines (macro and local)
* Confluence mapping
Philosophical/Narrative Layer:
This phase of the market resembles a test of collective confidence. Equity markets nearing ATHs while monetary easing begins reflect a fragile optimism. The Fibonacci levels act as narrative checkpoints — psychological as much as mathematical. Will we rally on faith or fall for rebalancing?
Bias & Strategy Implication:
Bias: Bullish with caution
* Strategy:
* Await **confirmation breakout >6,128** for fresh long entries
* Accumulate on dips in the **5,100–5,500** zone if correction unfolds
* Use **TP1, TP2, TP3** as staged exits
Related Reference Charts:
* BTC.D Analysis – Bearish Bias:
* TOTAL:Bullish Bias
*TOTAL3 – Bullish Bias:
* US10Y Yield – Falling Bias Impact:https://tradingview.sweetlogin.com/chart/US10Y/45w6qkWl-US10Y-10-Year-Treasury-Yield-Weekly-TF-2025/
NOKJPY – Detailed Macro Analysis & Trade IdeaMacro Bias: LONG NOK / SHORT JPY
Why NOKJPY?
1. Fundamental Macro (ENDO):
Norway (NOK):
Strong inflationary pressure, positive PMI, robust M2 growth.
Massive fiscal surplus driven by energy exports – best debt/GDP ratio in the G10.
Norges Bank still maintaining relatively high interest rates.
Positive Terms of Trade, central bank balance sheet (CBBS) is shrinking (long-term bullish for NOK).
Japan (JPY):
Economic stagnation and deflationary risks, weak PMI and consumer spending.
Negative real yields, central bank remains ultra-accommodative, extreme debt/GDP ratio.
Persistent deflationary sentiment – classic “funding currency” for global carry trades.
2. COT Positioning (Commitments of Traders):
JPY is the most crowded short in the entire G10: hedge funds and leveraged funds are aggressively short JPY.
NOK positioning is neutral to slightly long – no overcrowding risk on the long side.
3. EXO & Sentiment Signals:
Terms-of-trade and projected GDP/CPI all favor NOK.
Sentiment, macro “score,” and risk/reward models consistently generate a long NOKJPY signal.
Exogenous indicators (futures, commodity impulse, sentiment, parity) all support NOK strength.
4. Technicals & Carry Edge:
NOKJPY remains in a strong multi-month uptrend.
Major carry advantage: NOK rates are much higher than JPY, yielding significant positive swap.
Every recent pullback has been bought, and momentum remains bullish.
Key Reasons for the Trade:
Multi-model consensus: No contradiction between macro, COT, exo, and technicals.
NOK is “king of G10” by every fundamental measure; JPY is the weakest currency this cycle.
Textbook carry trade for 2025.
Risks:
Only a sudden global “risk-off” or a central bank policy shock could temporarily disrupt the trend.
Currently, there is no crowding risk on NOK longs.
SUMMARY:
LONG NOKJPY is the cleanest, highest-conviction swing trade for this cycle – every model (macro, COT, exo, sentiment, carry) is in agreement.
Every meaningful pullback is a buying opportunity.

BTCUSDT Analysis – Pivot 103k/106k, strategy and key zones__________________________________________________________________________________
Technical Overview – Summary Points
__________________________________________________________________________________
Momentum : Bullish structure on 1D/12H (MTFTI “Up”), but short-term consolidation (1H-2H “Down”). Momentum exhaustion observed.
Key Supports/Resistances : Resistances: 105287.8 / 106743.9 / 109952.8 / 111949. Supports: 103033.3 / 100333.3 / 93337.4. Repeated rejections below 105-106k, active testing of 103-100k supports.
Volume : Normal or slightly elevated on all timeframes. No capitulation or euphoric extremes detected.
Multi-TF Behaviour : Strong sector leadership (Risk On / Risk Off Indicator = “Strong Buy” across all frames; growth stocks > market). No behavioural anomalies on ISPD DIV. High-cycle consolidation below resistance.
__________________________________________________________________________________
Strategic Summary
__________________________________________________________________________________
Overall Bias : Neutral/bullish as long as 103k/100k holds. Bullish momentum intact, but short-term caution warranted.
Opportunities : Defensive buys/technical pullbacks above 103k; scalp/range trading 103-106k.
Risk Zones : Confirmed breakdown below 100k or acceleration in LTH distribution.
Macro Catalysts : Next FOMC June 17-18; no major short-term events identified (recent neutral macro, FOMC is key for swings).
Action Plan : Prioritize strict stops (≥3%) near pivots, consistent monitoring of behaviour/volume. Avoid overexposure pre-FOMC.
__________________________________________________________________________________
Multi-Timeframe Analysis
__________________________________________________________________________________
1D : Structuring range below 109952.8-111949 resistances. Bullish HTF trend, but momentum pausing. Average volume. Risk On / Risk Off Indicator “Strong Buy”. No extreme ISPD signals (neutral).
12H – 6H : Consolidation; supports holding, no euphoric confirmation (normal volumes, ISPD DIV neutral). Sector leadership unchanged.
4H : Compression below 105287.8. Moderate volume. Defensive resumption on supports. MTFTI bullish. Dynamic risk: monitor for sell-side capitulation.
2H – 1H : Technical correction, active retest of 105k (range 103-105k). Absorption volume. MTFTI “Down”.
30min – 15min : Short-term positive bias above 103k. Risk of false break if volume remains low. Risk On / Risk Off Indicator “Buy”/“Strong Buy”.
Cross-Indicators : Market leadership confirmed: Risk On / Risk Off Indicator = Strong Buy on all frames >15min. No excess behaviour or significant divergences detected. Key ranges: 103k-105k. On-chain: heavy LTH profit-taking but no panic.
Summary : BTC market in post-cycle-high congestion phase, structurally robust, but momentum recalibrating with fewer “easy trades.”
__________________________________________________________________________________
Cross insights & on-chain summary
__________________________________________________________________________________
On-chain (Glassnode) : Top at $111.8k, correction to $103.2k by LTH profit-taking. Spot accumulation on $103.7k/$95.6k. Upside limited unless fresh buying flows return.
Macro events : Awaiting FOMC; no recent surprises. Price action and levels dominate short-term strategy.
Stops/invalidation : Swing long defended at 103k/100k (stop <100k H4). Partial short/sell below 106743.9/109952.8. Dynamic targets: 106-109.9k; extension: 111.8k if breakout on volume.
__________________________________________________________________________________
Conclusion & Actionable Plan
__________________________________________________________________________________
Market condition:
- High consolidation, ranging below major resistances.
- Long-term bullish, short-term momentum fading.
- Neutral/bullish if 100-103k holds.
- “No macro — only levels” until FOMC or volatility catalyst.
Tactical decision:
- Trade technically, stops ≥3% under supports.
- Defended buys at 103k (stop <100k), partial profit 106-109k.
- Continuous monitoring of volume/on-chain zone reaction.
- Aggressive exit/hedge below support, target 96k/83k.
__________________________________________________________________________________
100% analysis based on TradingView multi-TF, Glassnode on-chain, macro calendar and risk management.
__________________________________________________________________________________

BTC Tactical rebound or flush? Decision point at $103700 support__________________________________________________________________________________
Technical Overview – Summary Points
➤ Strong overall momentum across all swing/weekly timeframes, clear advantage to buyers.
➤ Key support at 103,700–104,000 USDT (chart/on-chain confluence, maximum visibility on all timeframes).
➤ Major technical resistance zone at 111,000–112,000 USDT (ATH + HTF pivots).
➤ Volumes normal to moderate, no directional climax or emotional excess in short and mid-term.
➤ Risk On / Risk Off Indicator remains strongly positive, indicating persistent sector outperformance.
➤ Only short-term weakness detected: temporary bearish trend on 2H/1H/30min/15min, typical of a short-term flush within a bullish structural context.
__________________________________________________________________________________
Strategic Summary
➤ Main bias: Bullish for swing approaches as long as $103,700 holds on closing.
➤ Opportunity: Buy on support on any retest 103,700–104,000 USDT with stop <102,000 USDT.
➤ Partial target: Take profits at 105–106k, then 111–112k.
➤ Risk zones: Confirmed break below 103,700 USDT with high volume = potential flush to 97–98k or even 95–96k.
➤ Catalysts: Quiet macro calendar until NFP (06/06) & FOMC (mid-June) — increased monitoring as these events approach.
➤ Action plan: Tactical intervention on support pullback, reduce exposure before major events.
__________________________________________________________________________________
Multi-Timeframe Analysis
1D/1W : Major structure fully bullish. No underlying reversal, stable volume, solid momentum. Risk On / Risk Off Indicator fully “On Risk”, no behavioral excess.
12H/6H: Sector momentum and volumes validate all swing-long entries on dips. Key supports 103,700–104,000 USDT consistently defended across timeframes.
4H/2H: Bullish bias maintained, healthy structure. Slight intraday weakness: 2H softens, moderately high volumes without extremes.
1H/30m/15m: Short-term bearish bias across all LTF — profit taking impact, typical technical flush on support. Bearish signals do NOT invalidate HTF bullish trend, but require tactical vigilance.
Risk Summary: A fast drop below 103,700 USDT with volume would validate a flash liquidation scenario to 97–98k. Pullback in mature bull phase, strongly defended at the key support: timing for “mean reversion” on volume reaction, else wait for lower setups.
Risk On / Risk Off Indicator: Still “On Risk”, strong tech/growth sector momentum on daily/swing.
ISPD: No behavioral excess, neutral/median histogram across timeframes.
Volumes: Normal/moderate, no exhaustion spike nor major selling.
On-chain: Mature distribution, LTH profit-taking; key supports at $103,700, $97,100, $95,600.
__________________________________________________________________________________
Strategic Synthesis & Bias
Market in mature bullish consolidation, HTF structure robust as long as 103,700 USDT holds.
Active opportunity window until NFP & FOMC: prioritize swing/mean-revert setups.
Required stop for any trade: strictly below $102,000.
Smart monitoring of volumes & sentiment: confirmed support break + volume = wait for lower rebound.
No excessive panic or exuberance signals: strong RR if re-entering the main range.
Actively manage exposure approaching macro events.
Operational summary:
• Buy at 103,700–104,000 USDT, stop <102,000.
• Partial profits at 105–106k, final offload at 111–112k.
• Reduce exposure ahead of NFP/FOMC.
• If break of 103,700 USDT: stop and wait for $97–98k or $95–96k.
__________________________________________________________________________________
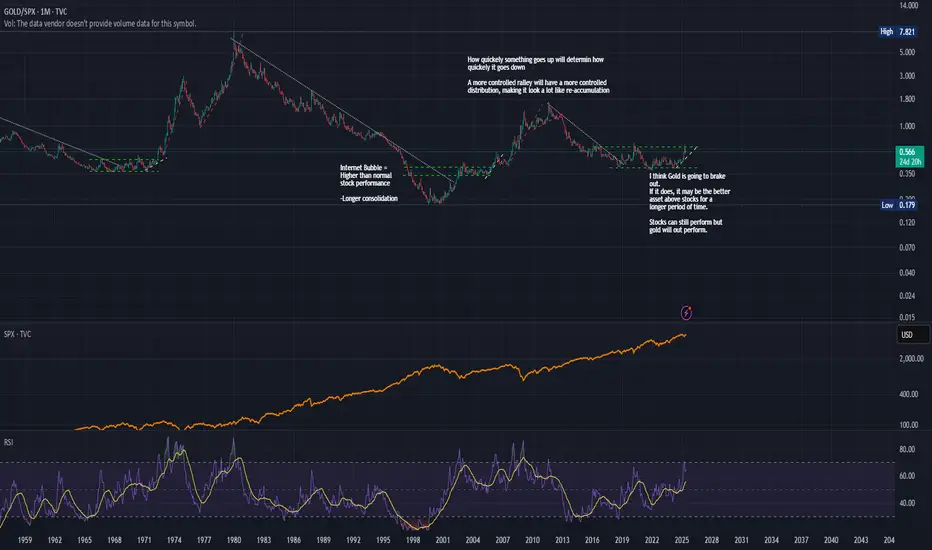
Macro Gold vs Stocks - Is it finally the Gold Bug's turn?When you zoom out things become more clear.
Has it always been that easy? Easy to see in hindsight difficult to execute over years and hold strong.
Trust the trends and when they break, you best be on your toes. It will never be the same but similar.
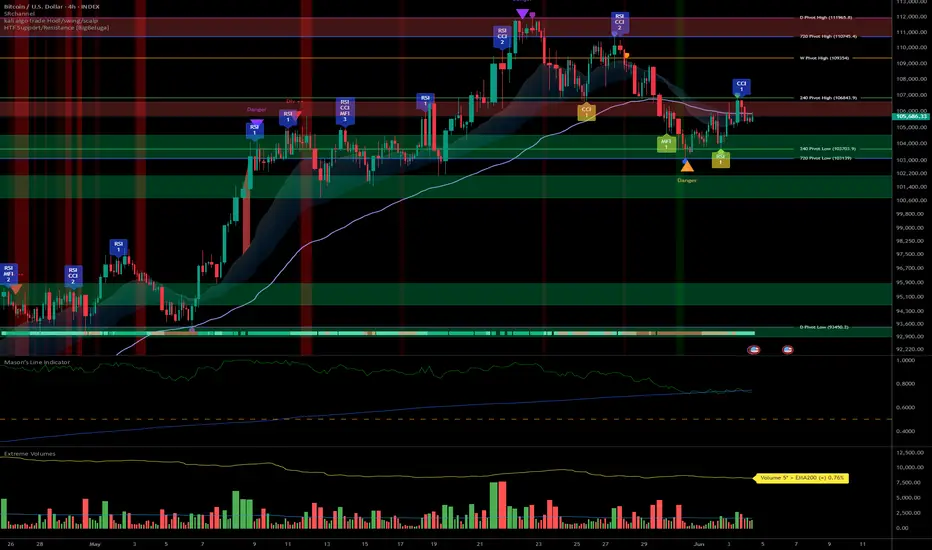
Tactical BTCUSDT Swing: Persistent Risk On, Key Stop at 103,000__________________________________________________________________________________
Technical Overview – Summary Points
__________________________________________________________________________________
Momentum: Strong bullish sectoral momentum (Risk On / Risk Off Indicator on strong buy across all timeframes), but momentum is fading just below key resistances.
Supports/resistances: Key 104,179–103,086 area tested on every timeframe, consolidating a major price floor. Upside targets: 109,588 then 111,980.
Volume: Stable liquidity, no anomaly spike or structural rupture. Volumes consistent with trend; moderate pickup in activity near supports, no climax.
Market behavior: Investor Satisfaction Indicator is neutral on all timeframes except 1H (behavioral buy signal to monitor). No euphoria or panic, no aggressive accumulation.
__________________________________________________________________________________
Strategic Summary
__________________________________________________________________________________
Global bias: Cautiously bullish as long as 104,179–103,086 pivot support holds. Risk On / Risk Off Indicator gives a strong bullish sector signal. Macro backdrop neutral, low volatility.
Opportunities: Swing timing on pullback to support confirmed on 1H/4H, targets 109,500/111,980. Wait for daily/4H confirmation before full allocation.
Risk zones: Strong invalidation under 103,086, alert under 104,179. Suggested technical stop-loss below 103,000 USDT.
Macro catalysts: Watch ECB and Fed (8:30–9:45 UTC, Thursday). Expect possible volatility spike, adjust sizing and stop accordingly.
Action plan: Active swing trading off support, dynamic stops, partial exposure ahead of major events. Active risk/reward management (>2.5), upside targets on technical pivots, liquidity is normal.
__________________________________________________________________________________
Multi-Timeframe Analysis
__________________________________________________________________________________
: Global uptrend but fading momentum below ATH. Major support 104,179–103,086, no clear behavioral signals. Risk On / Risk Off Indicator strong buy, volumes stable.
: Strong tech sector bias (Risk On / Risk Off Indicator strong buy), support at 104,179. ISPD DIV neutral, volumes normal.
: Pause/consolidation above multidimensional support (104,179). Healthy but cautious structure.
: Consolidation >104,179, long positioning remains valid as long as support holds; no clear short-term behavioral inflow.
: Testing key support, first signs of indecision. Increased watchfulness recommended.
: First short-term behavioral buy signal (ISPD DIV/mason's), optimal tactical allocation timing if 104,179 support is defended.
: Intraday range on support, no emotional spike or break volume.
: Local flush, defensive rebound off support, short-term range scenario; potential technical bounce.
Cross-timeframe summary:
- 104,179 is the key defensive multi-support area, tested across all TFs.
- Risk On / Risk Off Indicator is bullish across the board, except behavioral divergence (ISPD DIV Buy on 1H only).
- No panic or rupture volumes detected.
- Immediate risk if breakdown below 104,179 and/or 103,086: opens door to intraday bearish extension toward 93,377.
__________________________________________________________________________________
STRATEGIC OUTLOOK – Final Summary
__________________________________________________________________________________
Technical setup: Solid consolidation above 104,179/103,086 supports, sectoral buying confirmed. No major deterioration unless a clear breakdown occurs.
Opportunity: Short-term swing entry on 1H/4H signal, target 109,500–111,980. Stop-loss below 103,000 advised.
Risk: Downside acceleration if support breaks, especially if LTH profit taking continues or spot demand fades.
Macro: Calm backdrop, ECB and Fed decisive for short-term volatility. Watch post-announcement market action.
On-chain: Significant profit-taking near highs, no euphoria, positive risk/reward if stops are respected.
Operational summary:
Cautiously bullish while 104,179/103,086 hold.
Tactical swing entry possible on pullback and confirmed signal (1H or 4H).
Strict stop management below 103,000, reduced exposure before key ECB/Fed events.
Upside targets: 109,588 – 111,980.
Monitor volumes and behavioral signals post-news.
Key levels to watch:
Supports: 104,179, 103,086
Resistances: 109,588, 111,980
Macro alerts: ECB/Fed (Thursday morning, 8:30–9:45 UTC)
Behavioral ISPD DIV signal after news
Suggested stop-loss : < 103,000 USDT (as of 01/06/2025, 22:56 CEST)
Comprehensive analysis based on multi-timeframe technical structure, Risk On / Risk Off Indicator and ISPD DIV behavioral/mason's confirmations. Remain disciplined and flexible in risk management.
__________________________________________________________________________________

BTC at resistance: tactical swing plan for bulls <106.7k __________________________________________________________________________________
Technical Overview – Summary Points
__________________________________________________________________________________
Momentum: Dominant bullish structure across all timeframes, major resistance at 106.7k–112k.
Supports/Resistances: 106743 (multi-TF pivot), 103000–105000 (key supports). Price compressed below main resistance.
Volume: Normal to moderately high, a few occasional yellow spikes, no massive distribution or capitulation.
Behavior Multi-TF: Risk On / Risk Off Indicator bullish at every horizon. Behavioral indicator (ISPD DIV) in constant buy zone, no orange anomaly.
__________________________________________________________________________________
Strategic Summary
__________________________________________________________________________________
Overall Bias: Bullish structure intact, sustained momentum up to the critical 106.7k–112k resistance.
Opportunities: Swing entries on 103–105k support clusters, long scalps on 15–30min signals, partial exits near/under key resistances.
Risk Zones: Confirmed break below 103k = major bearish alert, repeated rejection below 106.7k–112k = risk of extended/distributive range.
Macro Catalysts: US data (ADP, ISM, PMI), stablecoin/GENIUS regulation. High-volatility windows expected during major news (03/06–04/06).
Action Plan: Active management, progressive reinforcement on pullbacks, controlled exposure below resistance, stop-loss advised < 103k.
__________________________________________________________________________________
Multi-Timeframe Analysis
__________________________________________________________________________________
Daily: Pivot High 1D: 111949/ Pivot Low 1D: 93337.4. Stalled below 106.7k–112k. Normal volume, strong software sector/ Risk On / Risk Off Indicator buy signal, healthy behaviors.
12H – 4H: Compression in 104.5k–106.7k/109.9k. Cautious bullish bias, localized volume clusters, all buy signals except on immediate resistance tests.
2H – 1H: Technical pullbacks at 104k, micro-range 105–106k. Momentum intact, 15–30min buy signals on every support retest.
30min – 15min: High intraday volatility, liquidity absorption at supports, active ranging phase. Risk On / Risk Off Indicator and ISPD consistently bullish.
ISPD & Risk On / Risk Off Indicator Summary: Buy alignment across the board, no behavioral deviation, strong sector support.
__________________________________________________________________________________
Summary:
BTC/USDT remains capped beneath the 106.7k–112k resistance, but all multi-TF, behavioral, and sector signals stay bullish above 103k. Favored setup: active management around supports, prudent profit-taking below resistance, intensified macro monitoring.
__________________________________________________________________________________
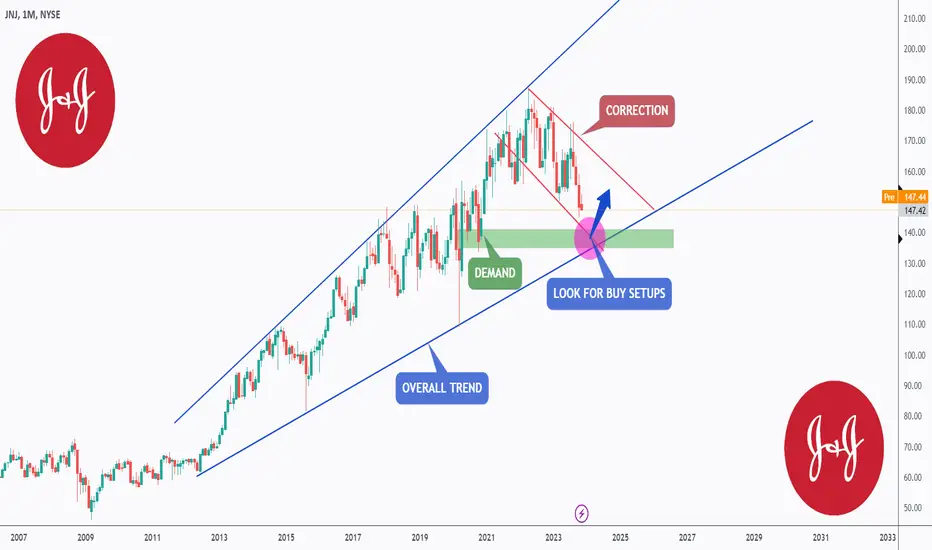
JNJ - Macro View 🌐Hello TradingView Family / Fellow Traders. This is Richard, also known as theSignalyst.
📈 JNJ has exhibited an overall bullish trend, trading within the ascending wedge pattern outlined in blue. It is presently nearing the lower boundary/blue trendline.
At present, JNJ is undergoing a correction phase and is trading within the descending red channel. It is currently approaching the lower limit and a highlighted demand zone in green.
🏹 Thus, the highlighted purple circle is a strong area to look for buy setups as it is the intersection of the green demand and lower blue and red trendlines acting as a non-horizontal support.
📚 As per my trading style:
As JNJ approaches the lower purple circle zone, I will be looking for bullish reversal setups (like a double bottom pattern, trendline break , and so on...)
📚 Always follow your trading plan regarding entry, risk management, and trade management.
Good luck!
All Strategies Are Good; If Managed Properly!
~Rich