How to import Quandl data into TradingViewQuandl is a data library with all sorts of useful macroeconomic data. Unfortunately a lot of it you have to pay for, but there are also many data series you can access for free, including the "Blockchain" library with lots of useful data such as Bitcoin transaction fees.
To access Quandl data, go to quandl.com. In the left-hand column, check the "Free" box to ensure your search results include only free data sets. Then type what you're looking for in the text box (e.g. "US wages" or "Bitcoin transaction cost"). Click the name of a data set in the search results. You should now see a chart. On the right hand side of the chart, click the "TradingView" button to import to TradingView.
For an example of how to use this data, watch the video or check out my previous idea on Bitcoin transaction fees as a predictor of Bitcoin's price:
Macroeconomics

What's Silver's next moves? Following the recent pump on silver up to around 30, many have been scratching their heads about the dump down to around 26. There is word on the block that Silver is heading to 500 but the so-called gurus are not saying within what time frame that might happen.
The chart time frame shown is a macro-economic one - the weekly. Always look higher.
I highlight some similarities looking back to 2007-2008.
My probabilistic estimate (not a prediction) is that on this time frame it is more likely than not that Silver goes south. (for every probability estimate in one direction there is a residual probability in the opposite). I've given my reasoning based on macro-economic cycles in the video. The whole world is overdue a downturn in a macro-economic cycle - a pattern which has been very robust for decades. This time around it would be interesting if we do avoid that downturn. If so, Silver is likely to punch north.
Those who have other ideas for Silver going far north, are invited to give their commentary with reasons. Let's learn from each other.
Disclaimers : This is not advice or encouragement to trade securities on live accounts. Chart positions shown are not suggestions. No predictions and no guarantees supplied or implied. Heavy losses can be expected if trading live accounts. Any previous advantageous performance shown in other scenarios, is not indicative of future performance. If you make decisions based on opinion expressed here or on my profile and you lose your money, kindly sue yourself.

Is Crypto in a Bubble?!?Do you think crypto is in a bubble? Or will it continue to go higher?
Tune in to my live stream this Sunday January 31st at 5:30pm EST to respectfully discuss and debate!
Share your opinions and questions in the comments, they will be answered!

Live Stream! Understand the System!Live stream at 5:30pm EST focusing on the overall monetary system and its history!
Questions will be answered and are encouraged!

GDP is Collapsing!If you compare GDP to the amount of currency in existence, it has been falling for 2 decades!
Remember, M2 is a fraction of the total money supply, therefore GDP has fallen by even more!
Ironically, people fail to realize that Money Velocity, what they point to as causing "deflation", is a much better indicator of stagflation!
It is likely that the exploding currency supply will begin to leak into goods and services rather than remain within the financial system!
This will send GDP higher, which of course all the politicians will point to as proof of the success of their policies, but in reality this will simply means bigger bills for you at the grocery store!

How to Choose the Right Stocks to Invest inIn this analysis, I'll be talking about the two approaches you can take in choosing the right stocks to invest in: the top down, and bottom up analysis methods.
I have seen posts explaining the top down and bottom up analyses by time frames, but that's not correct.
Time frames don't have anything to do with this approach.
If you wish to check out my other educational post on how to properly use the fibonacci retracement tool (as many people get confused with this as well), click on the post below.
Bottom Up Analysis Explained
- The bottom up method is the method that the majority uses to analyze stocks.
- The investor first chooses a stock that he wants to potentially invest in.
- Then, he analyzes the financials of the company, and compares it with that of other companies in the same industry
- Afterwards, he assesses the industry itself, and decides whether the industry as a whole is prominent and healthy
- Lastly, he takes a look at the entire macroeconomic situation, and assess if this is the best time to get in the stock that he has his eyes on.
Top Down Analysis Explained
- With the top down method, everything is done in the same way, but in reverse.
- The investor first asks himself what the macroeconomic situation is like, and which country he should invest in.
- He even takes a look at factors like demographics change (which is actually much more important than most people think it is)
- Afterwards, the investor takes a look at which sector he should invest in.
- Once he chooses a sector, he goes through all the individual companies he could potentially have his money on
- He goes through a list of the companies in that sector, and compares each and every one of them.
- Once he chooses the most prominent company in the sector, he takes a look at the company's financials, and decides whether to invest or not.
Conclusion
Broadly speaking, there are two methods of approach in choosing the right stocks to invest in. Since most retail investors hardly conduct top-down analysis, it might be a good idea to test out different approaches in choosing winning stocks.
If you like this educational post, please make sure to like, and follow for more quality content!
If you have any questions or comments, feel free to comment below! :)

Dollar Chop or Drop?Will the Dollar see some more chop or will it continue to crater?
I predict a continued cratering!

Hiding in Plain Sight!A massive cup and handle pattern has been completed on Silver!
This same patterns can be seen on the charts of the price of gold and silver in Venezuela and Zimbabwe before their hyperinflations!

Manipulation is Ending!As demand for physical gold and silver explode, the banksters' ability to keep prices artificially low are failing!
Scotiabank ended it's 350-year role in the precious metals market and J.P. Morgan (the most infamous manipulator) is no longer net short after the bear trap in March 2020.
The banks who do not terminate their short positions will suffer massive losses as gold and silver prices soar, just like A.I.G., Bear Sterns, The Lehman Brothers and Merill Lynch in 2008!

The Dollar is Going Down!The Federal Reserve is accomplishing its 108-year plan of the total destruction of the U.S. dollar!
While there may be a correction coming, the Euro is clearly a safer currency than the U.S. dollar and will appreciate against it in the long term.
The inter-bank lending market is completely communist at this point, the Federal Reserve is alleviating any semblance of a lack of dollars worldwide, and any remaining reasons to continue using the U.S. dollar as a world reserve currency are rapidly disappearing!

Hyperinflation!The stock market has increased exponentially since 1913! But only priced in fiat paper/digital currency!
When priced in gold , the DJI has and will continue to make lower lows!
You don't hear about the epic crash of 1980, but priced in gold , stocks crashed more in 1980 than in 1929!
Stocks may very well go to the moon, but priced in commodities and tangible assets, they will continue to stagnate and crash!

Hyperinflation!The stock market has increased exponentially since 1913! But only priced in fiat paper/digital currency!
When priced in gold, the DJI has and will continue to make lower lows!
You don't hear about the epic crash of 1980, but priced in gold, stocks crashed more in 1980 than in 1929!
Stocks may very well go to the moon, but priced in commodities and tangible assets, they will continue to stagnate and crash!

The U.S. Dollar Could Bounce From Here!!!I Am Massively Bearish On the Dollar, But If There Was Ever A Time For It To Bounce, It Is Here!!!
Algorithms Have Been Using The Little Known-.886 Retracement Level Recently!


BIG RUN IS HERE!SCOTIABANK CLOSED THEIR MASSIVE 200+ YEAR SHORT POSITION AT THE LOWS TWO WEEKS AGO!
GET READY FOR TAKEOFF! NEXT STOP, 35$!


SUPPLY BECOMES DEMAND, RESISTANCE BECOMES SUPPORT!DO NOT LET YOUR EMOTIONS GET THE BEST OF YOU!
GRABBING A BULL BY THE HORNS IS NOT EASY, I CAN'T IMAGINE FOR ALOT OF YOU ROOKIES HOW DIFFICULT IT IS TO RIDE IT! XD
EVERYONE IS DISSING GOLD AND FAWNING OVER BITCOIN, WE'VE SEEN THIS BEFORE!

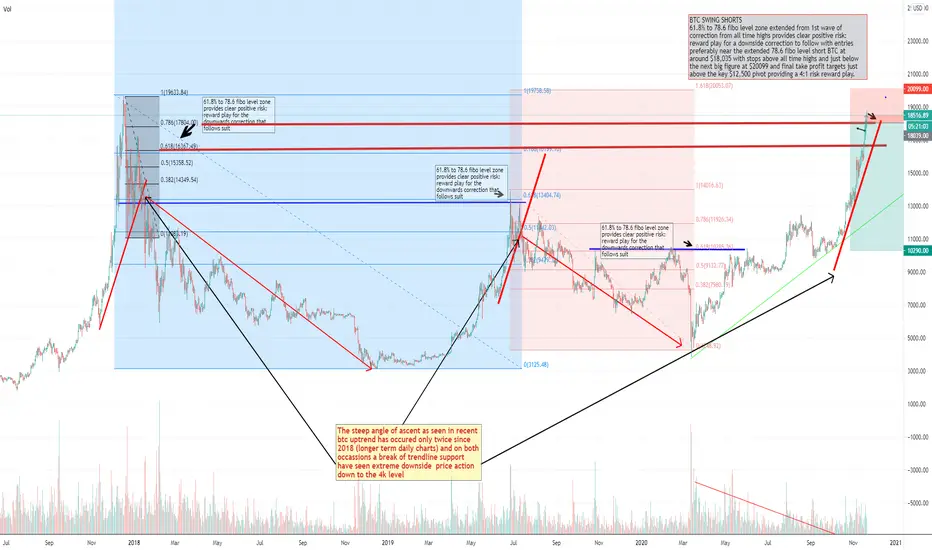
THE BIG SHORT: UPDATE - The Big BTC ShortThe steep angle of ascent as seen in this most recent BTC bull run has occured only twice since 2018 (longer term daily chart), both seeing BTC trade sub $4k vs. USD within the coming weeks.
- Break of trendline support would be confirmation that BTC bulls have exhausted and an equally vicious downside swing is in store
- Shorts on breakouts below the recent uptrend support level open the door high r:r opportunities
- Holding medium to long term short positions with stops above 20k barrier and likely to add to position on a breakout below the recent extreme angle of ascent on trendline support as its provides confirmation of most likely choppy price action followed by a steep downtrend in BTC
Long run, I am long BTC...swing trades on short or long side are to accumulate more BTC holdings.
Trades are based on top down macro-economic fundamentals with technicals primarily applied for risk mgmt purposes to attain high r:r setups
HYPERINFLATION!ALL FIAT CURRENCY PRICES WILL CONTINUE TO RISE!
BUT THE PURCHASING POWER OF EQUITIES WILL CONTINUE TO CRASH!


STOCKS WON'T TRULY GO UP!THE NOMINAL PRICE OF EQUITIES, PRICED IN U$Ds, MAY VERY WELL CONTINUE TO RISE AND MAKE NEW ALL-TIME HIGHS!
BUT THEY WILL NOT RISE AS FAST AS THE PRICE OF FOOD, OTHER COMMODITIES OR THE PRICE OF PRECIOUS METALS (REAL MONEY)!
THEREFORE, THEIR PURCHASING POWER WILL HAVE IN FACT FALLEN!

BTC 0$ INCOMING! 0 x 0 = 0THERE IS SO MUCH HYPE!
BTC WILL BE WORTH NOT A SINGLE UNIT OF ANY COMMODITY, GOOD, SERVICE OR ASSET AFTER 2021!
0 x 0 = 0

UP OR DOWN?INTEREST RATES WOULD RISE IF PRICES WERE TRULY DETERMINED BY FREE MARKET SUPPLY AND DEMAND!
BUT THE CENTRAL BANKS WILL MONETIZE EVERY GOVERNMENT BOND IN EXISTENCE BEFORE THEY ALLOW YIELDS TO ENDANGER THE SOLVENCY OF ANY GOVERNMENT!
IF THERE IS AN EXPLOSION IN YIELDS, FORCING CENTRAL BANKS TO ENGAGE IN UNPRECEDENTED LEVELS OF MONETIZATION, THIS WILL UNDERMINE FAITH IN THE PURCHASING POWER OF CURRENCY, LEADING TO A COMPLETE SELL-OFF IN ALL BOND MARKETS, FORCING OVERALL INTEREST RATES MUCH HIGHER!
THE INEVITABLE OUTCOME OF ALL THE ACTIONS OF THE CENTRAL BANKS AND THE OVERALL IMPLOSION OF THE FINANCIAL SYSTEM IS CLEAR: HYPERINFLATION!
