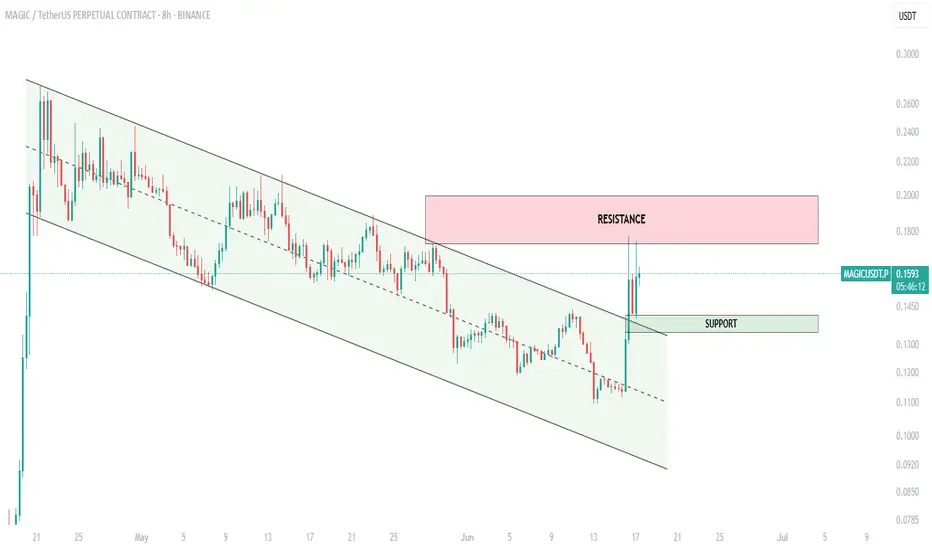
$MAGIC broke out!After weeks of grinding inside a falling channel, OMXTSE:MAGIC finally broke out with a sharp 20% move!
- Channel breakout confirmed
- Price reclaimed the support zone around $0.145
- Resistance zone ahead: $0.185–$0.20
Now it’s all about momentum. If bulls hold above the breakout area, we could see further continuation toward the upper resistance.
Trade smart — avoid FOMO. To ride the wave further, wait for a retest or clear strength above resistance.
This is how a clean technical structure plays out.
Magicusdtbuy
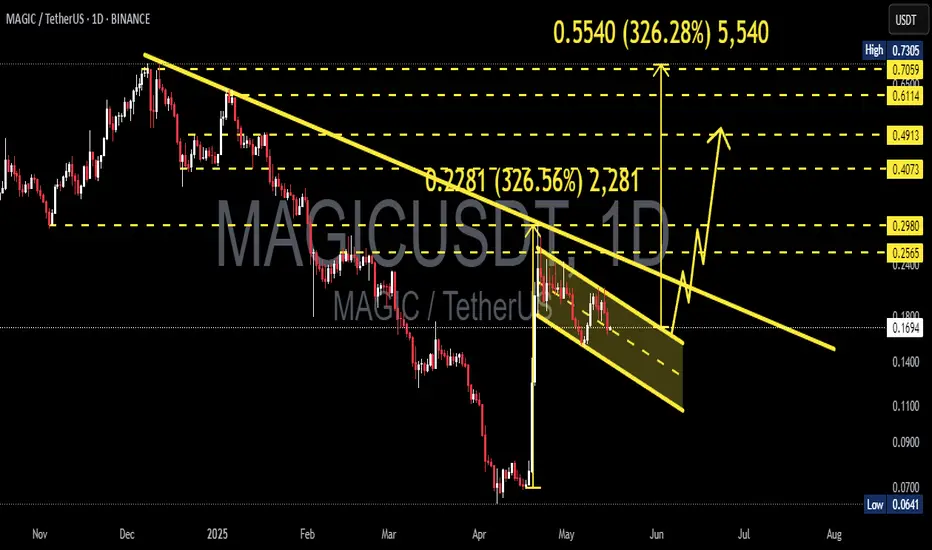
MAGICUSDT 1D AnalysisMAGIC ~ 1D Analysis
#MAGIC Buy gradually after successfully breaking through the resistance line of this pattern with a short-term target of at least 10%++
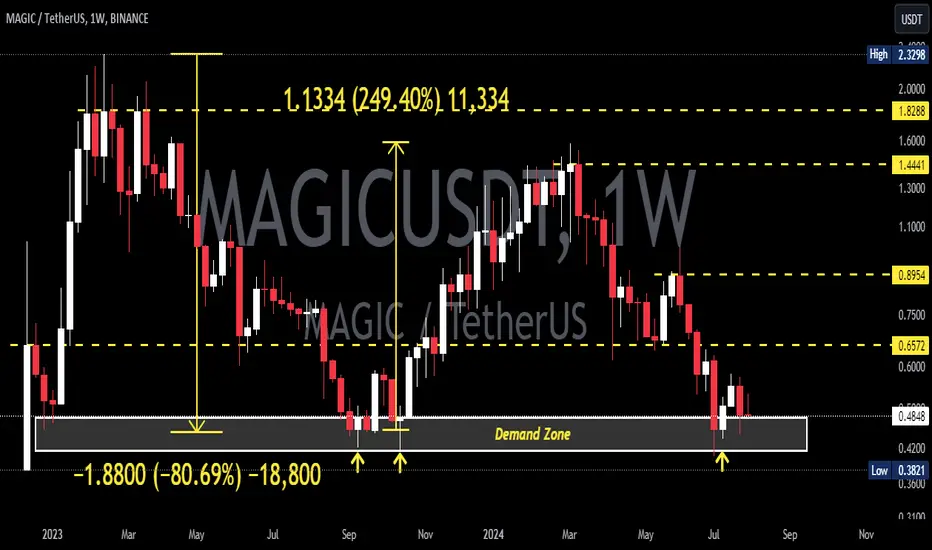
MAGICUSDT 1WMAGIC ~ 1W
#MAGIC The decline occurred already -80% from the highest peak.
It's time to start accumulating again, with a short term target of at least 20%+ from here.
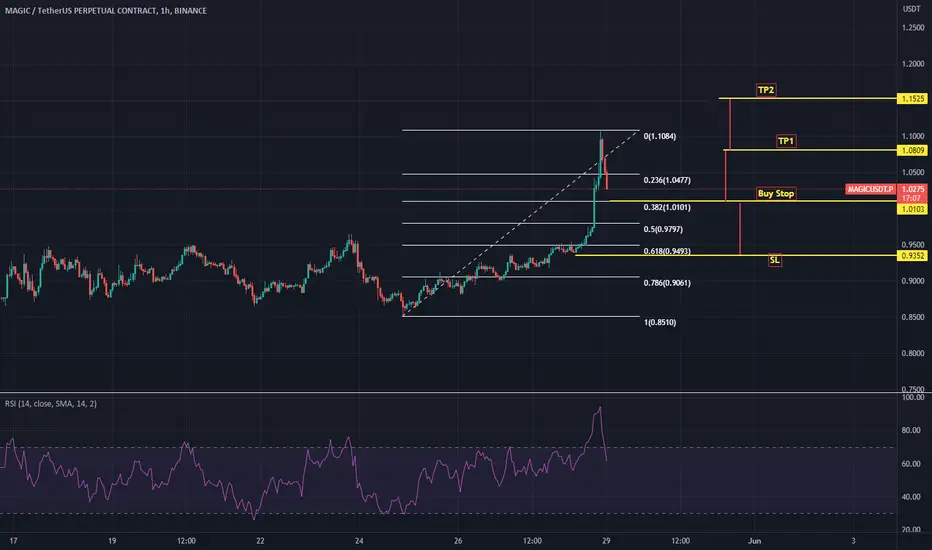
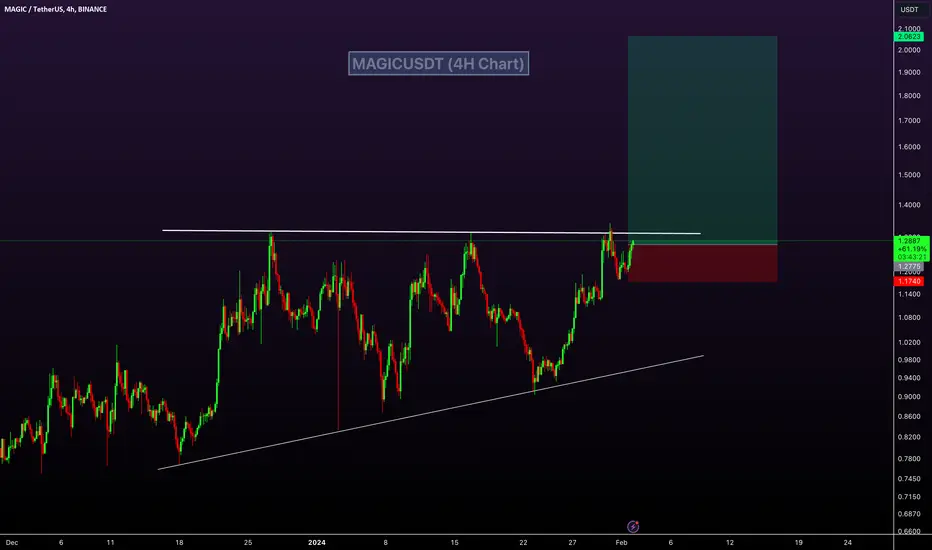
MAGICUSDT Good Buy!MAGICUSDT Technical analysis update
Buy zone : Below $1.285
MAGICUSDT price has formed an ascending triangle pattern. The price is nearing the resistance line, and a breakout could indicate potential upward movement in MAGIC.
Support : $1.175
Resistance 1: $1.38
Resistance 2: $1.60
Resistance 3: $2.00
Always keep Stop Loss
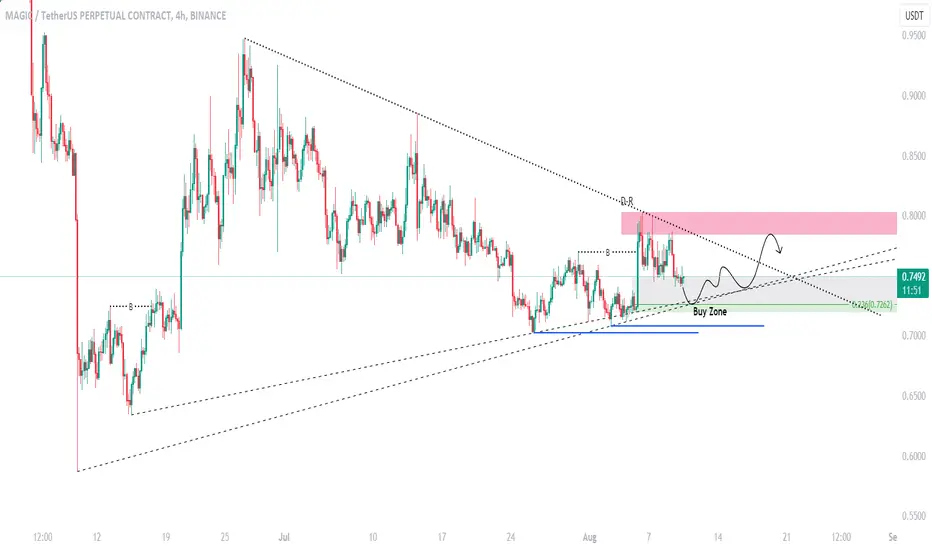
MAGIC target 0.734h time frame
-
MAGIC just broke out the downtrend line. It is creating a bottom structure and retesting the support zone around 0.55. If MAGIC is doing the potential symmetrical, we can see it reach 0.73 soon, and there are higher targets.
TP: 0.73 / 0.8 /0.9
SL: 0.525

MAGICUSDT - Double Bottom Pattern!MAGICUSDT (1D Chart) Technical analysis
MAGICUSDT (1D Chart) Currently trading at $0.594
Buy level: Above $0.595
Stop loss: Below $0.5
TP1: $0.65
TP2: $0.75
TP3: $0.88
TP4: $1
Max Leverage 3x
Always keep Stop loss
Follow Our Tradingview Account for More Technical Analysis Updates, | Like, Share and Comment Your thoughts

MAGICUSDTTime to rebuy BINANCE:MAGICUSDT
"Daily crypto market analyses I provide are personal opinions & not financial advice. Trading carries risks, so do your own research & seek advisor's help."
Don't forget to like and comment
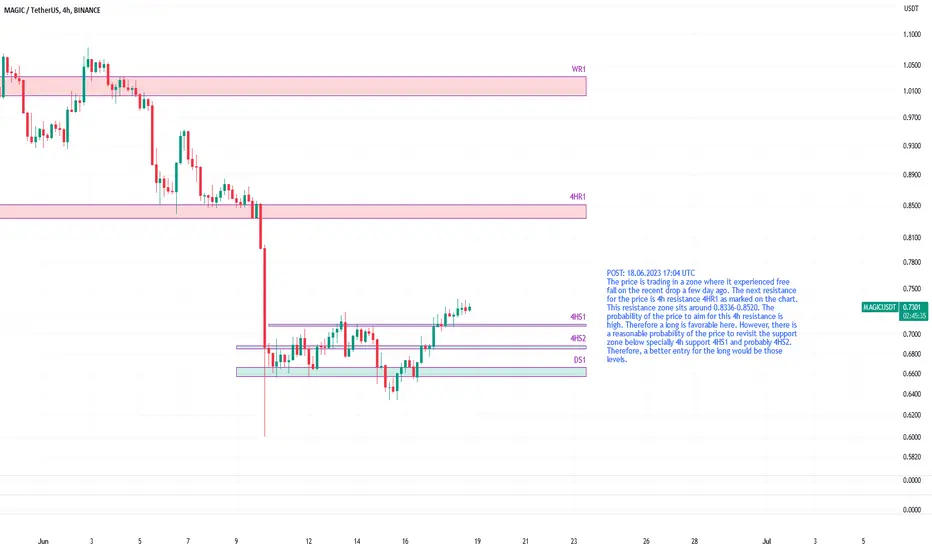
MAGICUSDT may head up for resistance around 0.8336-0.8520The price is trading in a zone where it experienced free fall on the recent drop a few day ago. The next resistance for the price is 4h resistance 4HR1 as marked on the chart. This resistance zone sits around 0.8336-0.8520. The probability of the price to aim for this 4h resistance is high. Therefore a long is favorable here. However, there is a reasonable probability of the price to revisit the support zone below specially 4h support 4HS1 and probably 4HS2. Therefore, a better entry for the long would be those levels.
MAGICUSDT.P Bullish 1H TFThis script shows high probability of bullishness at 1H TF. No divergence found.