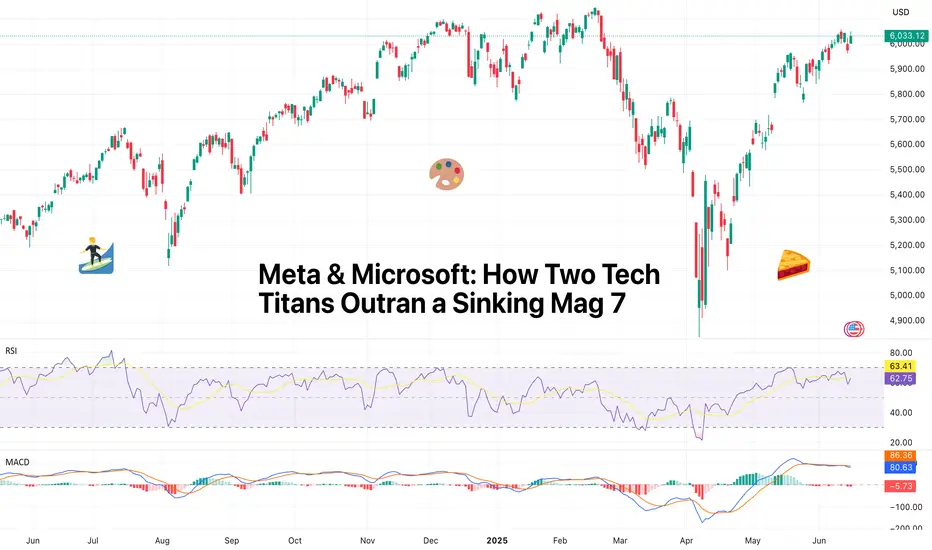
Meta & Microsoft: How Two Tech Titans Outran a Sinking Mag 7Forget about the Magnificent Seven and say hello to M&M — the only two winners of the year so far.
If you blinked during the first half of 2025, you might’ve missed it: the mighty Magnificent Seven are starting to look more like a Scraggly Five. While Tesla NASDAQ:TSLA fumbled its autonomy narrative and Apple NASDAQ:AAPL spent more time designing slides for the WWDC than in keynotes, two names quietly did the thing — created shareholder value.
Meta NASDAQ:META and Microsoft NASDAQ:MSFT
Both are up more than 13% year-to-date each, sitting comfortably at the top of the gains leaderboard. For comparison: Nvidia managed just 3% (and that’s with all the AI hype), and everyone else? Down. Flat. Or just ghosted by Wall Street. The iPhone maker? How’s 20% to the downside?
Let’s break down how Meta and Microsoft dodged the selloff.
📞 Meta: Not About That Meta
Meta NASDAQ:META came into 2025 like it had something to prove. Zuck had long gone full avatar with the metaverse. But now? Now he wants to win AI — and he’s putting his money where his data is. Meta’s latest foray into AI is a $14.3 billion investment into Scale AI.
A 49% non-voting stake in the AI darling isn’t for fun — but for function. It’s a full-court press to close the Llama-size gap between Meta’s in-house models and the heavyweights like OpenAI and Anthropic.
Scale AI, already one of Meta’s biggest vendors, processes and labels the data that fuels Meta’s large language models. It was only a matter of time before Zuck decided, “Hey, let’s just own a piece of the pipeline.”
And in true tech soap opera fashion, Scale CEO Alexandr Wang last week confirmed in an internal memo he’s leaving to join Meta full-time. For those keeping score: Wang, born in 1997, became the youngest billionaire in 2021. Now, he’s headed into the belly of the Menlo Park beast.
Wall Street seems to dig that. The stock shot up when the news leaked , as investors rewarded Meta for looking less like a social media giant and more like a serious AI player — even if it still serves your aunt’s minion memes.
👾 Microsoft: The OS of Enterprise Still Runs Smooth
Meanwhile in Redmond, Satya Nadella was out here quietly running the table.
Microsoft NASDAQ:MSFT hit an all-time high of $480 on June 12, pushing its market cap to a record-breaking $3.5 trillion. For about a day or two before that, Nvidia NASDAQ:NVDA was on top — and then Microsoft did what Microsoft always does: calmly pressed Ctrl+Alt+Delete on its competition and reclaimed its spot as Earth’s most valuable company .
How did that happen? Certainly not overnight.
Azure continues to gobble cloud market share, Microsoft 365 is still the gold standard for digital productivity, and Teams — love it or hate it — is now basically corporate law.
But don’t sleep on its AI game. Microsoft isn’t just throwing money at OpenAI, it’s embedding AI into everything it touches. Outlook, Excel, Word — all getting their Copilot upgrades. Want to finish that quarterly report faster? Let AI do it. Want it rewritten in pirate-speak? AI’s got you.
Microsoft isn’t just building tools. It’s establishing an infrastructure for the new AI economy. And traders see that. They understand that while Nvidia sells the shovels, Microsoft owns the mine.
👩🏻💻 Why the Rest of the Mag 7 Didn’t Make the Cut
Quick vibe check:
Apple NASDAQ:AAPL Still chasing the AI breakthrough. No one talks about the Vision Pro headset anymore, and the annual WWDC event wasn’t anything special. The stock is down 20% on the year.
Tesla NASDAQ:TSLA Robotaxis are coming ( maybe even this week ). But earnings pressure and margin squeeze made investors wish for more than tweets and timelines. The shares are underwater by 14% YTD.
Amazon NASDAQ:AMZN E-commerce growth hit cruise control, and its AI presence still feels more like an R&D lab than a monetized machine. The stock is staring at a 3.7% loss, largely thanks to Amazon getting slapped in the face from Trump’s tariffs .
Alphabet NASDAQ:GOOGL Search is still dominant, but Gemini’s bumpy launch and questionable performance has traders waiting for Google to actually ship something great, and not just strip the results from the iconic blue links . The stock is down 8%.
Nvidia NASDAQ:NVDA Yes, still the king of chips. And yes, it’s still delivering. But with valuation stretched like Lululemons in a CrossFit class and export bans weighing heavy , it’s getting harder to maintain the pace.
🍻 Trading Lesson: Leadership Rotates
If you’re a trader who’s been glued to Nvidia’s every tick or still buying dips on Apple because it “has to come back,” let this be your mid-year reminder: the market doesn’t care what used to lead.
Leadership rotates. Fundamentals shift. And sometimes, the best trade is the one hiding behind less hype and more function.
Case in point: While Apple’s been trying to find a catalyst, Meta just found a whole new business partner. While Nvidia’s been spinning plates on export rules, Microsoft’s just printing money off the back of Office subscriptions and Azure servers.
👀 What Happens Next?
With the second half of the year approaching, all eyes are on:
Meta’s AI ambitions — can the Scale deal accelerate model performance fast enough to close the gap with rivals?
Microsoft’s cloud dominance — can Azure continue its double-digit growth without hitting the regulatory radar?
Earnings, earnings, earnings — it’s almost the season again! Earnings reports kick off in about a month and things will get cracking.
Whatever happens, don’t bet the farm on what used to work. Watch the rotation. Track the strategy shifts. And for the love of charts — keep one eye on the Earnings Calendar .
💬 Final Thought
If Meta and Microsoft can shine while their peers flounder, what does that say about the real winners in this new AI economy? Maybe it’s not about who builds the flashiest model — but who actually knows how to monetize it. What’s your thought?
Magnificentseven
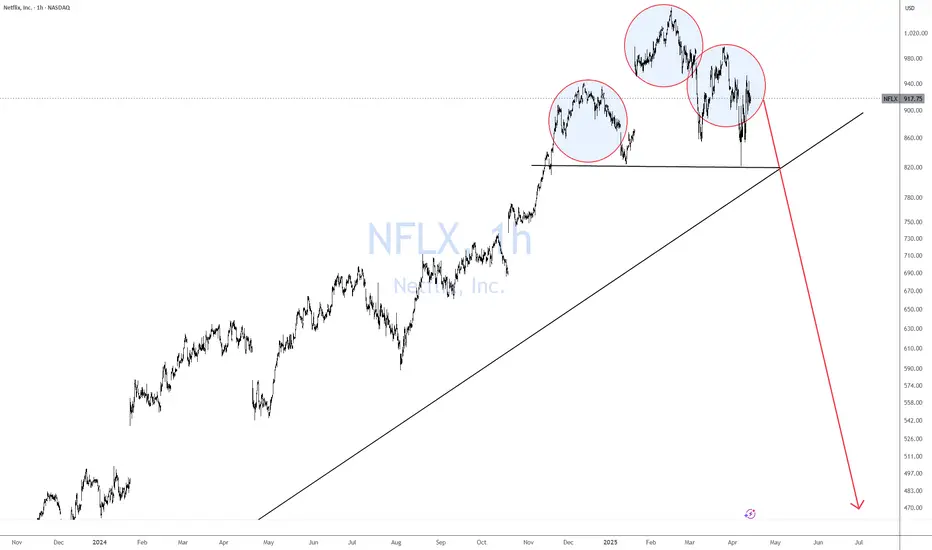
NFLX Bearish Setup!This is a simple setup that almost anyone can read—a Head & Shoulders at the top signaling a reversal pattern.
Contrary to popular belief H&S are continuation patterns if they are not at a top.
The only other time H&S are reversal patterns is if the chart has multiple H&S everywhere.
Time for bulls to take their money and RUN!!! The fun ride is over for a while. Time to go home. ((
CAUTION!
Click BOOST, follow subscribe. Let me help you navigate these crazy markets. ))
META Screaming CAUTION!The hardest thing is to call a short in a recession-proof stock, especially in the tech space. However, only so many dollars are available in the advertisement space, and it can't go up forever. Make this excuse at any price.
As such, I rely on the chart screaming CAUTION!
Again like most of my trade setups, this is a simple trade.
Bulls should take their profits and smile.
Bears short as high as possible with the internet to short more should it form a double top.
The chart has spoken. Like it or not.
Remember I am a macro trader so don't expect tomorrow to play out. My trades take time but have much bigger moves. ;)

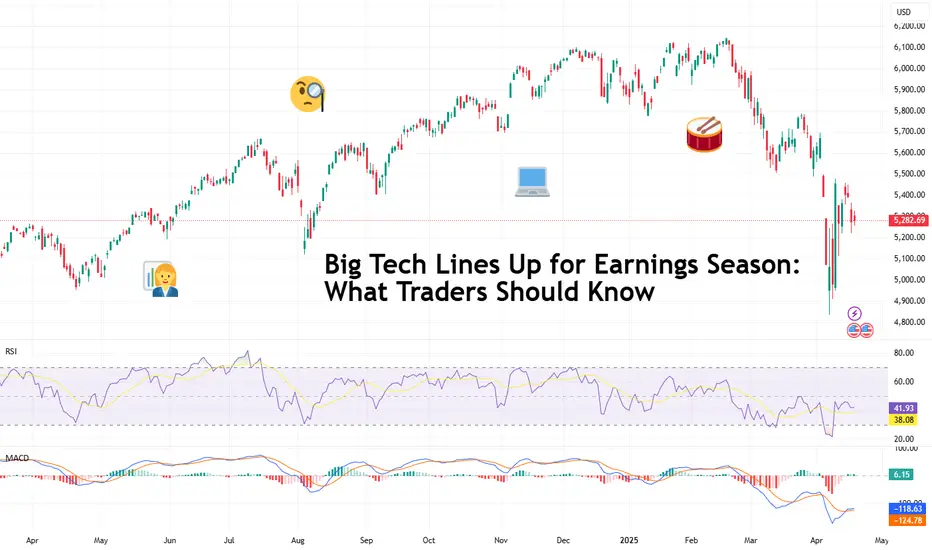
Big Tech Lines Up for Earnings Season: What Traders Should KnowPeak earnings season is right around the corner — the next two weeks are for the geeks with tech giants slated to report their quarterly financials all the while traders and investors weigh concerns over tariffs, trade wars, and export controls.
On tap to offload first-quarter earnings updates this week are Tesla NASDAQ:TSLA (Tuesday) and Google parent Alphabet NASDAQ:GOOGL (Thursday).
We’ll get more of the tech elite next week — Meta NASDAQ:META and Microsoft NASDAQ:MSFT deliver next Wednesday and Amazon NASDAQ:AMZN and Apple NASDAQ:AAPL report Thursday. Nvidia NASDAQ:NVDA reports late in May.
Let’s talk about that.
Welcome to earnings season, aka that rush hour of the quarter when traders hit refresh on the earnings calendar , their watchlists, and cortisol levels.
Once again, it's Big Tech in the spotlight — specifically the Magnificent Seven club, a pack of tech heavy hitters who spent the past year building the future of artificial intelligence only to be the first out the door this year when investors dumped risk in the face of looming global uncertainty.
Now, with Tesla and Alphabet kicking off what could be a market-moving series of updates, the real question isn’t just who beat the numbers — but who can still tell a good story in the face of tariffs, competition, and AI-fueled capex that’s starting to look like Monopoly money.
👜 The Setup: Seven Stocks, Seven Bags to Hold
The Magnificent Seven — Tesla, Apple, Amazon, Microsoft, Meta, Alphabet, and Nvidia — aren’t just the tech elite. They’ve been the main engine of the market for the last few years. But in 2025, the wheels have come off.
These technology mainstays, towering over the growth sector, have shed hundreds of billions and are now nursing double-digit percentage losses. Each. One. Of. Them. The growth space, valued more on prospects of bright performance rather than current showing, has been hit hard this year. How hard? That hard:
Tesla NASDAQ:TSLA is down 36%
Nvidia NASDAQ:NVDA is down 27%
Amazon NASDAQ:AMZN is down 21%
Alphabet NASDAQ:GOOGL is down 20%
Apple NASDAQ:AAPL is down 19%
Meta NASDAQ:META is down 16%
Microsoft NASDAQ:MSFT is down 12%
On the outside, we all know what’s dragging stocks — it’s the widespread tariff jitters fanning recession fears and triggering waves of capital outflows. But on the inside, these tech giants are deep into a spending spree, and paring back that guidance might be too late.
AI spending is now at fever pitch, having gone from “impressive” to “uh… should we be concerned?” And that’s what investors will be watching when these masters of technology report quarterly numbers.
Besides the usual revenue figures, earnings per share and (likely timid) guidance, capital expenditures will draw a ton of attention. Capital expenditures, or capex, is the amount of money a company allocates for investments in new stuff like hardware and software and that may include beefing up existing infrastructure.
Injecting AI into systems and operations is top focus right now and Big Tech has decided to be generous and pony up some big money for it. Here’s what this year’s capex looks like, as per prior guidance:
Microsoft has allocated $80 billion
Alphabet has set aside $75 billion
Amazon? $100 billion ready to roll
Zuck’s Meta is in with up to $65 billion
The rest of the Mag 7 haven’t put out official capex projections but no one is sleeping on the opportunity.
Let’s go around the room and see what each of these is dealing with right now.
🚗 Tesla: A Look Under the Hood
Tesla reports first, and traders are bracing for either redemption — or another reason to panic sell.
On the surface, it’s not pretty: EV demand is sagging, especially in China and Europe. Musk’s political disruption and proximity to Trump aren’t helping the optics. And with shares already down 36% this year, the company enters this earnings call with bruises and baggage.
Revenue is expected to come in at $21.2 billion, down 1%, while earnings are projected to drop 8% to $0.42. Tesla delivered 336,681 cars in Q4 , a 14% drop from the same time a year ago.
🌎 Alphabet: Quiet Strength, But Still on Watch
Alphabet is expected to deliver solid results — $89.2 billion in revenue, up 11%, and $2.01 in earnings per share, up 6.3% from last year. Among the Mag 7, it’s one of the best-positioned players to weather trade volatility, thanks to its size, diverse revenue streams, and sheer dominance in advertising and cloud computing.
Its Gemini AI model is heating up the race against ChatGPT and Copilot, and its cloud division is quietly chipping away at AWS and Azure’s lead.
That said, traders will still be watching for any signs of slowdown in digital ad spending—a canary in the coal mine if the economy starts to sputter under tariffs and tightening global conditions.
💻 Amazon and Apple: The Slow Burners
Amazon, with its big-ticket spending on AI, is playing the long game — mostly through AWS, the company’s main driver of profitability. It's aggressive, even by Big Tech standards. The problem? AWS margins are under pressure, and retail is facing the squeeze from cautious consumers.
Amazon needs to prove it can turn AI into revenue, not just headlines. Amazon’s sales and earnings per share are projected to grow 8.16% and 38.7% respectively.
Apple, meanwhile, is in the risky position of relying a bit too much on China for its products — it ships about 90% of its iPhone from Asia’s biggest economy.
And while that may be irrelevant for first-quarter results, it may weigh on the company’s outlook, considering Trump’s flip-flopping on Chinese tariffs (is tech in or is tech out?) .
The iPhone maker is expected to report $93.9 billion in revenue and $1.61 in earnings per share.
🔍 Meta and Microsoft: AI Darlings With Something to Prove
Meta reports next Wednesday, and the pressure’s on. Zuck has gone full steam into AI, pushing for everything from AI chatbots in WhatsApp to personalized content generation across Facebook and Instagram.
But here’s the kicker: Meta still makes its money from ads. And if ad budgets start shrinking in response to tariffs or a slower economy, AI investments may not save the day — at least not right away.
Meta is expected to pull in $41.3 billion in revenue and $5.24 in earnings per share.
Microsoft, on the other hand, has positioned itself as the white-collar AI whisperer. Copilot is everywhere — Office, Teams, Edge, Windows — and its $80 billion in AI infrastructure spending is squarely aimed at enterprise dominance.
It still holds a 49% stake in OpenAI, and Azure is growing, albeit slower than expected. If Microsoft can show AI adoption translating into real revenue, traders may get the breakout they’ve been waiting for.
Microsoft is expected to pick up revenue of $68.5 billion and $3.23 in earnings per share.
🤖 Nvidia: The Final Boss
Nvidia won’t report until late May, but it’s already looming over the entire earnings season. Every other tech company is spending billions on Nvidia’s chips — so when the chipmaker finally updates investors, it could swing sentiment across the entire sector.
The market wants to see that demand is real and growing, especially from hyperscalers like Microsoft, Amazon, and Google. If Nvidia disappoints, the fallout might be like watching a domino go down.
Nvidia is expected to bring home $43.1 billion in revenue and $0.90 in earnings per share.
⚙️ Final Thoughts: Big Bets, Big Risks
This isn’t just another earnings season — it’s a stress test for the Magnificent Seven amid times of big market shifts. The group that once carried the market now faces a reality check: AI is expensive, global trade is messy, and Wall Street is no longer giving out free passes for “vision.”
But where there’s risk, there’s also opportunity. Traders who can sift through the noise, spot the change in tone, and ride the next narrative — whether it’s autonomous Teslas, AI-powered spreadsheets, or ad-supported Metaverse avatars — will have the edge.
What’s your take? Which Big Tech name are you watching most closely — and are you betting on a rebound or bracing for more pain? Let’s hear it from you.
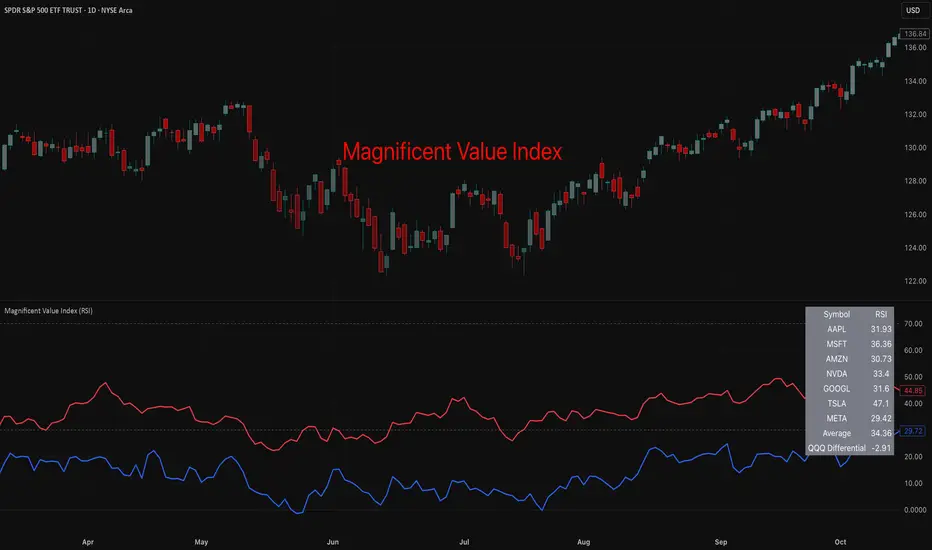
Magnificent Value Index with Opacity CandlesThis script idea is rather old but very enlightening about the current state of the market.
It looks at the RSI or MFI values of all Mag 7 stocks, averages them out and compares it to qqq's rsi or mfi as a differential.
Real shame tradingview doesn't allow free users to participate in publishing indicators and it's a real shame the war their employees support is being lost.
Make whatever conclusions you will from this.
Good luck, we're all living in a global idiocratic world now ruled by people infected with Affluenza .
$MAGS: Magnificent Seven ETF – Tech Titan or Overhyped?(1/9)
Good afternoon, everyone! ☀️ CBOE:MAGS : Magnificent Seven ETF – Tech Titan or Overhyped?
With MAGS at $46.85, is this ETF a powerhouse of tech giants or just another bubble waiting to burst? Let’s decode the code! 🔍
(2/9) – PRICE PERFORMANCE 📊
• Current Price: $ 46.85 as of Mar 18, 2025 💰
• Recent Move: Likely up, reflecting tech sector strength, per data 📏
• Sector Trend: Tech stocks soaring with AI and cloud hype 🌟
It’s a tech fest—let’s see if it’s worth the buzz! ⚙️
(3/9) – MARKET POSITION 📈
• Market Cap: Approx $1.87B (assuming 40M shares) 🏆
• Operations: Tracks Apple, Microsoft, Amazon, Alphabet, Meta, Tesla, Nvidia ⏰
• Trend: Dominant players in tech, driving innovation and market trends 🎯
Firm in the heart of Silicon Valley! 🚀
(4/9) – KEY DEVELOPMENTS 🔑
• Tech Rally: Magnificent Seven companies hit new highs, per data 🌍
• Earnings Season: Strong Q4 results from underlying firms, per posts on X 📋
• Market Reaction: MAGS up, reflecting sector momentum 💡
Navigating through tech’s highs and lows! 🛢️
(5/9) – RISKS IN FOCUS ⚡
• Regulatory Scrutiny: Antitrust concerns for big tech players 🔍
• Market Volatility: Tech stocks prone to swings due to innovation and competition 📉
• Economic Factors: Interest rates and global economic conditions impact growth ❄️
It’s a risky ride—buckle up! 🛑
(6/9) – SWOT: STRENGTHS 💪
• Industry Leaders: The Magnificent Seven are pioneers in their fields 🥇
• Growth Potential: AI, cloud computing, and other tech trends fuel expansion 📊
• Dividend Payouts: Some companies offer dividends, adding income potential 🔧
Got the best of both worlds! 🏦
(7/9) – SWOT: WEAKNESSES & OPPORTUNITIES ⚖️
• Weaknesses: High valuations, potential for overinvestment 📉
• Opportunities: Emerging technologies like quantum computing, biotech integration, per strategy 📈
Can they stay ahead of the curve? 🤔
(8/9) – POLL TIME! 📢
MAGS at $46.85—your take? 🗳️
• Bullish: $50+ soon, tech’s unstoppable 🐂
• Neutral: Steady, risks balance gains ⚖️
• Bearish: $40 looms, overhyped and due for correction 🐻
Chime in below! 👇
(9/9) – FINAL TAKEAWAY 🎯
MAGS’s $46.85 price reflects the dynamism of the tech sector 📈, but with risks from valuations and regulatory pressures 🌿. DCA-on-dips could be a strategy to manage volatility. Gem or bust?

Calm before the storm?The first ten days of the year for the S&P 500 index were surprisingly calm and without the interest it had in other years, finding it making a sideways downward movement towards the double "cushion" of support that is presented on the weekly price chart between 5,850 and 5,740 units. An important anti-shock zone that has the ability to absorb any liquidations that come out without spoiling the indication of the medium-term upward trend.
The negative element is that with the sideways stabilizing movement that the index has been making since the beginning of last November between 6,100 and 5,850 points, it has brought closer to the very heavy 200-day moving average, which has now climbed to 5,657 points or -4% from current price levels.
The week that will begin is therefore important as the index will have to show us its cards with what it intends to do. Thus, a possible passage of the index below 5,800 points will raise the attention of sellers since it will give them the right to push it further towards 5,740 and 5,700 points. On the other hand, a dynamic push above 5,800 points may bring 6,000 points back into the spotlight.
Analysts may now be giving higher target prices for the S&P 500 for 2025, but at the same time they are expressing some skepticism about the ability of the "Magnificent 7" to pull the chariot on the uphill road to 7,000 points.
Characteristic are the "pulled" figures that give both the P/E ratio and the P/S ratio for these seven giants in relation to the average of the S&P 500. So while the index has a P/E of 28 and a P/S of 3, Tesla has a P/E of 111 (!) and a P/S of 15, Nvidia P/E:53 and P/S:29, Amazon P/E:47 and P/S:3.8, Apple P/E:41 and P/S:10, Microsoft P/E:35 and P/S:12, Meta P/E:28 and P/S:9.8 and finally Google appears with P/E:25 and P/S:7.1.
Indeed, the indicators show an "overflow" in the capitalization of the "Magnificent 7", but the financial data that will begin to come out from the first quarter of 2025 may open the way for higher numbers in their share values.

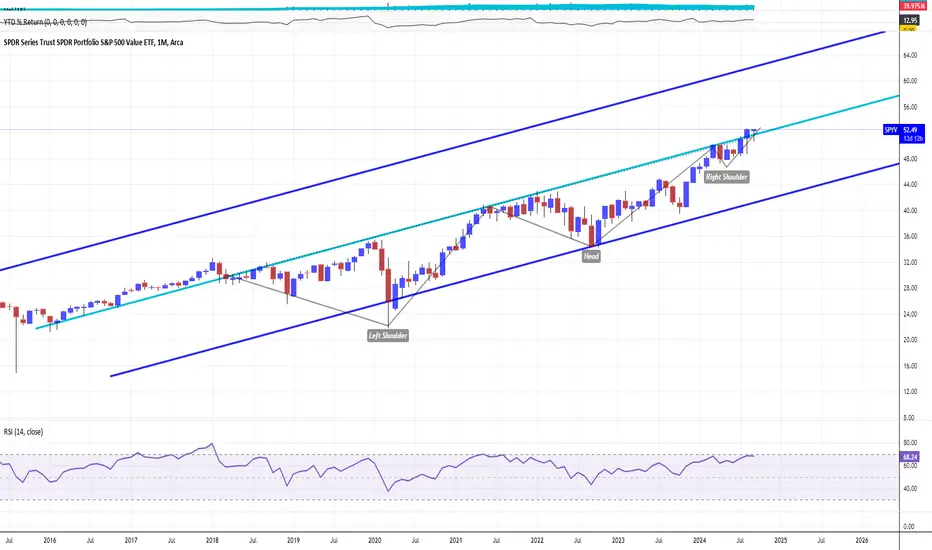
Value stocks shine bright, amid Growth stocks depressionValue investing is an investment strategy that involves picking stocks that appear to be trading for less than their intrinsic or book value. Value investors actively ferret out stocks they think the stock market is underestimating. They believe the market overreacts to good and bad news, resulting in stock price movements that do not correspond to a company's long-term fundamentals. The overreaction offers an opportunity to profit by purchasing stocks at discounted prices.
Warren Buffett is probably the best-known value investor today, but there are many others, including Benjamin Graham (Buffett's professor and mentor), David Dodd, Charlie Munger (Buffet's business partner), Christopher Browne (another Graham student), and billionaire hedge-fund manager, Seth Klarman.
The main represented technical graph is for SPDR S&P 500 Value ETF (SPYV) that invests in the committee-selected S&P 500 with focus on value stocks. The Index selects stocks from the S&P 500 that exhibit these fundamental value characteristics: (i) book value to price ratio, (ii) earnings to price ratio, and (iii) sales to price ratio. To be included in the index common stocks and REITs must meet certain liquidity criteria and must have a positive as-reported earnings over the most recent four consecutive quarters (measured using the sum of earnings over those quarters) and for the most recent quarter.
Top 10 AMEX:SPYV components, incl. weight.
1) Berkshire Hathaway Inc. Class B NYSE:BRK.B 3.97%
2) JPMorgan Chase & Co. NYSE:JPM 2.88%
3) Exxon Mobil Corporation NYSE:XOM 2.43%
4) Johnson & Johnson NYSE:JNJ 1.93%
5) Walmart Inc. NYSE:WMT 1.65%
6) UnitedHealth Group Incorporated NYSE:UNH 1.63%
7) Bank of America Corp NYSE:BAC 1.28%
8) Procter & Gamble Company NYSE:PG 1.21%
9) Chevron Corporation NYSE:CVX 1.16%
10) Costco Wholesale Corporation NASDAQ:COST 1.14%
The basic concept behind everyday value investing is straightforward: If you know the true value of something, you can save a lot of money when you buy it. Most folks would agree that whether you buy a new TV on sale, or at full price, you’re getting the same TV with the same screen size and picture quality.
Stock prices work in a similar manner, meaning a company’s share price can change even when the company’s valuation has remained the same. This means, strictly speaking, there is no such thing as a true, or intrinsic, value of the stock of a given company. But there are relative values.
Value investing developed from a concept by Columbia Business School professors Benjamin Graham and David Dodd in 1934 and was popularized in Graham's 1949 book, "The Intelligent Investor."
Just like savvy shoppers would argue that it makes no sense to pay full price for a TV since TVs go on sale several times a year, savvy value investors believe stocks work the same way. Of course, unlike TVs, stocks won't go on sale at predictable times of the year such as Black Friday, and their sale prices won’t be advertised.
Value investing is the process of doing detective work to find these secret sales on stocks and buying them at a discount compared to how the market values them. In return for buying and holding these value stocks for the long term, investors can be rewarded handsomely.
Intrinsic Value and Value Investing
In the stock market, the equivalent of a stock being cheap or discounted is when its shares are undervalued. Value investors hope to profit from shares they perceive to be deeply discounted.
Investors use various metrics to attempt to find the valuation or intrinsic value of a stock. Intrinsic value is a combination of using financial analysis, such as studying a company's financial performance, revenue, earnings, cash flow, profit, and fundamental factors. It includes the company's brand, business model, target market, and competitive advantage.
Some metrics used to value a company's stock include:
Price-to-book ( P/B ), which measures the value of a company's assets and compares them to the stock price. If the price is lower than the value of the assets, the stock is undervalued, assuming the company is not in financial hardship.
Price-to-earnings ( P/E ), which shows the company's track record for earnings to determine if the stock price is not reflecting all of the earnings or is undervalued.
Free cash flow , which is the cash generated from a company's revenue or operations after the costs of expenditures have been subtracted.
Free cash flow is the cash remaining after expenses have been paid, including operating expenses and large purchases called capital expenditures, which is the purchase of assets like equipment or upgrading a manufacturing plant. If a company is generating free cash flow, it'll have money left over to invest in the future of the business, pay off debt, pay dividends or rewards to shareholders, and issue share buybacks.
Of course, there are many other metrics used in the analysis, including analyzing debt, equity, sales, and revenue growth. After reviewing these metrics, the value investor can decide to purchase shares if the comparative value—the stock's current price vis-a-vis its company's intrinsic worth—is attractive enough.
Fundamental thoughts
Were you ready or not, but still US interest rate is at the highest degree over the past decades (basically due geopolitics tensions), while high borrowing cost is inappropriate to internal US macroeconomic conditions (weakening labor market, weakening housing sales etc).
This is why growth stock will not pump forever, meaning that no one is at the top over so-called "Mag Seven" hyped stories.
At the same time, the main technical graph is for SPDR S&P 500 Value ETF (SPYV) indicates on Reversed Head-and-Shoulders technical structure in development, as further gain I am sure has to come.
Daily chart of the 7 MagnificentsHello,
Daily chart of the Magnificent 7 chart.
Are we heading towards a double top?
The 200-period simple moving average in orange is bullish.
On the chart, the 3 accumulation zones are indicated.
Elections are coming soon, things can change.
Make your own opinion before placing an order.
► Thank you for boosting, commenting, subscribing!
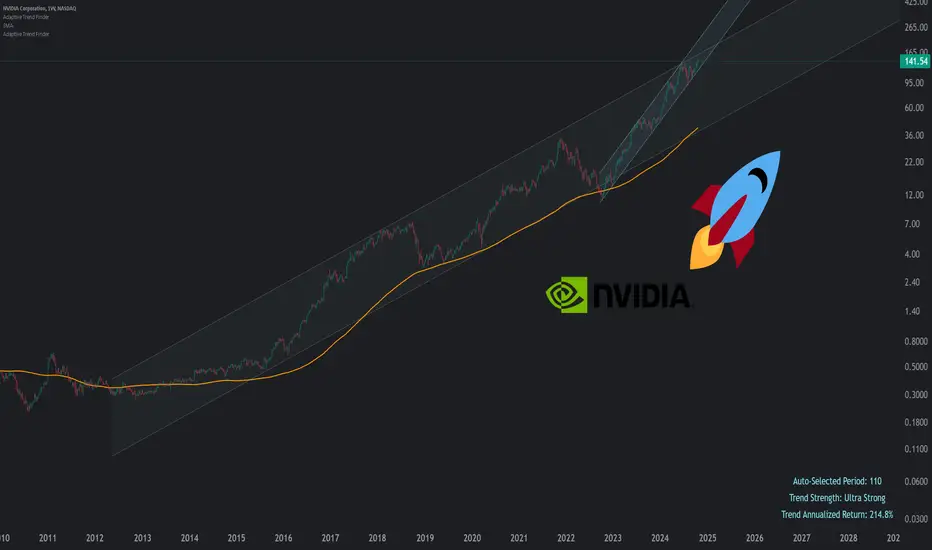
NVIDIA weekly and logHello,
A quick look at the past.
Well, it's been going up since 2012!
A short-term trend has resumed in the long-term trend as shown by the regression line channels.
The orange line represents the 200-period simple average.
Make your own opinion, before placing an order.
► Thank you for boosting, commenting, subscribing!
S&P 500 Is Higher Than Ever. Can Earnings Support the Growth?Tech giants are in the waiting room, prepping their financial updates while investors drool over prospects of AI-fueled revenues. The season kicked off with Wall Street banks posting some convincing numbers for the September quarter, painting an optimistic outlook for Corporate America’s biggest and brightest players.
The S&P 500 is hot, hot, hot. Investors just can’t get enough of the 500-strong index and last Friday they pushed it to its 47th record closing high of the year. And they did it with finesse — on the eve of the 37th anniversary of the “Black Monday” market crash. (On Oct. 19, 1987, the S&P 500 wiped out a record 20% and the Nasdaq shed 12%.) Broadly, US indexes are having a bumper year, with most of them up double digits or more.
With no time to waste, markets are shifting their attention to the looming slate of big tech earnings reports . Here’s what’s going to be turning heads this week:
📌 On Wednesday , EV maker Tesla TSLA will be the main character in the world of corporate updates. Wall Street is eyeballing earnings north of $25.4 billion, up from $23.4 billion in the year-ago quarter. Besides Elon Musk’s EV giant, Wednesday will bring earnings from Coca Cola KO , Boeing BA , IBM IBM and telecoms mainstays T-Mobile TMUS and AT&T T .
📌 On Thursday , the earnings roll keeps rolling in with e-commerce and cloud computing juggernaut Amazon AMZN reporting after the closing bell.
But all that earnings action looks fairly light — wait till you see what’s cooking for next week. *drumroll please* … 🥁
The Magnificent Seven club of tech highflyers will be represented by four of its members. (Tesla and Amazon report the prior week and Nvidia NVDA reports in about a month from now.)
📌 On October 29 , Google parent Alphabet GOOGL is scheduled to report earnings figures. Shares of the tech heavyweight are up about 18% on the year but got stuck recently after the Department of Justice filed a range of possible changes aimed at reducing Google’s search dominance.
📌 On October 30 , Facebook parent Meta META and Microsoft MSFT will reveal how they fared in the three months through September. Mark Zuckerberg’s Meta flaunts a massive 65% year-to-date increase (and some new glow-up for its loose-shirt-wearing tech bro founder.) Microsoft, on the other hand, is up by a more modest clip of 12%.
📌 On October 31 , Apple AAPL will release its highly-anticipated earnings data that will include a glimpse into how well the new iPhone 16 is selling . Shares of Apple are up roughly 27% for the year.
These seven mega-cap corporate giants are expected to show an 18% rise in third-quarter profits, according to Bloomberg Intelligence. If materialized, that would be substantially slower than the 36% seen in the second quarter. The sheer size of the pack accounts for about 30% of the total market cap of the S&P 500 (which not long ago celebrated its $50 trillion milestone .) Nvidia and Apple alone are worth more than $7 trillion combined.
What’s on your radar for this earnings season? Are you waiting for a tech giant to dip or maybe you're after a bank stock or a car conglomerate? Share your comments below!

Microsoft Corp Hello,
A quick look with the Adaptive Trend Finder indicator on the Microsoft stock, with a daily chart.
I have set the medium-term and short-term settings.
We can see that the price is working at the bottom of the channel, so watch it.
The medium-term trend is bullish.
Make your own opinion before placing an order.
► Thank you for boosting, commenting, subscribing!

A Full Scope View of The Magnificent 7Today, we look at the Mag 7 via the following methods.
MAC (Moving Average Channel).
Valuation with Trend.
High Timeframe Divergence.
To summarize, overall, these markets are generally bullish. I outline areas of interest where I will be looking for trades to the long side.
Have a great weekend.

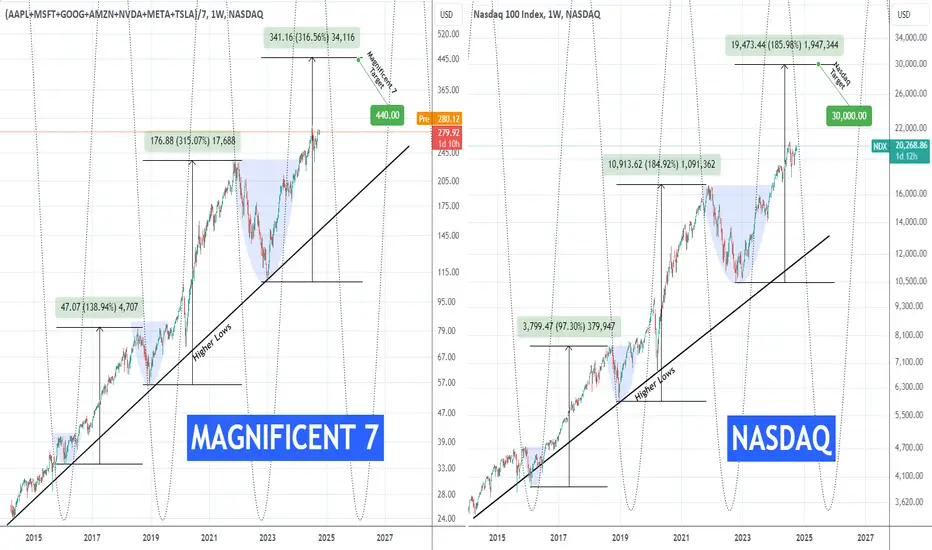
Can the MAGNIFICENT 7 outperform once more?We have seen the Magnificent 7 (Apple, Microsoft, Google, Amazon, Nvdia, Meta, Tesla) underperform historically but since the start of the year this hasn't been as strong as previously (roughly +35% for M7 against + 25% for Nasdaq). The former can be seen on the left chart while the latter on the right. This goes so far against the aggressive nature of the Magnificent 7 (M7), which have outperformed Nasdaq on all previous rallied by around +50%.
In fact the M7's first major rally (2016 - 2018) rose by +140% while NDX's by +97%. The second major rally (2019 - 2021) registered +315% for MA7 and 'just' +185% for NDX. If there is any progression between them, we can argue that the current rallies will be even stronger. Of course the sample isn't big enough for solid conclusions and multi-year rallies can't keep getting stronger on each Cycle for ever.
What is reasonable to count on however, is that as the Fed stepped in recently and gave the market the first Rate Cut in years, a new Cycle of cheap money to invest with has started and we can expect rallies of equal strength with the previous ones. For M7 (+315%) that's $440, so around +60% from the current levels, while for Nasdaq (+185%) that's 30000, so around +47% from the current levels. Not an incredible difference considering the risk that highly volatile stocks like the M7 bear. This could be a sign that the market is shifting to other stocks during this Cycle and the M7 potential may be fading.
In any event, do you think the Magnificent 7 will start to outperform Nasdaq again and if so is this worth the risk than investing your capital on the 100 companies of the index?
-------------------------------------------------------------------------------
** Please LIKE 👍, FOLLOW ✅, SHARE 🙌 and COMMENT ✍ if you enjoy this idea! Also share your ideas and charts in the comments section below! This is best way to keep it relevant, support us, keep the content here free and allow the idea to reach as many people as possible. **
-------------------------------------------------------------------------------
💸💸💸💸💸💸
👇 👇 👇 👇 👇 👇
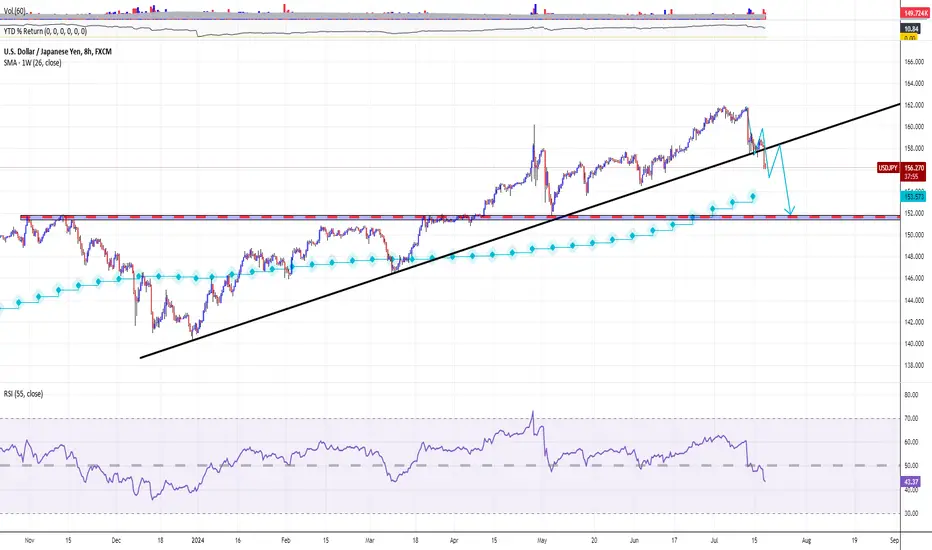
YENOCALYPSE. TO BE CONTINUE...The yen has posted several outsized moves in recent days, appreciating sharply on Thursday and Friday from 38-year lows of 161.96 per dollar, sudden rallies that market participants said had the signs of currency intervention.
Bank of Japan data released on Tuesday suggested Tokyo may have spent 2.14 trillion yen ($13.5 billion) intervening on Friday. Combined with the estimated amount spent on Thursday, Japan is suspected to have bought nearly 6 trillion yen via intervention last week.
In technical terms, USDJPY Fx pair has broken its major Bullish 7-months trend.
What is next? I think retrace is possible.. But just to deliver much more to 152nd ground.
// Mega stocks are in ruins..
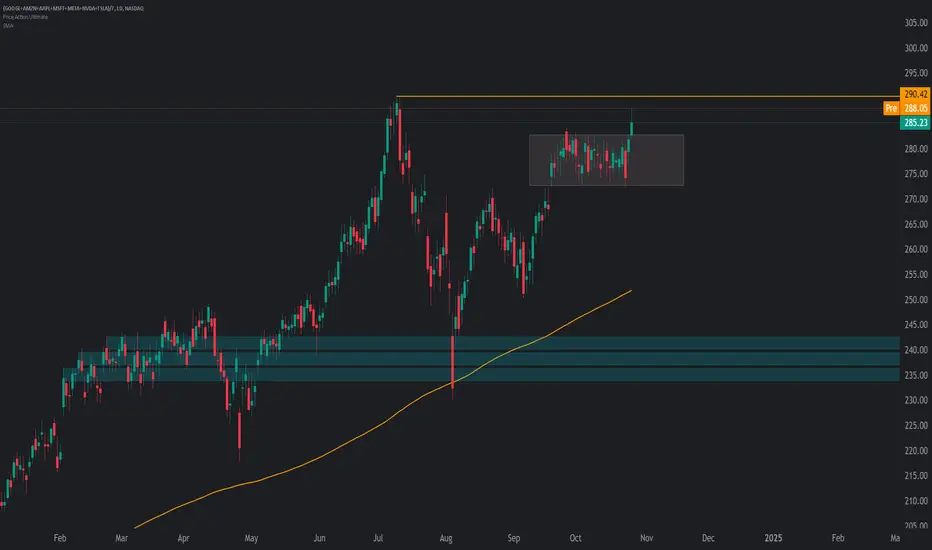
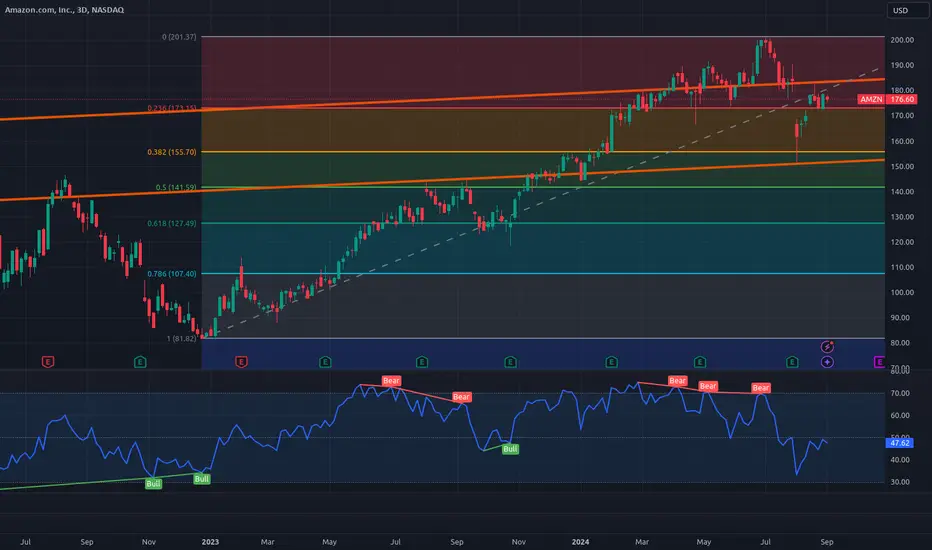
Amazon chart weaknessesThe biggest stocks in the market, from the technology sector, tops on July 2024. Now they are showing some concerning data. The weak RSI and Fibonacci retracement levels perfectly match previous support and resistance levels. There are also other concerning factors.
Amazon shows lower levels in the RSI in the latest move-up. It is now behind the pivot line from 2022 and having resistance there in the bounce from the 0.382 Fib level.
Microsoft risks shown in chartThe biggest stocks in the market, from the technology sector, tops on July 2024. Now they are showing some concerning data. The weak RSI and Fibonacci retracement levels perfectly match previous support and resistance levels. There are also other concerning factors.
Microsoft is showing a weak RSI in the latest move-ups. Maybe it needs to find liquidity in the 0.382 FIB level around 370$.

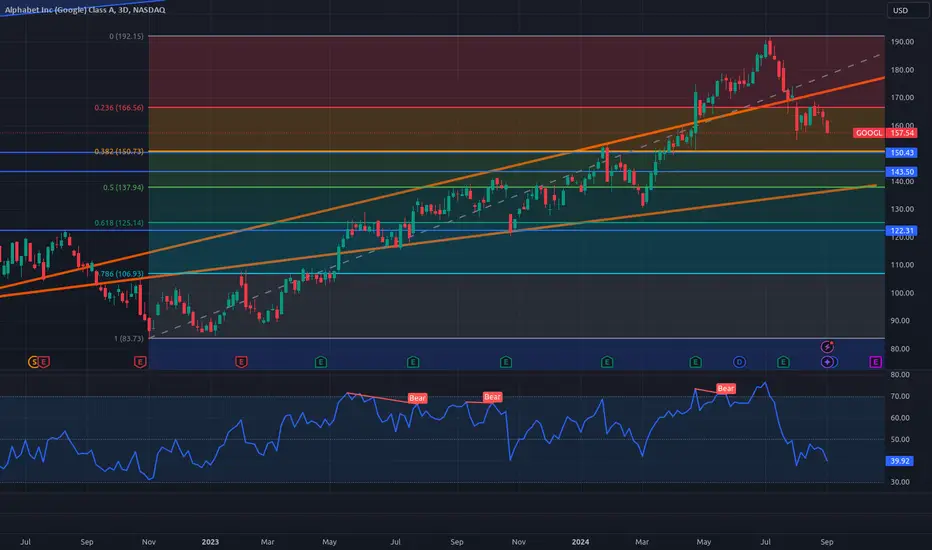
Google chart shows some weaknessGoogle is having resistance in the 0.236 FIB level and is behind the top trend line signaling a more neutral bias. Maybe it needs to find liquidity in the 0.382 FIB level around 150$.
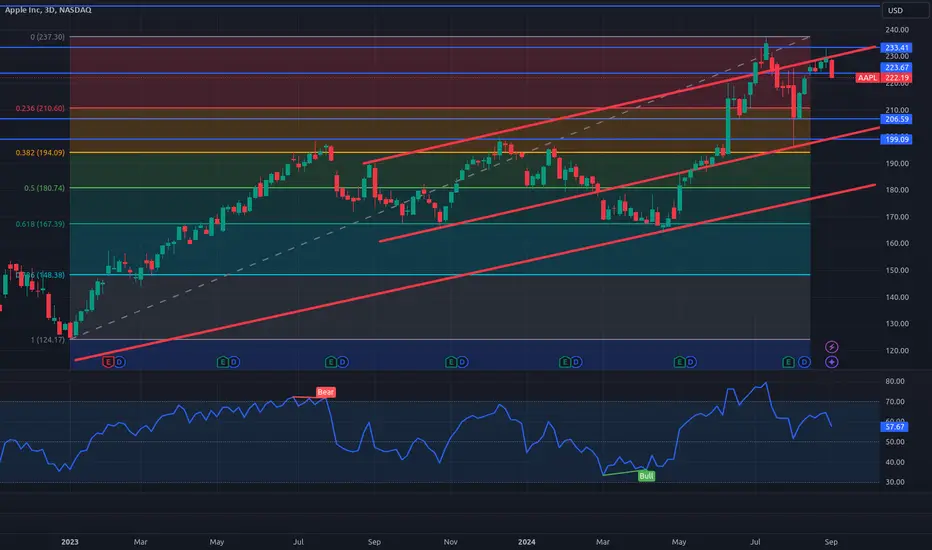
Apple chart September 2024Apple is showing a weaker RSI in the last move-up. The new iphone release and AI features makes investors expect a boost on sales, but maybe it will not happen at all. A drop between 10 and 20% could happen.
Same concerns for magnificent7 stocks.
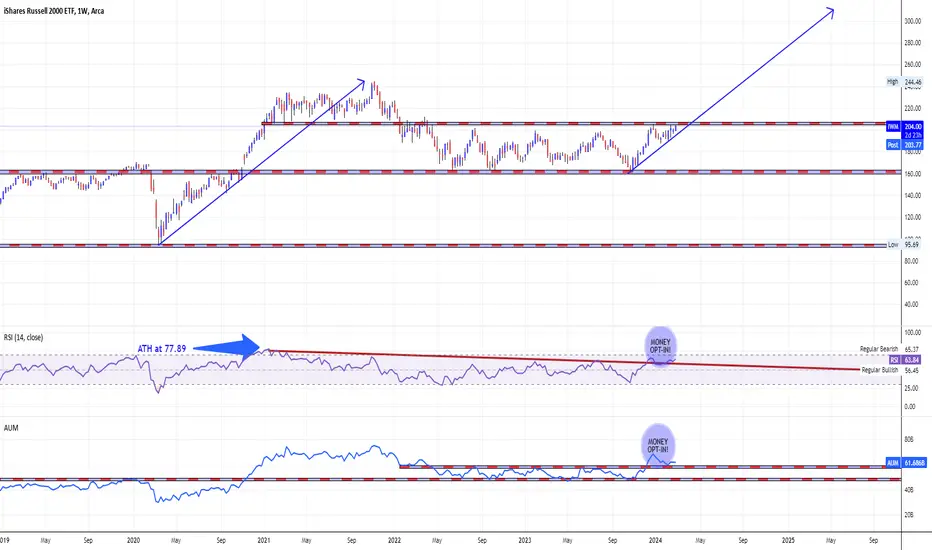
Small 'n Furious. Early 2020's Signaling A Big Midcap Run AheadThe Russell 2000 trailed the S&P 500 significantly in 2023, gaining about 17% compared to a gain of about 24% for the large cap index. That underperformance has spilled over into 2024. Year-to-date, the Russell 2000 is about 2% compared to a 7% gain in the S&P 500.
By the way, that valuation measures make the small cap Russell 2000 index much more compelling when compared to the S&P 500.
Small caps relative to the S&P 500 on a price-to-book basis is back to where it was in 1999, which was the absolute low and was a launch point of 12 years of outperformance for small caps.
As of January 31, 2024 small caps price-to-book ratio is 2.01, as it described on FTSE Russell 2000 Index Factsheet.
Like a sensationally increased shares of Supermicro NASDAQ:SMCI or e.l.f. Beauty Inc NYSE:ELF , I believe many other small cap stocks can be the best ideas for 2024, in part because of that participation in the ongoing stock market rally is improving and is no longer concentrated in just ultra-mega-cap tech stocks, like it was in 2023.
If so-called breadth improves in the stock market, then small cap stocks will catch a bid.
There are three factors will help to boost small-cap stocks in 2024.
First, fund flows into the stock market are necessary for small cap stocks to outperform. If retail funds aren't flowing into the stock market, then funds likely aren't flowing into small cap stocks.
That have changed already in late 2023 as investors start to warm up the stock market.
To be clear, let's take a look at lower technical graph, so-called "AUM", or AMEX:IWM assets under management chart, that is one of the most important ETFs metrics. While it's been correlated pretty well with IWM price action over the past two years, last December has changed the rule, as managed assets smartly jumped to almost historical highs.
Second, small cap stocks are highly levered and tend to have a higher cost of capital, so a decline or no more hikes in interest rates should benefit small cap stocks much more than large cap stocks.
To be clear, let's compare two graphs: for actual U.S. Interest Rate and Expected on Dec, 2024 Interest Rate.
Finally, an expansion in economic growth could be a "huge tailwind" for small cap stocks as they are highly exposed to the domestic economy.
An overlooked area of the stock market is set to soar in 2024 after significantly underperforming the S&P 500 last year.
In technical terms, AMEX:IWM graph is near to break its 52- and 104-weeks highs, to deliver the price 50 percent higher after a breakthrough, like it did it before, on the hottest ever edge of 2020 and 2021.
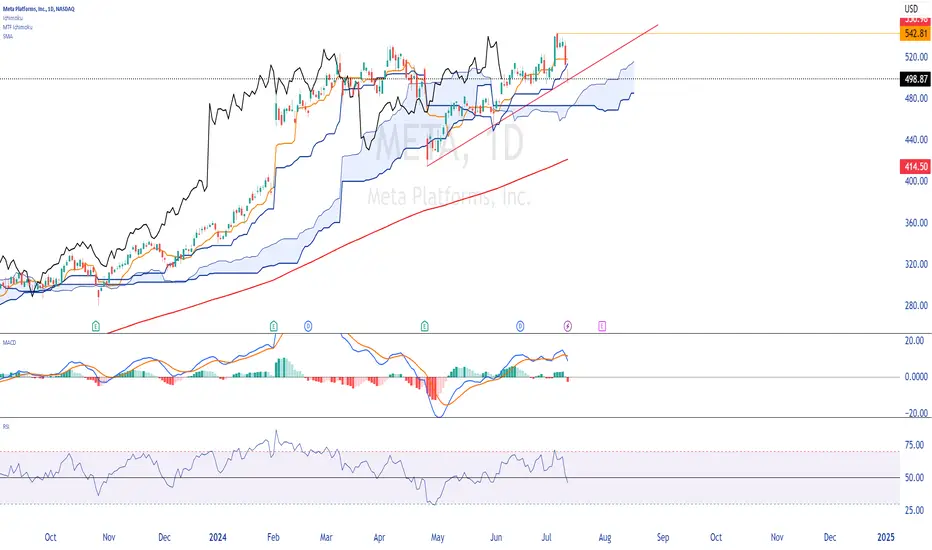
Meta PlatformsDaily chart with ichimoku.
Price under the tankan and under the kinjun.
We are above the cloud. Be careful, the cloud is thin and prices could pass through it easily.
The SMA 200 is under the cloud, so no worries.
MACD increasing, but above the 0 line.
The RSI is slightly below 50.
To conclude, the trend is bullish, we must monitor the break of my red line, which could announce a corrective movement.
Happy trading to you.
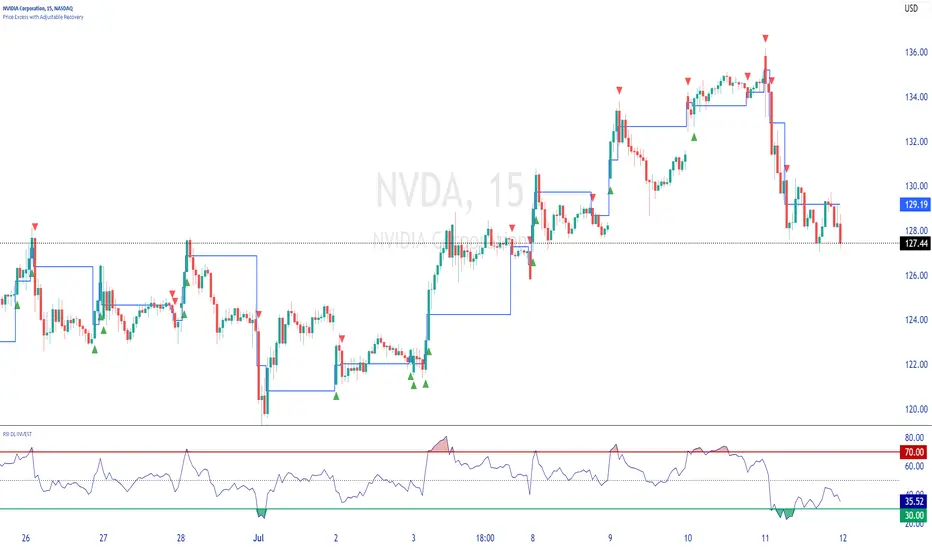
NVIDIA15 minute chart.
Price Excess with Adjustable Recovery indicator, ideal for trading price excesses.
Make up your mind before placing an order.
► Please boost, comment, subscribe!
Tesla Rebounds From Multi Year Key SupportTesla's shares rose after the announcement of new models.
Tesla shares (TSLA) rose 12 percent in post market trading on Tuesday, tracking gains in the U.S. market after the electric vehicle maker promised new, more affordable models.
Tesla said on Tuesday it would introduce new models by early 2025 using its current platforms and production lines, while backing away from more ambitious plans to produce an all-new model expected to cost $25,000.
The rise in Tesla shares provided a much-needed boost after Tesla struggled for months with tough competition and declining sales.
In technical terms, Tesla shares are supported by a multi-year uptrend.
In addition, resistance trend line is also pointed out.
