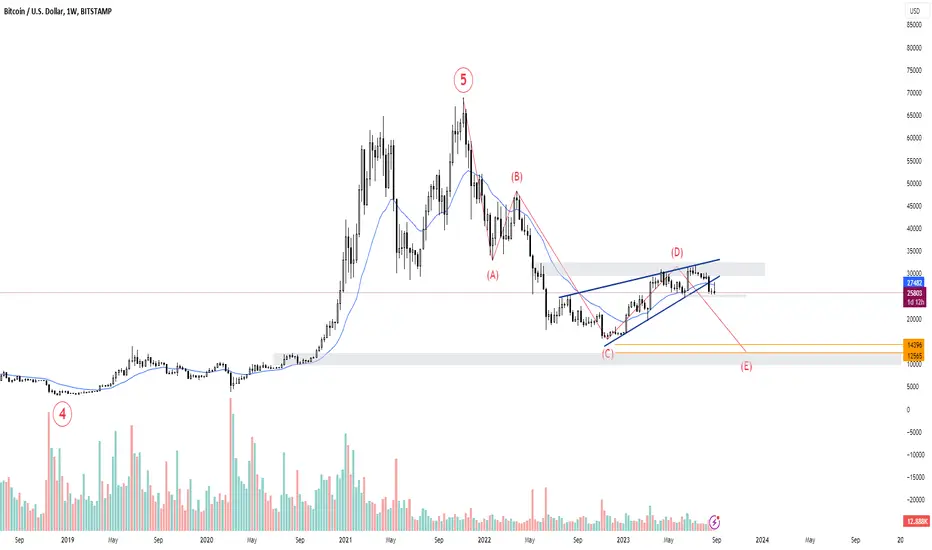
Bitcoin analysisHello friends
In the major period and in the weekly time frame, if we accept that at the price of $69,000, the 5-wave bullish Bitcoin has ended, we can imagine that we are still taking corrective steps.
Also, by hitting the supply area of 30-33 thousand dollars, we saw the breaking of the Rising Wedge pattern, which makes the above analysis more likely to be correct.
If the price level of 24800 dollars is broken, the final confirmation will be issued to continue the decline.
Based on this, my overall view on Bitcoin is bearish
Major
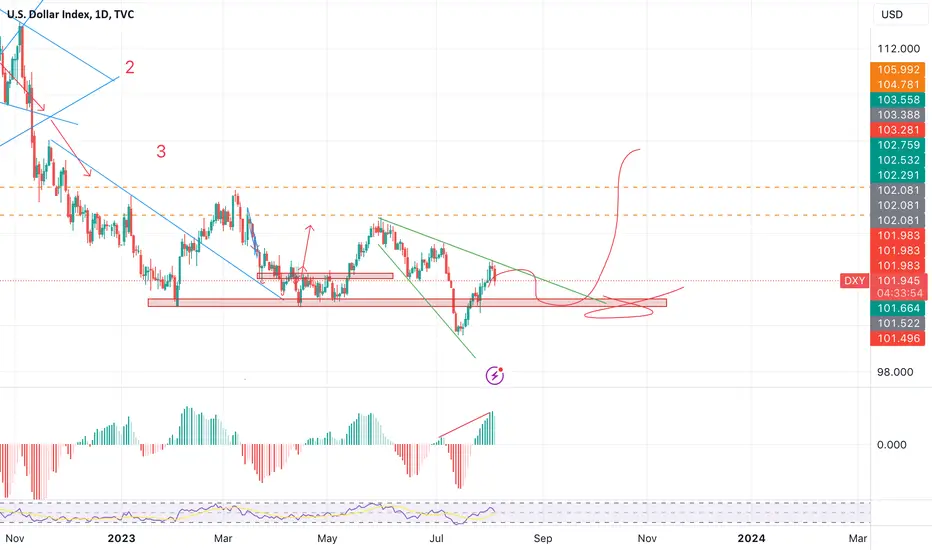
DXY - Bull or Bear?The DXY has essentially been moving sideways for half a year, it will commit to a major move soon and I think the the red support box marked by my, very well drawn, X will be it's giveaway.
What I give the higher probability of happening to is a backtest of the aforementioned box as support before a greater move up. It would also have to break out of the broadening wedge that can be seen.
Having said that there is clear bearish divergence building up and should we break below support, then confirm it as resistance, I can see a few more very bearish months that could present great opportunities for EUR, GBP and BTC.
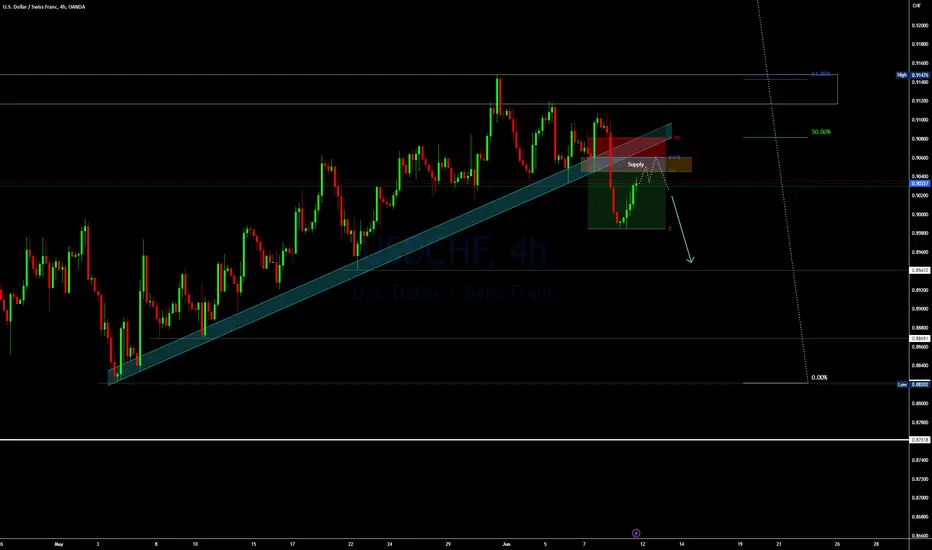
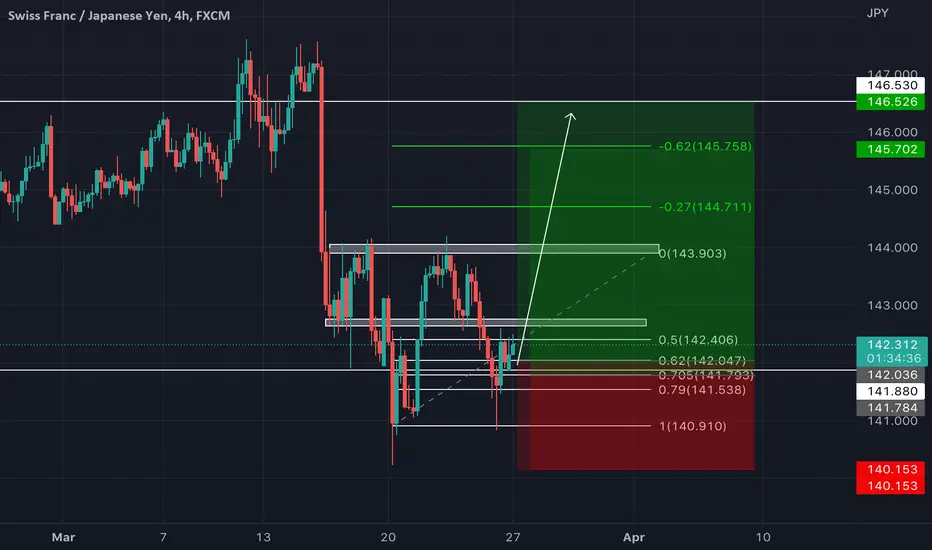
SELL TRADE SETUP ON USDCHFHey Traders,
Check this short position opportunity on USDCHF out.
The Pair just broke below May bullish run and now it is heading back to retest the broken diagonal support.
I am anticipating for a sell trade at the 50% or 61.8% fib level.
Trade it safe.
EURUSD - Video Top-Down Analysis!Hello TradingView Family / Fellow Traders. This is Richard, also known as theSignalyst.
Here is a detailed update top-down analysis for EURUSD.
Which scenario do you think is more likely to happen? and Why?
Always follow your trading plan regarding entry, risk management, and trade management.
Good Luck!.
All Strategies Are Good; If Managed Properly!
~Rich

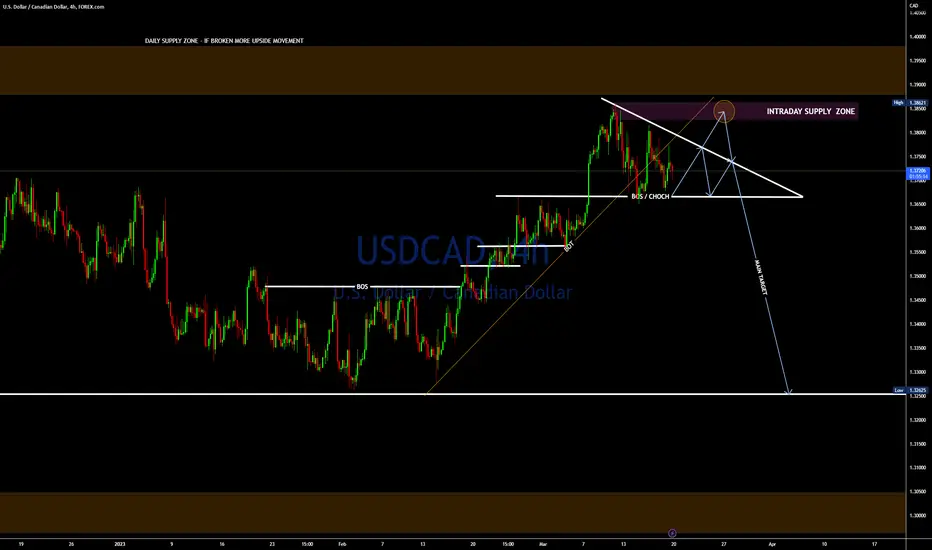
Bearish setup on USDCADHi Traders,
Check this out - USDCAD could start a fresh bearish momentum, after breaking of the bullish trend.
However, with the uncertainty on how heavy FED could bump dollar this is better wait on for a break below the Triangle pattern before looking for a better short trade entry.
That is what i will do, provided that we get a solid breakdown and retest of the "Pennant like descending Triangle".
Watchout
CHFJPY- Long tradeThere are loads of strong confluences which shows that this trade will be a very decent long trade. Very good trade for a swing trade.
Lets see how this trade goes!
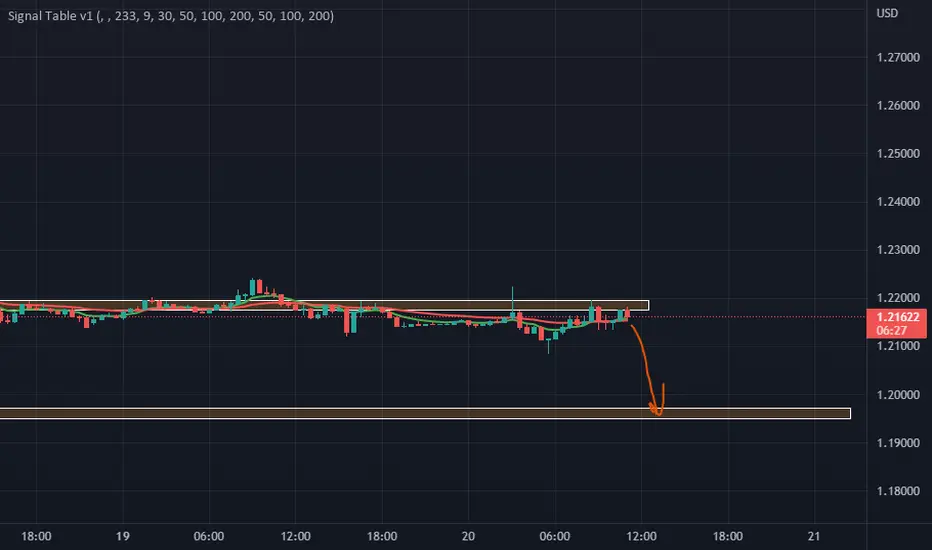
Retest to the supply zonePrice tested the supply zone and dropped, now we notice a beautiful complete retest. The retest is followed by a huge bearish candlestick that indicates a strong rejection. Expecting a massive drop to the breaker block as highlighted. However, we should be wary of the 1.21385 for a partial setback nor rejection…

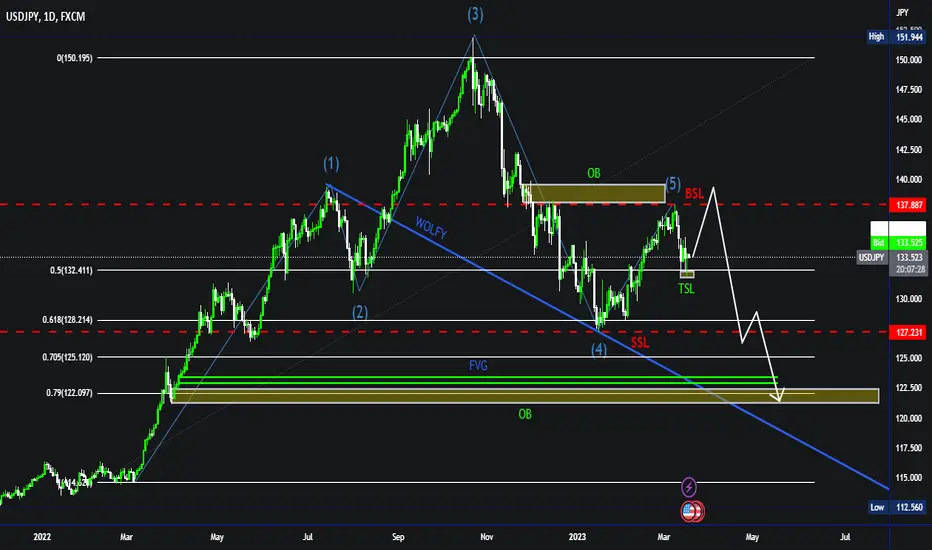
hara-kiri (Long Term)1. Attacking And Hunting BSL.
2. Break the pervious swing and Attack SSL.
3. Consolidation.
4. WW Done.
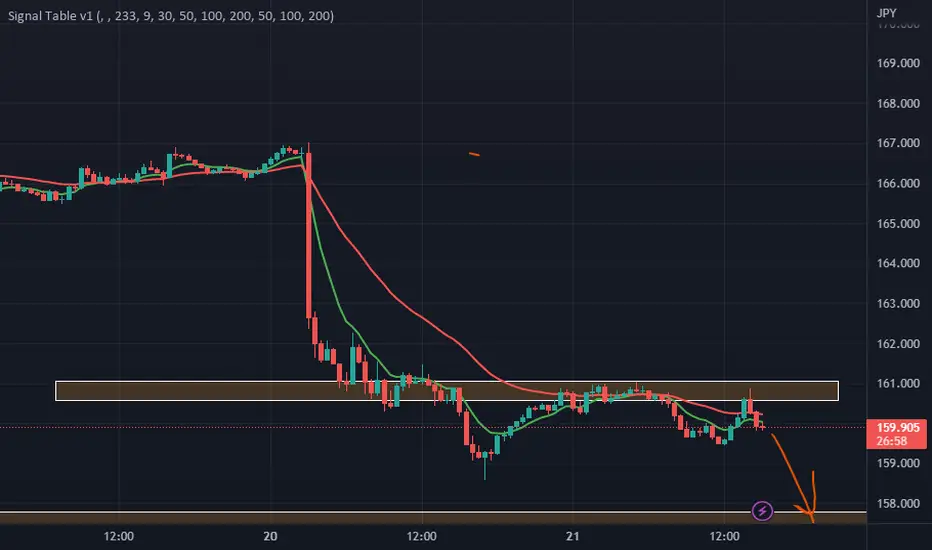
FX:USDJPY
USD CHF - You see it don't youUSD the major currency against the weakening Swiss Franc. The Current Trend exemplifies BULLISH strength. Rejection on a minor resistance shows the bullish strength and the continuation of the bullish trend.

Shakib! short NZDUSDHello Traders Here is The Analysis for this pair,The entry will be taken when LTF market structure change.
I suggest you keep this pair on your watchlist.
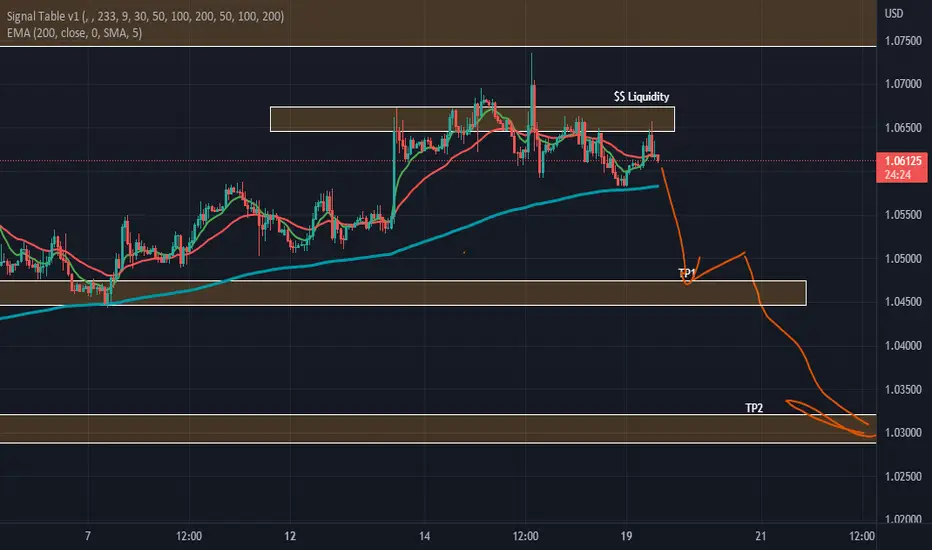
EUR/USD Weekly Forecast 30 Jan - 3 Feb 2023 hEUR/USD Weekly Forecast 30 Jan - 3 Feb 2023
Based on the data from EVZ we can see that currently the IV for this week is at 9.05%, equal to last week.
This can be translated in +/- 1.26% weekly movement from the open of the candle, which makes the next top/bot channel
TOP: 1.10
BOT: 1.073
If we were to make a more accurate statement, based on the current percentile of the EVZ( from 0 to 25) , we can apply a condition in the filter
to look for scenarios when the volatility were lower than 50 percentile( bottom half). If we were to take this data we can see, that our numbers would be:
74% according to the last 20 years of data
67% according to the data since 2022
From the technical rating analysis point of view we can deduct the next information:
Currently there is a :
30% to touch the previous weekly high
70% to touch the previous weekly low
At the same time if we are going to take a look at the moving average rating for different timeframes we can see :
4H Timeframe: +93% Bullish Trend
D Timeframe: +93% Bullish Trend
W Timeframe: +40% Bullish Trend
Lastly on average, based on the current percentile, we can expect that our asset is going to move:
1.081% from the open to the close candle for the bullish scenario
0.966% from the open to the close candle for the bearish scenario

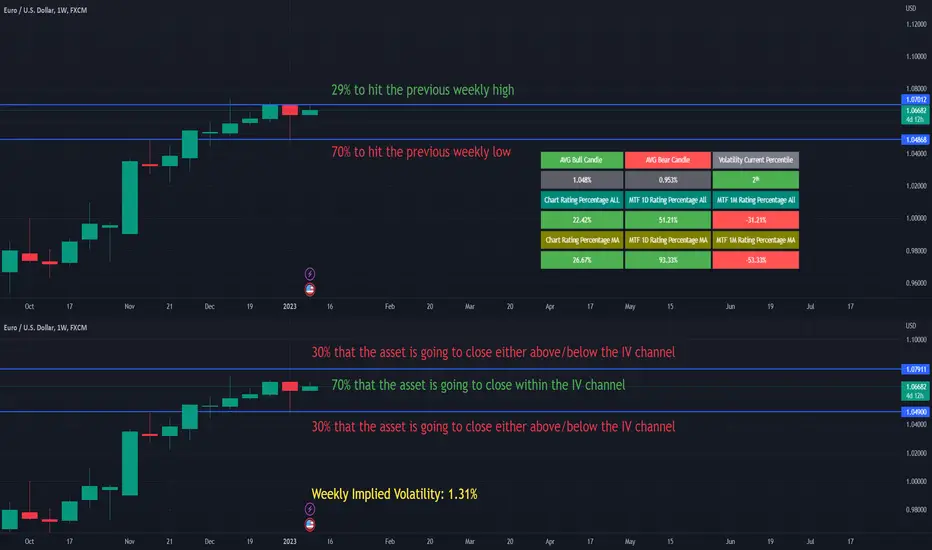
EUR/USD Weekly Volatility Analysis 9-13 Jan 2023 EUR/USD Weekly Volatility Analysis 9-13 Jan 2023
We can see that currently the implied volatility for this week is 1.31%
With this in mind, currently from ATR point of view we are located in the 2th percentile.
Based on this, we can expect that the current weekly candles ( from open to close ) are going to between:
*For calculations, I am using the data since 2022*
Bullish: 1.05% movement
Bearish: 0.95% movement
At the same time, with this data, we can make a top/bot channel which is going to contain inside the movement of this asset,
meaning that there is a 30% that our close of the weekly candle of this asset is going to be either above/below the next channel:
TOP: 1.079
BOT: 1.049
Taking into consideration the previous weekly high/low, currently for this candle there is :
29% probability we are going to touch previous weekly high
70% probability we are going to touch previous weekly low
Lastly, from the technical analysis point of view, currently from
Daily timeframe indicates 93.33% BULLISH trend from the moving averages index
Weekly timeframe indicates 26.67 BULLISH trend from the moving averages index
Monthly timeframe indicates -53.33% BEARISH trend from the moving averages index
$O Childhoods End ✨ The live Childhoods End price today is $0.000013 USD with a 24-hour trading volume of $5,703.27 USD. We update our O to USD price in real-time. Childhoods End is up 0.61% in the last 24 hours. The current CoinMarketCap ranking is #4958, with a live market cap of not available. The circulating supply is not available and the max. supply is not available.

GBPUSD Short PotentialHuge R to be gained potentially. We are in the middle of a bearish retracement on daily, with bearish price structure printed on intraday timeframes. Bouncing off from supply zone, and should hopefully break out of this range. I think this could be the time.
TRADING IDEA --- NOT AN INVESTMENT OPPORTUNITY
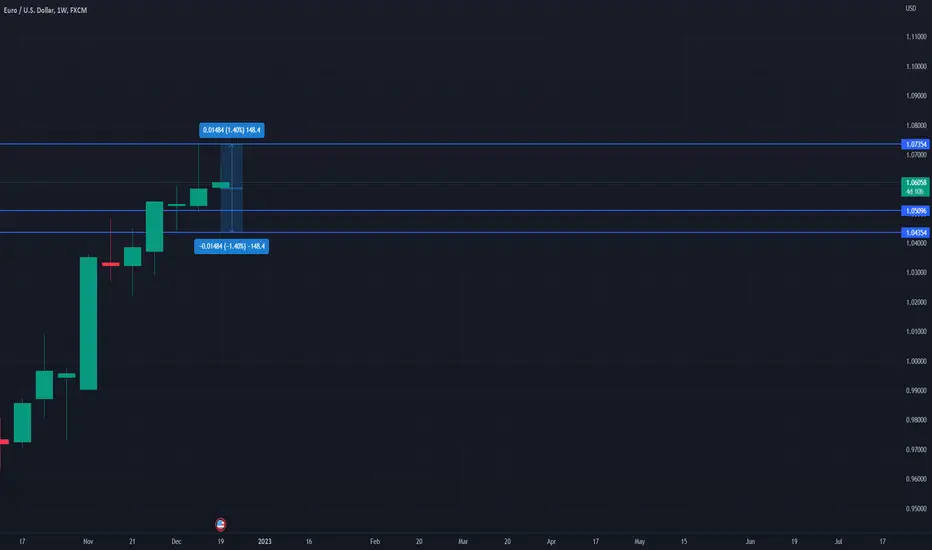
EURUSD Weekly Volatility Analysis 19-23 Dec 2022 EURUSD Weekly Volatility Analysis 19-23 Dec 2022
We can see that currently the implied volatility for this week is around 1.4%, DOWN from 1.53% from last week
With this in mind, currently from ATR point of view we are located in the 1st percentile.
Based on this, we can expect that the current weekly candles ( from open to close ) are going to between:
Bullish: 1.089% movement
Bearish: 0.966% movement
At the same time, with this data, we can make a top/bot channel which is going to contain inside the movement of this asset,
meaning that there is a 30% that our close of the weekly candle of this asset is going to be either above/below the next channel:
TOP: 1.075
BOT: 1.043
Taking into consideration the previous weekly high/low, currently for this candle there is :
65% probability we are going to touch previous high 1.0735
35% probability we are going to touch previous low 1.0435
Lastly, from the technical analysis point of view, currently from
Weekly timeframe indicates 26% BULLISH trend from the moving averages index
Daily timeframe indicates 80% BULLISH trend from the moving averages index
4H timeframe indicates -13% BEARISH trend from the moving averages index
GBPUSD Shorts (H1/H4)Shorts placed on GU - retest of supply/resistance and rejection on lower high. We are currently going through a pullback phase on the daily chart, GU is still long term bull there - though the bear pullback momentum will be strong next week.

EURUSD Weekly Volatility Analysis 12-16 Dec 2022 EURUSD Weekly Volatility Analysis 12-16 Dec 2022
We can see that currently the implied volatility for this week is around 1.48%, DOWN from 1.53% from last week
according to EVZ data
With this in mind, currently from ATR point of view we are located in the 1ST percentile,
while according to EVZ, we are on 1th percentile.
Based on this, we can expect that the current weekly candles ( from open to close ) are going to between:
Bullish: 1.121% movement
Bearish: 0.966% movement
At the same time, with this data, we can make a top/bot channel which is going to contain inside the movement of this asset,
meaning that there is a 30% that our close of the weekly candle of this asset is going to be either above/below the next channel:
TOP: 1.069
BOT: 1.037
Taking into consideration the previous weekly high/low, currently for this candle there is :
71% probability we are going to touch previous high 1.059
30% probability we are going to touch previous low 1.044
Lastly, from the technical analysis point of view, currently from
Weekly timeframe indicates 26% BULLISH trend from the moving averages index
Daily timeframe indicates 93% BULLISH trend from the moving averages index
4H timeframe indicates 80% BULLISH trend from the moving averages index
AUDUSD SHORT sellrisk ratio 1/4
thick stop loss
lower low
lower trendline breakout
retest and start falling
GBPUSD Longs H4Targeting 1.2470 area on the H4 timeframe. Nice 123 long, higher highs, higher lows. Strong bullish break after retracement in a strong bull trend. Ticks all the boxes. Continuation of a major retracement on Daily.
TRADING IDEA -- NOT AN INVESTMENT OPPORTUNITY
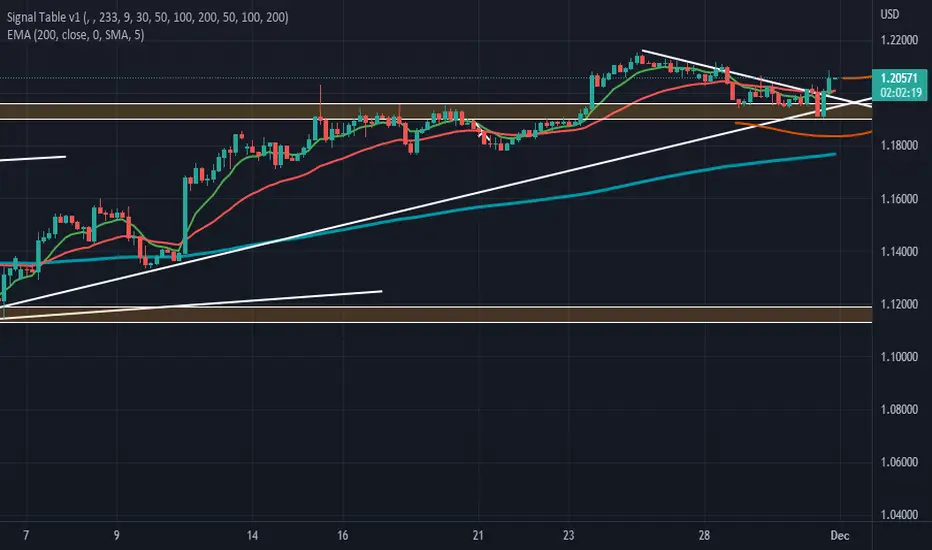
EURUSD Weekly Forecast Analysis 28 Nov-2 Dec 2022 EURUSD Weekly Forecast Analysis 28 Nov-2 Dec 2022
We can see that this week, the current implied volatility is around 1.65% , down from 1.86% of last week.
According to ATR calculations, we are currently on the 13th percentile, while with EVZ we are on 1th percentile.
Based on this data, we can expect on average, the movement from open to close of the weekly candle to be :
In case of bullish - 1.185%
In case of bearish - 0.966%
With the current IV calculation, we have currently 30% that the close of the weekly candle is going to finish either above
or below the next channel:
TOP: 1.057
BOT: 1.018
At the same time, taking into consideration the high/low touch calculation from the previous values, we can expect for this week:
30% chance that we are going to touch the previous low of the weekly candle of 1.022
70% chance that we are going to touch the previous high of the weekly candle of 1.045( already hit)
Lastly from a technical analysis point of view, currently 4% of the moving averages rating, are insinuating we are in a BULLISH trend.
