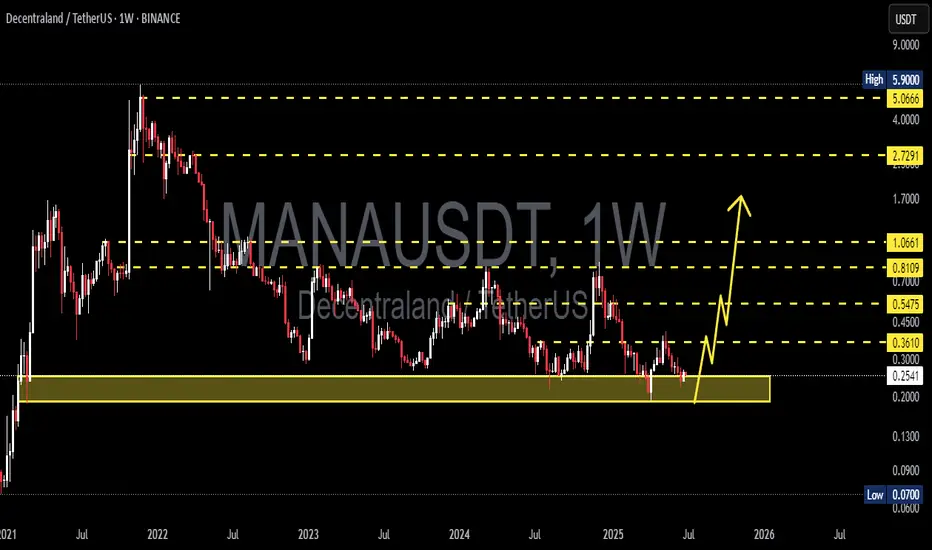
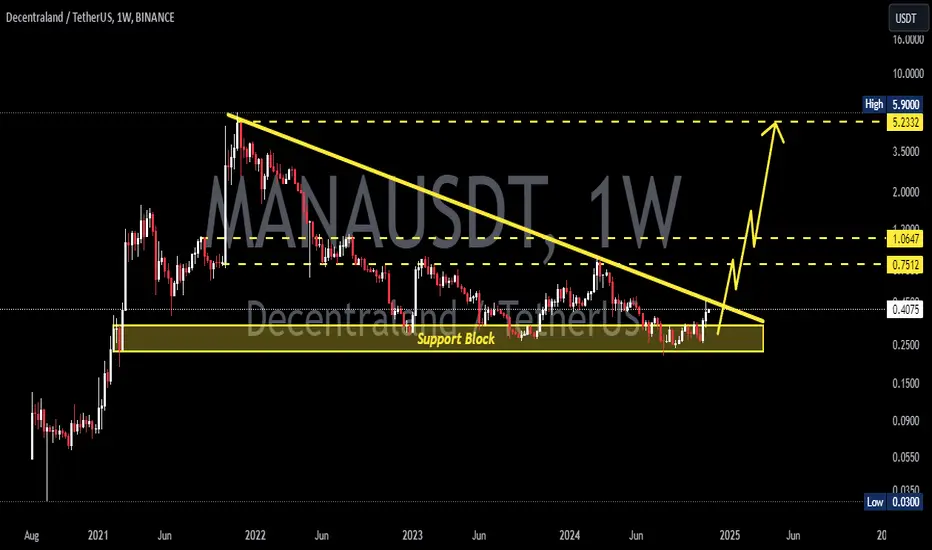
MANA/USDT Rebounding from Key Weekly Demand Zone – Path to $1?🔶 Strong Support Zone (Demand Zone):
MANA/USDT is currently testing a major weekly support area between $0.20 – $0.30, a zone that has historically acted as a strong demand level since 2021. Price has bounced off this region multiple times, indicating strong buyer interest and potential for a bullish reversal.
🔶 Chart Pattern:
There is no classic pattern like a double bottom or head & shoulders, but price structure shows signs of horizontal accumulation, which resembles a Wyckoff re-accumulation phase—a typical base formation before a strong upside breakout.
🚀 Bullish Scenario:
If the price holds above the $0.25 support and forms a higher low, a bullish continuation is likely. The following resistance levels could serve as potential upside targets:
1. $0.3610 – Initial resistance and confirmation level.
2. $0.5475 – Intermediate psychological level.
3. $0.8109 – Former supply zone.
4. $1.0661 – Major resistance from 2022.
5. $2.7291 – $5.0666 – Long-term targets if macro bull trend resumes.
> Bullish Confirmation: A strong weekly candle close above $0.36 with high volume could spark a major rally.
🔻 Bearish Scenario:
If price breaks down below $0.25 and closes below it on the weekly timeframe, it would invalidate the bullish structure and may trigger further downside towards:
$0.13 – $0.07, the historical lows seen in early 2021.
> Bearish Confirmation: A weekly close below $0.25 with increasing volume would suggest sellers are back in control.
🧠 Conclusion:
MANA/USDT is at a pivotal point within a long-standing support zone. Holding this level could result in a strong upward move, but a breakdown would indicate further bearish pressure. Traders should watch this zone closely for confirmation in either direction.
#MANAUSDT #Decentraland #CryptoTrading #TechnicalAnalysis #AltcoinAnalysis #BullishSetup #SupportZone #TradingView #MetaverseCrypto #CryptoBreakout
Manausdtidea
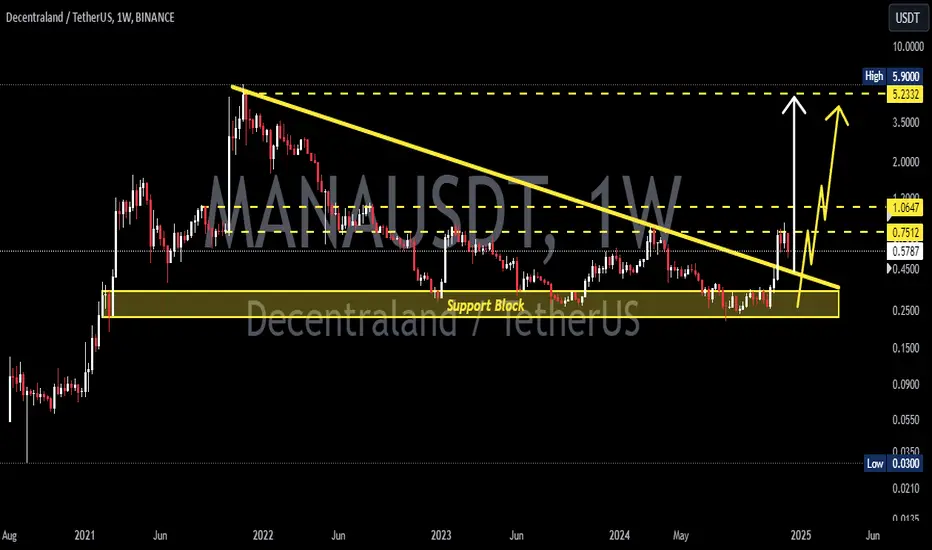
MANAUSDT 1W AnalysisMANA ~ 1W Analysis
#MANA Buy back gradually from this support block with a short term target of at least 20%+ from this support.
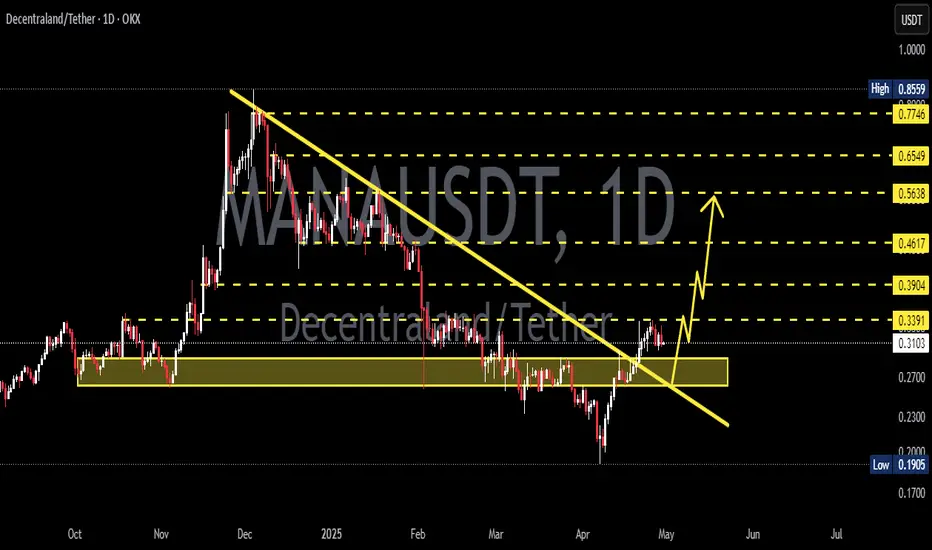
MANAUSDT 1D AnalysisMANA ~ 1D Analysis
#MANA Buy gradually when re -testing this support with a short -term target of at least 15%+ from here.
MANAUSDT 1WMANA ~ 1W Analysis
#MANA Buy gradually from here if you still have a Conviction on this coin with a short -term target of at least 20%+.

MANA Accumulating – Ready for a Pump?$MANA/USDT weekly chart shows the price moving within a sideways accumulation zone, respecting a rising support line after a prolonged downtrend.
It is currently testing the 50 EMA, which acts as a key resistance level. A breakout above this could signal further upside, while failure to hold could lead to a retest of the support zone.
The Stoch RSI is in the oversold region, suggesting potential bullish momentum. If MANA breaks above 0.35 USDT, it could push towards 0.70 USDT+, while a drop below 0.20 USDT might extend the bearish trend.
DYOR, NFA
Do Likes and follow us

MANAUSDT 1WMANA ~ 1W Analysis
#MANA If you still have a Conviction on this coin,. This is a very good support for now. buy gradually with a minimum target of 20%+

MANAUSDT 1WMANA Update ~ 1W
#MANA At Time frame 1W,. EURONEXT:MANA rejected by this local resistance. The best way for now. You can buy back when this resistance line is retested or you can place another purchase on this support block.
these two scenarios with a target of 20%++
MANAUSDT 1WMANA ~ 1W
#MANA This chart is very interesting,. It is very bullish if this resistance line is successfully broken. if you still have Conviction on this coin. Buy in stages starting from here. minimum target 20%++
MANAUSD 1WMANA ~ 1W
#MANA This is an important support block that we are looking at.
Maybe a few small purchases are very interesting here, with a target of at least 20%++

MANAUSDT Elliott Waves AnalysisHello friends.
Please support my work by clicking the LIKE button👍(If you liked). Also i will appreciate for ur activity. Thank you!
Everything on the chart.
Targets: 0.5 - 0.53 - 0.57
after first target reached move ur stop to breakeven
Stop: ~0.33 (depending of ur risk). ALWAYS follow ur RM .
RR: 1 to 3
risk is justified
Good luck everyone!
Follow me on TRADINGView, if you don't want to miss my next analysis or signals.
It's not financial advice.
Dont Forget, always make your own research before to trade my ideas!
Open to any questions and suggestions

MANAUSDT Elliott Waves Analysis (LONGTERM)Hello friends.
Please support my work by clicking the LIKE button👍(If you liked). Also i will appreciate for ur activity. Thank you!
Everything on the chart.
Entry zone: 0.25 - 0.2
Targets: 0.35 - 0.55 - 0.85
after first target reached move ur stop to breakeven
Stop: (depending of ur risk). ALWAYS follow ur RM .
risk is justified
Good luck everyone!
Follow me on TRADINGView, if you don't want to miss my next analysis or signals.
It's not financial advice.
Dont Forget, always make your own research before to trade my ideas!
Open to any questions and suggestions
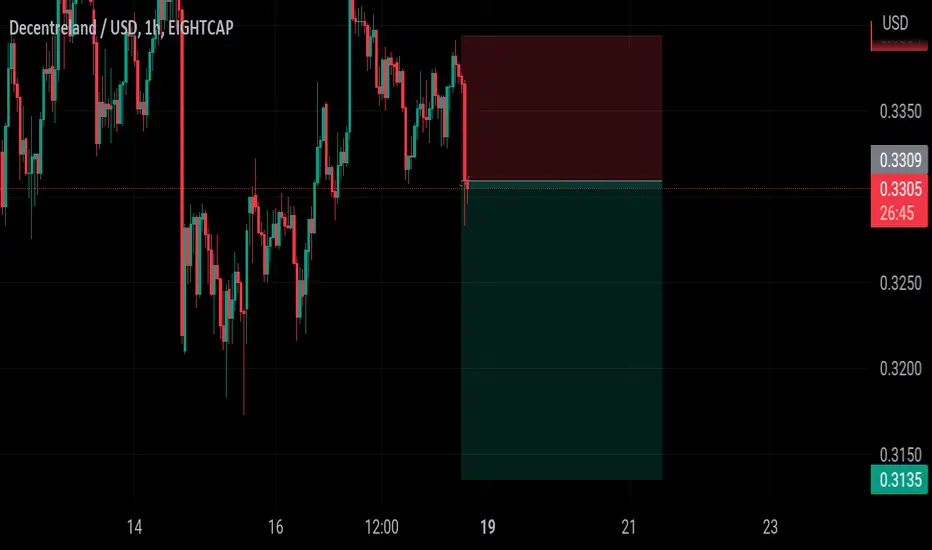
MANAUSDThis trade has the potential to drop. I am expecting a move down to 0.3135 which is the next support to test l.
MANAUSDT Elliott Waves AnalysisHello friends.
Please support my work by clicking the LIKE button👍(If you liked). Also i will appreciate for ur activity. Thank you!
Everything on the chart.
Entry: market and lower
Targets: 0.7 - 0.9 - ~1.05
after first target reached move ur stop to breakeven
Stop: (depending of ur risk). ALWAYS follow ur RM .
risk is justified
Good luck everyone!
Follow me on TRADINGView, if you don't want to miss my next analysis or signals.
It's not financial advice.
Dont Forget, always make your own research before to trade my ideas!
Open to any questions and suggestions.

MANAUSDT Elliott Waves Analysis (Local Expectations)Hello friends.
Please support my work by clicking the LIKE button👍(If you liked). Also i will appreciate for ur activity. Thank you!
Everything on the chart.
Entry: market and higher
Target: 0.64 - 0.56 - and maybe even ~0.52
after first target reached move ur stop in breakeven
Stop: ~0.85 (depending of ur risk). ALWAYS follow ur RM .
risk is justified
Good luck everyone!
Follow me on TRADINGView, if you don't want to miss my next analysis or signals.
It's not financial advice.
Dont Forget, always make your own research before to trade my ideas!
Open to any questions and suggestions.
