Market Bias & Top Stock Watches - 10/28/2022Bias: Bearish grind.
Top Watches: Long - PINS, INTC, XOM, TMUS, GILD, EQNR, NYCB. Short - AMZN, ZIM, SNOW, ABNB, CRM, EW, BIDU
Follow my page for daily pre-market reviews and trade ideas.
Market

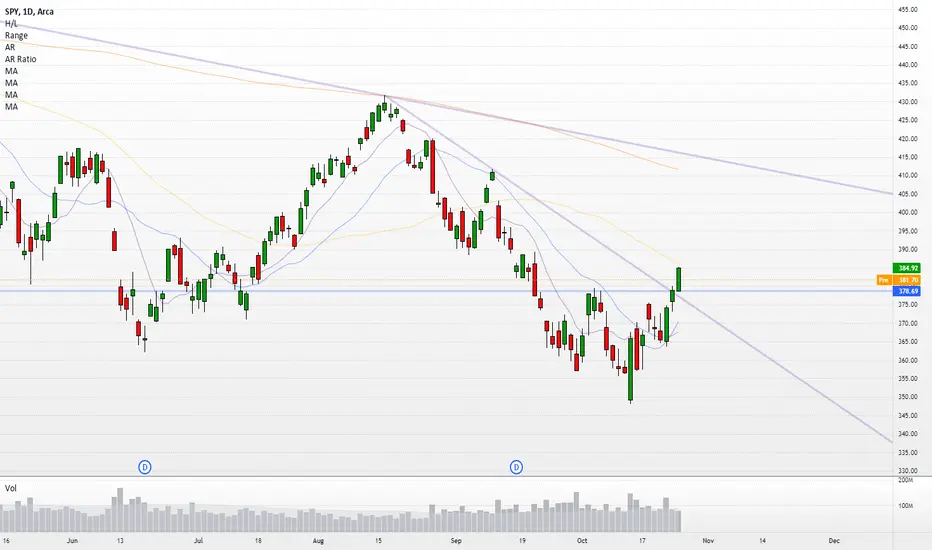
Probability of Rally Failure is 90% There is an important study, that estimates the success of a Follow Through Days depending on how close a Distribution Day is observed. Look at the annotated chart on SPX.
In essence if we observe Distribution Days close to the FTD then the probability of Failure is high. (Failure is defined by undercut of the Day 1 Rally Day ). Study is courtesy of IBD Research. I have annotated the zones in Red, Yellow and Purple below.
🟥 Red Zone - Distribution Day 1-2 days after FTD: 95% Failure Rate
🟨 Yellow Zone - Distribution Day 3 days after FTD: 90% Failure Rate
🟪 Purple Zone - Distribution Day 4-5 days after FTD: 30% Failure Rate
We observed first Distribution on Day 3 and another one yesterday on Day 4 (white bars on chart) - this is why I have labeled all my trades as High Risk - since, I wanted to see how we are to perform first week after FTD.

Market Bias & Top Stock WatchesBias: Choppy Bearish.
Top Watches: Long - CAT, TSLA, CMCSA, NVDA, XOM, LUV, TDOC, WFC, SHOP. Short - EQT, GOOG, AMZN, MO, ON.
Follow my page for daily pre-market reviews and trade ideas.

Market Bias & Top Stock Watches - 10/26/2022Bias: Bear Chop, Could be an inside day.
Top Watches: Long - KHC, RUM, CF, ENPH, CMCSA, PM, BAC. Short - MSFT, GOOG, SKX, STX, SNOW, TXN
P.S. Was not able to upload a video today as TradingView kept giving me error messages while publishing.
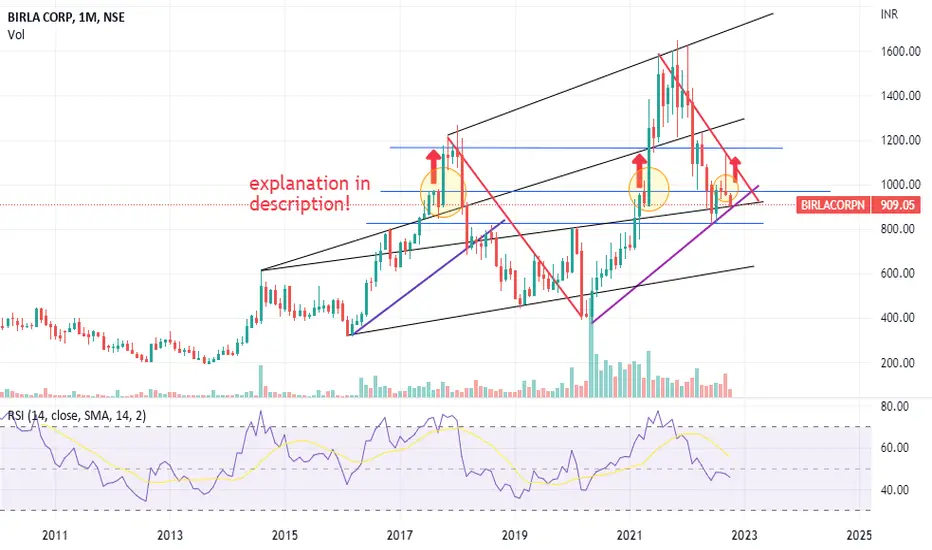
BIRLA CORP ANALYSIS!!i have determined the trend and great levels for buying and selling the stock. its a bit volatile market for this stock, but one can earn if he/she has a proper determined plan to trade such type of stocks.
ANALYSIS:
1. BLACK LINES are the different chart pattern trends.
2. BLUE LINES are the good levels to buy/sell the stock
3. PURPLE LINE is for the shorter swing trade, saying stock trading rs.909 is good to buy till 1160. if breaches, then all the way too 630.
4. ARROW MARKS & THE CIRCLES: everytime the stock broke the 970 level, it gave a very good upside movement, a level to watch out for.
Market Exposure after FTDIBD Market School indicator suggest we have a clear sky to start testing waters. Here is what the methodology has flagged after the recent Rally Day.
Annotations
1 = Most recent unbroken Rally Day
2 = Follow Through Day
3 = Confirming Buy signal (named B3)
4 = Additional Follow Through Day + Confirming Buy Signal (B8)
5 = Permitable Market Exposure as per the methodology
My approach!
I do not have an exposure of 90% currently as 5 suggests. This is only guidence. I am more conservative and rather have taken a few tiny pilot positions. I want to see that the action is confirming. We are reaching the 21EMA on SP500 and hence I expect some stalling here. We also have an important earnings in the recent days, which means that there could be abrupt failure.

Market upUPS, 3M and General Motors all posted better-than-expected earnings. Shares of UPS and GM rose in early trading, but 3M dipped 1.6%.
Coca-Cola also reported stronger-than-forecast earnings, sending the stock up 1%.
So far this season, companies have proven they may be faring better than anticipated.

Market Bias & Top Stock WatchesBias: Neutral, leaning Bullish (Bull over 380, Bear under 376)
Top Watches: Long - UPS, GM, KO, GE, F. Short - CLF, GLW, XRX

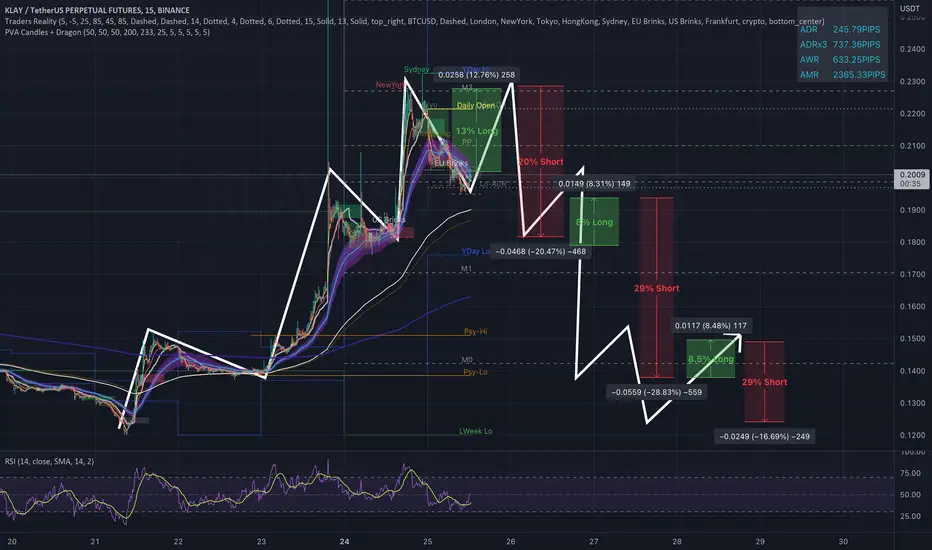
Market Maker Pattern with Multiple Long / Short TradesIf this Market Maker pattern plays out in symmetry to the left side, which is more visible even on the 5m chart, then there will be several long opportunities and several short opportunities with opportunity to either reverse positions right into the next drop or retrace. There is also a large red candle on the left side, seen on linked chart of 30m timeframe, that was only partially recovered and these red candles typically always get recovered by a corresponding green candle to the right side of the chart. Thatt gives additional strength to the idea that price will return to previous high of the structure to reclain the red candle. And each of these drop and recoveries is a significant percentage move, ranging from 9% to 30% and with 20x leverage that could make for a fairly safe and profitable series of plays.
Of course, these patterns don't always play out completely symmetrical, but even if it fulfills a few of the moves or does so in smaller proportion to the moves on the left side, it's still a solid opportunity due to likelihood of move to upside to reclaim red candle and then likelihood of fulfillment of at least approximate fulfillment of the markdown / drop phase of the pattern.
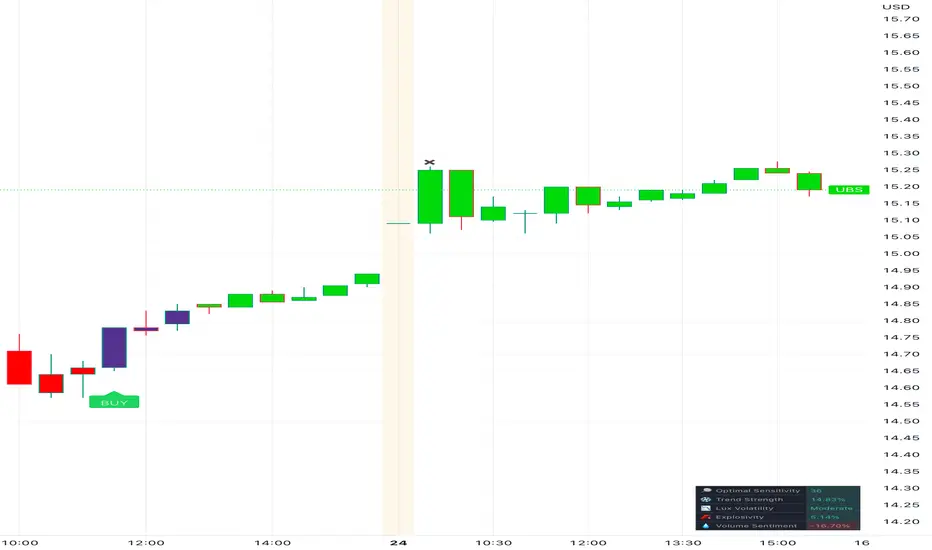
UBS and other companies announced $5 billion share buyback.Up
Up
Up
UBS and other companies begin a $5 billion share buyback.
Strong Earnings SeasonUp
Up
Up
Market up and multiples on technology up.
Focus. Pivot by 50 bps in December and more earnings growth keeps adding to SPY up.

BTC Detailed Top-Down Analysis - Day 89Hello TradingView Family / Fellow Traders. This is Richard Nasr, as known as theSignalyst.
89 out of 500 days done.
I truly appreciate your continuous support everyone!
Let me know if you like the series, and if you would like me to change or add anything.
Always follow your trading plan regarding entry, risk management, and trade management.
Good Luck!.
All Strategies Are Good; If Managed Properly!
~Rich

Bulls are not strong enough, the pair is in the line of descend!Hello traders! We are seeing that the oil demand is declinig, affecting the pair and making bulls be aware of future declines. Also we found in the charts a recongnize pattern of a head and shoulders, with a target around 1.30 if it breaks the support among the 1.36 level. The FED is fighting againts the ghost of recession and the 10 years bonds are fearing a descend from a 15 years top. Some fed officials are concernign about the oversizing uploads. This facts can draw a direction towards a new trend in the markets. Technically the level of 1.36152 is a support to watch. If the bears could break this level, we could see the prince drop to 1.33102 and 1.30 if the strong of the bears keep going. This is not financial advice, good trades and profits!!


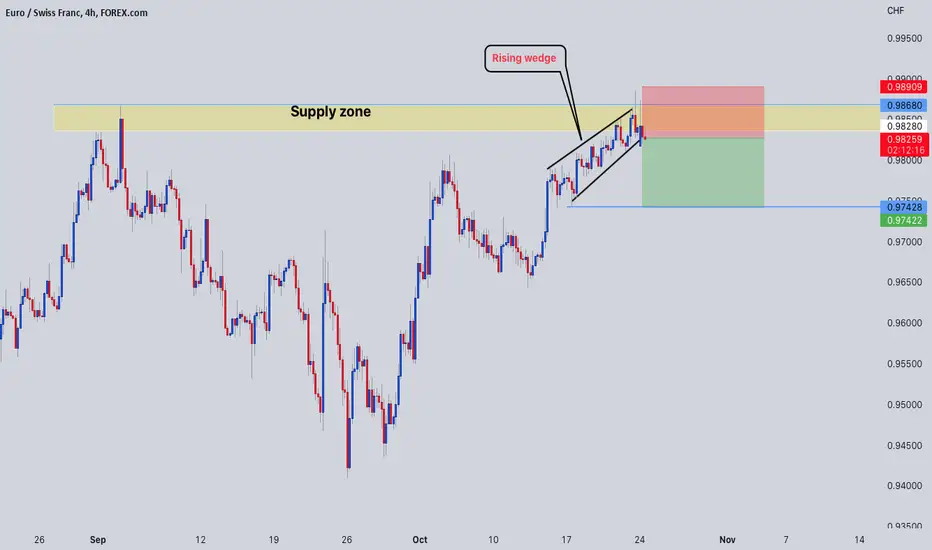
EURCHF - short Good day traders, welcome to a new week. On EURCHF, market has been bearish for the longest .Price has currently made a pull back to a supply zone with a rising wedge pattern which indicates a reversal to the downside
I have something for you (-.-)hello
4 important target's on the chart.
I belive we still can see more downside , IMO 12085 is bitcoin current cycle bottom and we have time to see it in the next day's and week's !
but in worst case scenario for the longer term, I belive $5900 can be absolute market bootom for BTC
