Nightly $SPY / $SPX Scenarios for May 23, 2025 🔮 Nightly AMEX:SPY / SP:SPX Scenarios for May 23, 2025 🔮
🌍 Market-Moving News 🌍
🇬🇧 Global Bond Yields Signal Rising Term Premium
Long-dated government bond yields in the U.S., U.K., and Japan surged, with the U.S. 30-year Treasury yield touching 5.09%, as investors demand higher compensation for locking in funds amid mounting debt and inflation risks
🏗️ Komatsu Sees Tariff Relief
Komatsu’s CEO says a recent U.S.–China trade truce may cut the company’s tariff hit by $140 million, easing cost pressures on its U.S. operations and brightening machinery sector outlook
📉 U.S. Stocks End Flat as Yields Ease
Wall Street closed little changed, with the S&P 500 and Dow finishing flat and the Nasdaq up 0.3%, after Treasury yields retreated slightly following recent spikes
📊 Key Data Releases 📊
📅 Friday, May 23:
🏠 New Home Sales (10:00 AM ET)
Reports the number of newly signed contracts for single-family homes, a direct gauge of housing demand and consumer confidence.
⚠️ Disclaimer:
This information is for educational and informational purposes only and should not be construed as financial advice. Always consult a licensed financial advisor before making investment decisions.
📌 #trading #stockmarket #economy #news #trendtao #charting #technicalanalysis
Market

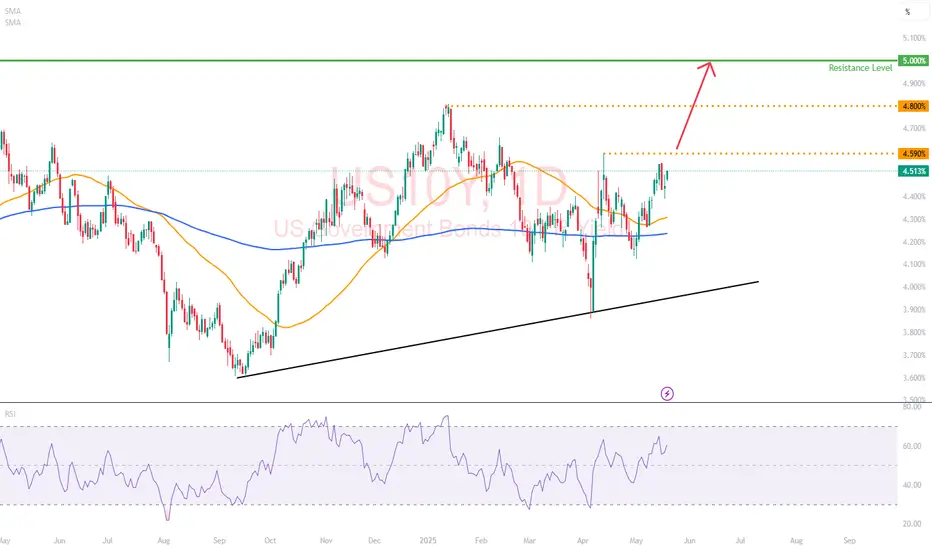
US10Y Technical Breakdown – Post-Moody’s DowngradeMoody’s has downgraded the US credit rating for the first time since 2011, citing rising debt levels and long-term fiscal challenges.
This move sends a clear warning signal about America’s fiscal path and adds fresh uncertainty to markets already navigating interest rates, inflation, and geopolitical risks.
Focus on the US 10-Year Treasury Yield as the market’s pulse on sovereign risk, inflation expectations, and future borrowing costs. Tracking its medium-term trend will provide crucial clues on market sentiment and risk appetite.
Medium-Term Market Analysis
(6-12 Months)
1. Structural Fiscal Risks
This downgrade highlights growing concerns over the US debt trajectory and political gridlock around spending and debt ceilings.
It’s less about an immediate crisis, more about long-term sustainability.
2. Rising Yields and Market Volatility
The 10-year Treasury yield could move higher, beyond 4.60% we could see rates possibly testing previous resistance of 4.80% (Jan 2025) or 5.00% (Oct 2023).
Higher yields mean increased borrowing costs, which can pressure interest-sensitive sectors like tech and real estate and add volatility to equities.
3. Federal Reserve’s Tough Balancing Act
With bond yields edging up, the Fed faces a dilemma: delaying cuts further could risk inflation climbing higher.
However, this downgrade raises the likelihood that the Fed could keep rates higher for longer than many investors expect.
4. Dollar and Capital Flow Shifts
While a credit downgrade may initially pressure the US dollar, its safe-haven status remains strong.
Global capital could increasingly look to alternatives like emerging markets or gold, leading to shifts in international financial flows.
Perspective
While Moody’s downgrade is a serious signal, it’s important to consider:
1) Political Leverage: Sometimes, rating agencies’ decisions can influence political negotiations. This downgrade may add pressure on US lawmakers to reach fiscal compromises. It’s a tool, not necessarily a verdict.
2) US Dollar & Debt Demand Resilience: Despite concerns, US Treasury securities remain the world’s primary safe asset, with global demand still robust. This could temper yield spikes and limit fallout.
Some could view the downgrade as “priced in” to a degree, given ongoing debt ceiling battles and past political brinkmanship.
If true, markets may react less dramatically than feared.
Watch
US 10-Year Yield: Key indicator to watch for shifts in risk sentiment and inflation expectations.
Equities: Prepare for increased volatility; consider defensive sectors and value plays.
Credit Markets: Monitor for widening spreads as risk aversion grows.
Policy Signals: Fed communications and US political developments will be critical catalysts.
This Moody’s downgrade isn’t just a headline, it’s a medium-term signal to recalibrate risk and position for a more uncertain fiscal backdrop.
Nightly $SPY / $SPX Scenarios for May 22, 2025 🔮 Nightly AMEX:SPY / SP:SPX Scenarios for May 22, 2025 🔮
🌍 Market-Moving News 🌍
📈 Treasury Yields Surge Amid Weak Bond Auction
U.S. Treasury yields continued their upward trajectory, with the 10-year yield nearing 4.6% and the 30-year yield surpassing 5%, marking the highest levels since early 2023. This increase followed a weak $16 billion auction of 20-year bonds, which attracted less investor demand and sold at higher-than-expected yields. Factors contributing to the rise include fading recession fears, persistent inflation concerns, and growing fiscal worries related to potential tax cut extensions.
📉 Stock Market Declines as Tech Stocks Retreat
The stock market experienced significant losses, with the Dow Jones Industrial Average dropping 1.9%, falling below its 200-day moving average. The S&P 500 and Nasdaq fell 1.6% and 1.4%, respectively.
💼 Snowflake ( NYSE:SNOW ) Reports Strong Earnings
Snowflake Inc. reported record quarterly revenue of $1.04 billion, surpassing expectations. Product revenue increased 26% year-over-year to $996.8 million. The company raised its full-year forecast to $4.325 billion, reflecting a 25% year-over-year increase. Despite a GAAP net loss of $430 million, Snowflake posted an adjusted profit of 24 cents per share, exceeding the 21-cent estimate.
📊 Morgan Stanley Turns Bullish on U.S. Stocks
Morgan Stanley has shifted to a bullish stance on U.S. stocks and bonds, raising its outlook due to signs of market stabilization and improving growth conditions. The bank maintains a base target of 6,500 for the S&P 500 by mid-2026, with a bullish scenario projecting 7,200.
📊 Key Data Releases 📊
📅 Thursday, May 22:
8:30 AM ET: Initial Jobless Claims
9:45 AM ET: S&P Global Flash U.S. Services PMI for May
10:00 AM ET: Advance Services Report (First Quarter 2025)
⚠️ Disclaimer:
This information is for educational and informational purposes only and should not be construed as financial advice. Always consult a licensed financial advisor before making investment decisions.
📌 #trading #stockmarket #economy #news #trendtao #charting #technicalanalysis

Nightly $SPY / $SPX Scenarios for May 21, 2025🔮 Nightly AMEX:SPY / SP:SPX Scenarios for May 21, 2025 🔮
🌍 Market-Moving News 🌍
🇺🇸 G7 Finance Ministers Convene Amid Tariff Tensions
Finance ministers from G7 nations are meeting in Banff, Alberta, focusing on restoring global stability and growth. Discussions are expected to address excess manufacturing capacity, non-market economic practices, and financial crimes. Tensions may arise due to recent U.S. tariffs affecting multiple G7 nations.
🛢️ Oil Prices Rise on Geopolitical Concerns
Oil prices increased over 1% following reports that Israel may be preparing a military strike on Iranian nuclear facilities. Such actions could disrupt Middle East oil supplies, particularly if Iran blocks the Strait of Hormuz, a vital passage for crude exports.
📈 Retail Earnings in Focus
Major retailers, including Lowe's ( NYSE:LOW ), Target ( NYSE:TGT ), and TJX Companies ( NYSE:TJX ), are set to report earnings today. Investors will be closely monitoring these reports for insights into consumer spending patterns amid ongoing economic uncertainties.
📊 Key Data Releases 📊
📅 Wednesday, May 21:
10:00 AM ET: State Employment and Unemployment (Monthly) for April 2025
10:30 AM ET: EIA Crude Oil Inventory Report
⚠️ Disclaimer:
This information is for educational and informational purposes only and should not be construed as financial advice. Always consult a licensed financial advisor before making investment decisions.
📌 #trading #stockmarket #economy #news #trendtao #charting #technicalanalysis

Deep Dive into Internet Capital Markets (ICM) - New Narrative Revolution or Speculation?
Internet Capital Markets (ICM) is an emerging concept in crypto, allowing developers and startups to raise capital directly from communities via blockchain and social platforms like X (formerly Twitter). ICM tokenizes ideas, apps, and projects, bypassing traditional intermediaries such as venture capitalists.
Key Concepts & Mechanisms of ICM
ICM is founded on decentralization and social dynamics:
Tokenization & Democratized Capital:
Any user can launch a token representing their idea using platforms like Believe.app, simply by posting on social media with specific tags (e.g., "$TICKER + project name"). This dramatically simplifies fundraising, reducing barriers and costs.
Bonding Curve Pricing:
Initial liquidity and token pricing are set automatically through a bonding curve mechanism, increasing token prices as demand grows.
Trading on DEX:
Tokens typically move to decentralized exchanges (e.g., Meteora) once achieving market caps around $100,000, boosting liquidity and investor accessibility.
By May 2025, over 9,000 tokens have launched, total market capitalization surpassed $350M, with trading volumes reaching $411.6M.
Market Leaders & Success Stories
Believe app:
Dominant ICM platform, with over 3,192 tokens launched and 107,078 traders.
$LAUNCHCOIN:
Native token of Believe app, achieving $250M market cap and 18% growth in 24 hours.
Other notable projects:
$DUPE: Aggregator for product analogues ($63M market cap)
$NOODLE: Crypto analogue of popular game agar.io ($3.1M market cap)
$GOONC, $BUDDY: Highly volatile, speculative tokens popular among traders.
Driving Factors Behind ICM’s Popularity
ICM’s rapid growth is fueled by:
Investment Democratization:
Eliminating geographical and financial barriers.
Speculative Potential:
Opportunities for substantial profits (up to 50,000% ROI in 24 hours).
Social Mechanics & Simplicity:
Viral growth via platforms like X (Twitter).
Solana's Technological Edge:
Low transaction fees ($0.00025) and high transaction speeds (up to 65,000 TPS).
ICM Prospects: Optimism vs Risks
Optimists foresee a revolutionary expansion of capital access, driving Web3 and dApp innovations. Pessimists, however, highlight risks:
Extreme Volatility:
Tokens like $NOODLE dropped 61% in 24 hours.
Regulatory Uncertainty:
Lack of clear regulations, especially in the US, poses significant startup risks.
Speculative Nature:
Critics label ICM as "meme coins under a new name," noting limited intrinsic value in many projects.
Long-term success hinges on sustainable projects emerging and clarity on regulatory frameworks.
Impact on Real World Assets (RWA)
ICM holds potential for reshaping tokenized real-world assets (e.g., real estate, bonds, art):
Positive Impacts:
Lower entry barriers, increased liquidity, and new tokenization models for intellectual property or future revenues.
Current Limitations:
Technological and regulatory constraints currently limit integration of complex RWAs with ICM.
Future Potential:
Over the next 3-5 years, integration could strengthen significantly, contingent upon regulatory clarity.
How to Profit from the ICM Trend?
Key earning strategies include:
Token Creation & Sales:
Launching tokens on platforms like Believe.app, earning up to 50% in trading fees.
Early-stage Investing:
Buying tokens pre-DEX launch, offering high-risk/high-reward potential.
Short-term Trading:
Exploiting token volatility on DEXs for rapid profits.
Participating in Airdrops:
Obtaining free tokens from emerging projects.
Infrastructure Development:
Building analytical tools and integrated wallets, attracting venture funding or tokenization.
Diversification, monitoring social engagement, and avoiding questionable projects are essential risk mitigation strategies.
Future Challenges & Opportunities
ICM faces notable challenges:
Regulation:
Uncertainty and potential legal sanctions remain significant risks.
Market Volatility:
Requires sophisticated analysis and cautious strategies.
Integration with AI:
Leveraging artificial intelligence for trading optimization and market analytics can offer substantial competitive advantages.
Navigating the landscape requires balancing innovation and regulatory compliance for sustainable growth.
Conclusion
Internet Capital Markets represents a revolutionary approach to capital formation, transforming traditional fundraising. Despite impressive growth and potential, careful navigation is needed due to high volatility and regulatory uncertainties. Platforms like Believe.app demonstrate model viability, yet long-term success will depend on achieving a balance between meaningful project value and clear regulatory frameworks.
ICM uniquely blends innovation and speculation. Time will tell whether it becomes foundational within the financial ecosystem or simply another speculative crypto bubble.
Best regards EXCAVO

$3's to $7's catching easiest vertical part of the chart $SYTAGot to let the stock evolve properly, once enough of shortsellers are trapped inside they can only try to manipulate with crash attempts and when even those don't work out they're forced to cover (buy to exit their short position) into vertical push, and those amounts cannot be just clicked out in a second, it takes time to scale in and it takes time to scale out. The only problem is when it's in a bullish uptrend it gets faster and wilder.
Sent out Buy Alert for $3.80 buy expecting vertical and we got it! NASDAQ:SYTA

Nightly $SPY / $SPX Scenarios for May 20, 2025🔮 Nightly AMEX:SPY / SP:SPX Scenarios for May 20, 2025 🔮
🌍 Market-Moving News 🌍
📉 Bear Market Concerns Emerge
Veteran investor David Kotok warns of a potential bear market, projecting that tariffs could reduce S&P 500 earnings per share from $260 to $230 over the next year. This outlook suggests a possible decline of the index to the 4,000–4,400 range, with elevated Treasury yields further pressuring valuations.
🚢 Retail Inventory Challenges Amid Tariff Uncertainty
The Port of Los Angeles reports potential lower inventories for retailers due to ongoing U.S.-China tariff uncertainties. Despite a temporary 90-day tariff reduction, complexities in forecasting cargo volumes persist, potentially leading to fewer product choices and rising prices for consumers.
🛍️ Retail Earnings Spotlight
Major retailers, including Home Depot ( NYSE:HD ), are set to report earnings today. Investors will closely monitor these reports for insights into consumer spending patterns amid economic uncertainties.
💬 Federal Reserve Officials Scheduled to Speak
Federal Reserve officials, including Richmond Fed President Tom Barkin and Boston Fed President Susan Collins, are scheduled to speak today. Their remarks will be scrutinized for indications of future monetary policy directions.
📊 Key Data Releases 📊
📅 Tuesday, May 20:
10:00 AM ET: Labor Force Characteristics of Foreign-born Workers (Annual 2024)
10:00 AM ET: State Job Openings and Labor Turnover for March 2025
⚠️ Disclaimer:
This information is for educational and informational purposes only and should not be construed as financial advice. Always consult a licensed financial advisor before making investment decisions.
📌 #trading #stockmarket #economy #news #trendtao #charting #technicalanalysis

Weekly $SPY / $SPX Scenarios for May 19–23, 2025🔮 Weekly AMEX:SPY / SP:SPX Scenarios for May 19–23, 2025 🔮
🌍 Market-Moving News 🌍
📉 Moody's Downgrades U.S. Credit Rating
Moody's has downgraded the U.S. sovereign credit rating from Aaa to Aa1, citing concerns over rising national debt and interest payment ratios. This move aligns Moody's with previous downgrades by Fitch and S&P Global, potentially impacting investor sentiment and increasing market volatility.
🛍️ Retail Earnings in Focus
Major U.S. retailers, including Home Depot ( NYSE:HD ), Lowe’s ( NYSE:LOW ), Target ( NYSE:TGT ), TJX Companies ( NYSE:TJX ), Ross Stores ( NASDAQ:ROST ), and Ralph Lauren ( NYSE:RL ), are set to report earnings this week. Investors will be closely monitoring these reports for insights into consumer spending patterns amid ongoing tariff concerns.
💬 Federal Reserve Officials Scheduled to Speak
Several Federal Reserve officials, including Governor Michelle Bowman and New York Fed President John Williams, are scheduled to speak this week. Their remarks will be scrutinized for indications of future monetary policy directions, especially in light of recent economic data and market developments.
📊 Key Data Releases 📊
📅 Monday, May 19:
8:30 AM ET: Federal Reserve Bank of Atlanta President Raphael Bostic speaks.
8:45 AM ET: Federal Reserve Vice Chair Philip Jefferson and New York Fed President John Williams speak.
10:00 AM ET: U.S. Leading Economic Indicators for April.
📅 Tuesday, May 20:
8:30 AM ET: Building Permits and Housing Starts for April.
10:00 AM ET: Federal Reserve Bank of Minneapolis President Neel Kashkari speaks.
📅 Wednesday, May 21:
10:00 AM ET: Existing Home Sales for April.
10:30 AM ET: EIA Crude Oil Inventory Report.
📅 Thursday, May 22:
8:30 AM ET: Initial Jobless Claims.
9:45 AM ET: S&P Global Flash U.S. Manufacturing and Services PMI for May.
📅 Friday, May 23:
10:00 AM ET: New Home Sales for April.
⚠️ Disclaimer:
This information is for educational and informational purposes only and should not be construed as financial advice. Always consult a licensed financial advisor before making investment decisions.
📌 #trading #stockmarket #economy #news #trendtao #charting #technicalanalysis

Nightly $SPY / $SPX Scenarios for May 16, 2025🔮 Nightly AMEX:SPY / SP:SPX Scenarios for May 16, 2025 🔮
🌍 Market-Moving News 🌍
📉 Jamie Dimon Warns of Possible Recession
JPMorgan Chase CEO Jamie Dimon cautioned that a U.S. recession remains a real possibility amid ongoing uncertainty from the Trump administration's tariff policies. Speaking at JPMorgan’s Global Markets Conference in Paris, Dimon stated that while he hopes a recession can be avoided, it should not be ruled out.
💵 Stablecoin Legislation May Bolster U.S. Dollar
U.S. policymakers are advancing legislation to regulate dollar-linked stablecoins, aiming to reinforce the strength and global status of the U.S. dollar. The proposed Guiding and Establishing National Innovation for U.S. Stablecoins Act of 2025 (GENIUS Act) seeks to regulate stablecoins and their issuers, potentially anchoring the dollar's influence in the global financial ecosystem.
🏠 The Great Property Sell Fest Begins in India
The Great Property Sell Fest, a first-of-its-kind property festival in the Indian real estate market, is scheduled to take place from May 16 to 18, 2025. The event will be hosted across key locations including Gurugram, Noida, and Panipat, offering a unique platform for homeowners looking to sell their properties at premium prices.
📊 Key Data Releases 📊
📅 Friday, May 16:
8:30 AM ET: U.S. Import and Export Price Indexes for April
⚠️ Disclaimer:
This information is for educational and informational purposes only and should not be construed as financial advice. Always consult a licensed financial advisor before making investment decisions.
📌 #trading #stockmarket #economy #news #trendtao #charting #technicalanalysis

Nightly $SPY / $SPX Scenarios for May 15, 2025 🔮 Nightly AMEX:SPY / SP:SPX Scenarios for May 15, 2025 🔮
🌍 Market-Moving News 🌍
📊 Producer Price Index (PPI) Release Today
The Bureau of Labor Statistics will release the April PPI data at 8:30 AM ET. This report will provide insights into wholesale inflation trends, following the recent Consumer Price Index data that showed inflation easing to a four-year low.
🛍️ Walmart ( NYSE:WMT ) Earnings Report
Walmart is set to release its earnings today, offering a glimpse into consumer spending patterns amid ongoing economic uncertainties. Investors will be watching closely for any indications of how inflation and trade policies are impacting retail performance.
👟 Foot Locker Acquired by JD Sports ( NASDAQ:JD )
JD Sports has officially acquired Foot Locker ( NYSE:FL ) for $1.6 billion ($24 per share). The deal aims to consolidate market share in the sportswear and athletic retail sector, with JD expanding its U.S. footprint. Foot Locker shares surged 67% premarket following the news.
💻 Nvidia ( NASDAQ:NVDA ) Faces AI Export Rule Implementation
The U.S. government's AI Diffusion Rule comes into effect today, potentially restricting Nvidia's chip sales to certain foreign markets. This regulatory change could influence Nvidia's stock performance and has broader implications for the tech sector.
📊 Key Data Releases 📊
📅 Thursday, May 15:
8:30 AM ET: Producer Price Index (PPI) for April
10:00 AM ET: Manufacturing and Trade Inventories and Sales for March
⚠️ Disclaimer:
This information is for educational and informational purposes only and should not be construed as financial advice. Always consult a licensed financial advisor before making investment decisions.
📌 #trading #stockmarket #economy #news #trendtao #charting #technicalanalysis

Nightly $SPY / $SPX Scenarios for May 14, 2025🔮 Nightly AMEX:SPY / SP:SPX Scenarios for May 14, 2025 🔮
🌍 Market-Moving News 🌍
🇺🇸 U.S.-China Tariff Reductions Implemented Today
The U.S. and China are set to enact significant tariff reductions today, lowering U.S. tariffs on Chinese goods from 145% to 30% and China's tariffs on U.S. goods from 125% to 10%. This 90-day agreement aims to ease trade tensions and has already spurred a market rally, with the S&P 500 gaining 3.3% on Monday.
📉 Inflation Hits Four-Year Low
U.S. inflation eased to 2.3% in April, marking a four-year low. This unexpected decline has alleviated concerns about the impact of recent tariffs and may influence the Federal Reserve's monetary policy decisions.
📈 S&P 500 Turns Positive for 2025
The S&P 500 has erased its year-to-date losses, turning positive for 2025. This shift is attributed to easing inflation and the recent U.S.-China trade agreement, which have bolstered investor confidence.
💼 Nasdaq to List New ETFs
The Nasdaq Stock Market will begin listing three new Russell Investments ETFs today, expanding investment options for market participants.
📊 Key Data Releases 📊
📅 Wednesday, May 14:
5:15 AM ET: Speech by Fed Governor Christopher Waller
10:00 AM ET: Business Formation Statistics for April
⚠️ Disclaimer:
This information is for educational and informational purposes only and should not be construed as financial advice. Always consult a licensed financial advisor before making investment decisions.
📌 #trading #stockmarket #economy #news #trendtao #charting #technicalanalysis

US500 - Let the Bulls Strive!Hello TradingView Family / Fellow Traders. This is Richard, also known as theSignalyst.
📈US500 has been overall bullish trading within the rising channel marked in red.
Moreover, the blue zone is a strong support and structure!
🏹 Thus, the highlighted blue circle is a strong area to look for buy setups as it is the intersection of support and lower red trendline acting as a non-horizontal support.
📚 As per my trading style:
As #US500 approaches the blue circle zone, I will be looking for bullish reversal setups (like a double bottom pattern, trendline break , and so on...)
📚 Always follow your trading plan regarding entry, risk management, and trade management.
Good luck!
All Strategies Are Good; If Managed Properly!
~Rich
Disclosure: I am part of Trade Nation's Influencer program and receive a monthly fee for using their TradingView charts in my analysis.

Nightly $SPY / $SPX Scenarios for May 13, 2025🔮 Nightly AMEX:SPY / SP:SPX Scenarios for May 13, 2025 🔮
🌍 Market-Moving News 🌍
🇺🇸 CPI Data Release Anticipated
The Bureau of Labor Statistics is set to release the April Consumer Price Index (CPI) data today at 8:30 AM ET. Economists forecast a 0.3% month-over-month increase, following a 0.1% decline in March. Year-over-year, CPI is expected to remain at 2.4%, with core CPI holding steady at 2.8% .
🤝 U.S.-China Trade Truce Boosts Markets
Markets rallied on Monday after the U.S. and China agreed to reduce tariffs for 90 days, easing trade tensions. The Dow Jones Industrial Average surged 1,160 points (2.8%), the S&P 500 rose 3.3%, and the Nasdaq gained 4.4%. Major tech stocks like Amazon ( NASDAQ:AMZN ), Apple ( NASDAQ:AAPL ), Nvidia ( NASDAQ:NVDA ), and Tesla ( NASDAQ:TSLA ) saw significant gains .
📈 Coinbase to Join S&P 500
Coinbase Global Inc. ( NASDAQ:COIN ) will be added to the S&P 500 index on May 19, replacing Discover Financial Services. The announcement led to an 11% surge in Coinbase shares during after-hours trading .
💎 Sotheby's to Auction $20M Blue Diamond
Sotheby's Geneva is set to auction the "Mediterranean Blue Diamond," a rare 10-carat gem valued at $20 million, today. The auction has garnered significant global interest from collectors and investors .
📊 Key Data Releases 📊
📅 Tuesday, May 13:
8:30 AM ET: Consumer Price Index (CPI) for April
8:30 AM ET: Core CPI for April
4:30 PM ET: API Weekly Crude Oil Stock Report
⚠️ Disclaimer:
This information is for educational and informational purposes only and should not be construed as financial advice. Always consult a licensed financial advisor before making investment decisions.
📌 #trading #stockmarket #economy #news #trendtao #charting #technicalanalysis
Wyckoff Cycle - Practical Example (SUI)Dear TradingView community and fellow traders,
I am Richard, also known as theSignalyst.
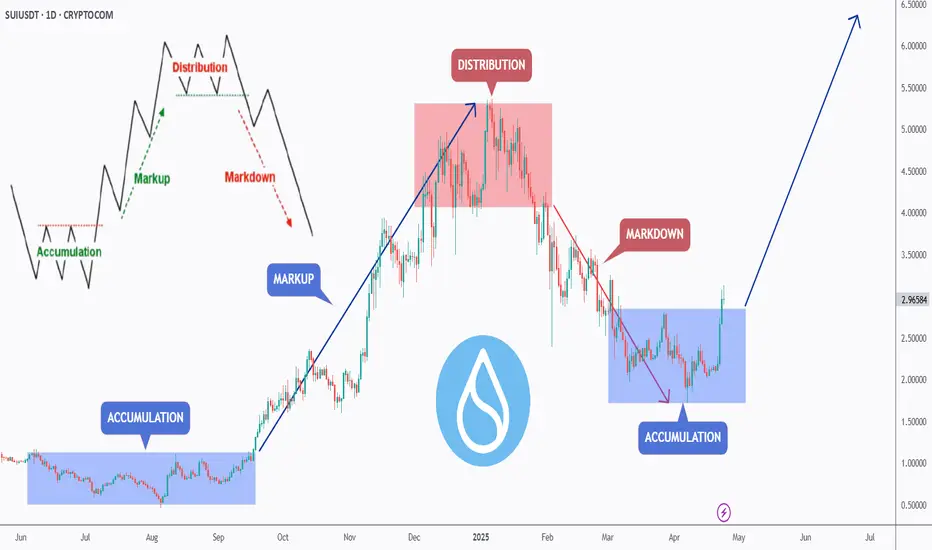
I find the SUI daily chart to be intriguing as it appears to be following the famous Wyckoff Cycle.
I would like to apply Richard Wyckoff's four market stages/phases to this chart for analysis as a practical example.
1️⃣ Accumulation
SUI rejected the $0.50 round number and entered an accumulation phase, consolidating for several months.
2️⃣ MarkUp
After breaking above the accumulation range at $1, SUI kicked off the markup phase.
3️⃣ Distribution
SUI found resistance at the $5.50 round number, with the lower bound of its range near $4—forming a wide distribution phase.
4️⃣ MarkDown
Once SUI broke below the $4 major low and exited the distribution zone, it transitioned into the markdown phase.
🔄🔄🔄🔄🔄⬇️
1️⃣ Accumulation
After finding support around the $2 round number, SUI hovered within a range, forming another accumulation phase.
2️⃣ MarkUp
We're here 🙂 This week, SUI broke above the $2.80 major high and the accumulation range—signaling the beginning of a new markup phase.
❓ What's next?
Will SUI continue to trade higher from here, or will this cycle play out differently?
I hope you find this post useful, and I would appreciate your likes and support.
Which scenario do you think is more likely to happen first? and why?
📚 Always follow your trading plan regarding entry, risk management, and trade management.
Good luck!
All Strategies Are Good; If Managed Properly!
~Richard
Weekly $SPY / $SPX Scenarios for May 12–16, 2025 🔮 Weekly AMEX:SPY / SP:SPX Scenarios for May 12–16, 2025 🔮
🌍 Market-Moving News 🌍
📊 Inflation and Retail Sales Data in Focus
Investors are closely watching this week's release of the Consumer Price Index (CPI) on Tuesday and Retail Sales data on Thursday. These reports will provide insight into inflation trends and consumer spending amid ongoing tariff concerns.
🤝 U.S.-China Trade Talks Resume
High-level trade discussions between the U.S. and China are set to continue this week in Switzerland. The outcome of these talks could significantly impact global markets and investor sentiment.
💼 Key Corporate Earnings Reports
Major companies including Walmart ( NYSE:WMT ), Cisco ( NASDAQ:CSCO ), Applied Materials ( NASDAQ:AMAT ), and Take-Two Interactive ( NASDAQ:TTWO ) are scheduled to report earnings this week. These reports will offer insights into consumer behavior and the tech sector's performance.
🏦 Federal Reserve Speeches
Federal Reserve Chair Jerome Powell is scheduled to speak on Thursday, with other Fed officials also making appearances throughout the week. Their comments will be analyzed for indications of future monetary policy directions.
📊 Key Data Releases 📊
📅 Monday, May 12:
No major economic data scheduled.
📅 Tuesday, May 13:
8:30 AM ET: Consumer Price Index (CPI) for April
📅 Wednesday, May 14:
10:30 AM ET: EIA Crude Oil Inventory Report
📅 Thursday, May 15:
8:30 AM ET: Retail Sales for April
8:30 AM ET: Producer Price Index (PPI) for April
8:30 AM ET: Initial Jobless Claims
9:15 AM ET: Industrial Production and Capacity Utilization
10:00 AM ET: Business Inventories
2:00 PM ET: Federal Reserve Chair Jerome Powell speaks
📅 Friday, May 16:
8:30 AM ET: Housing Starts and Building Permits for April
10:00 AM ET: University of Michigan Consumer Sentiment Index (Preliminary) for May
S&P Global
⚠️ Disclaimer:
This information is for educational and informational purposes only and should not be construed as financial advice. Always consult a licensed financial advisor before making investment decisions.
📌 #trading #stockmarket #economy #news #trendtao #charting #technicalanalysis
CRYPTO ALT COIN GEM HUNTING!I hope you guys enjoyed the video! Feel free to comment down below other Alt coins that you are buying!

Nightly $SPY / $SPX Scenarios for May 9, 2025 🔮 Nightly AMEX:SPY / SP:SPX Scenarios for May 9, 2025 🔮
🌍 Market-Moving News 🌍
🚢 Maersk Adjusts Outlook Amid U.S.-China Trade Tensions
Global shipping giant Maersk reported better-than-expected Q1 profits but lowered its forecast for global container volume growth, citing uncertainties from the ongoing U.S.-China trade war. CEO Vincent Clerc highlighted that while U.S.-China shipping volumes have declined, the rest of the world remains stable.
🇺🇸 Fed Officials to Speak Post-Meeting
Following the Federal Reserve's decision to maintain interest rates, eight Fed officials are scheduled to make public appearances today. Investors will be keenly observing their remarks for insights into future monetary policy directions.
📈 Markets React to Trade Developments
U.S. markets closed higher yesterday, with the Dow gaining 250 points, as investors responded to President Trump's encouragement to 'buy stocks now' amidst ongoing trade negotiations.
🛠️ U.S.-U.K. Trade Deal Finalized
The U.S. and the U.K. have agreed on a trade deal involving reduced tariffs and adjustments to digital services taxes. This development is expected to influence sectors ranging from automotive to digital services.
📊 Key Data Releases 📊
📅 Friday, May 9:
3:00 PM ET: Consumer Credit (March)
⚠️ Disclaimer:
This information is for educational and informational purposes only and should not be construed as financial advice. Always consult a licensed financial advisor before making investment decisions.
📌 #trading #stockmarket #economy #news #trendtao #charting #technicalanalysis
Nightly $SPY / $SPX Scenarios for May 8, 2025🔮 Nightly AMEX:SPY / SP:SPX Scenarios for May 8, 2025 🔮
🌍 Market-Moving News 🌍
🇺🇸 Fed Holds Rates Steady Amid Economic Uncertainty
The Federal Reserve maintained its benchmark interest rate at 4.25%-4.5%, citing concerns over rising inflation and economic risks. Fed Chair Jerome Powell emphasized a cautious approach, indicating no immediate plans for policy changes.
🤝 U.S.-China Trade Talks Scheduled
Treasury Secretary Scott Bessent and chief negotiator Jamieson Greer are set to meet China's economic head He Lifeng in Switzerland, marking a potential step toward resolving trade tensions. The announcement has positively influenced global markets.
📈 Record $500 Billion Share Buyback Plans
U.S. companies have announced a record-breaking $500 billion in share buybacks, reflecting growing hesitation to make capital investments amid economic uncertainty driven by President Trump's trade policies. Major contributors include Apple ( NASDAQ:AAPL ), Alphabet ( NASDAQ:GOOGL ), and Visa ( NYSE:V ).
⚠️ Recession Warnings from Economists
Former IMF chief economist Ken Rogoff warns that a U.S. recession is likely this summer, primarily driven by President Donald Trump's aggressive tariff policies. He suggests that markets are overly optimistic and not adequately accounting for the risks.
📊 Key Data Releases 📊
📅 Thursday, May 8:
8:30 AM ET: Initial Jobless Claims
8:30 AM ET: Continuing Jobless Claims
8:30 AM ET: Nonfarm Productivity (Q1 Preliminary)
8:30 AM ET: Unit Labor Costs (Q1 Preliminary)
10:00 AM ET: Wholesale Inventories (March Final)
10:30 AM ET: Natural Gas Storage
⚠️ Disclaimer:
This information is for educational and informational purposes only and should not be construed as financial advice. Always consult a licensed financial advisor before making investment decisions.
📌 #trading #stockmarket #economy #news #trendtao #charting #technicalanalysis

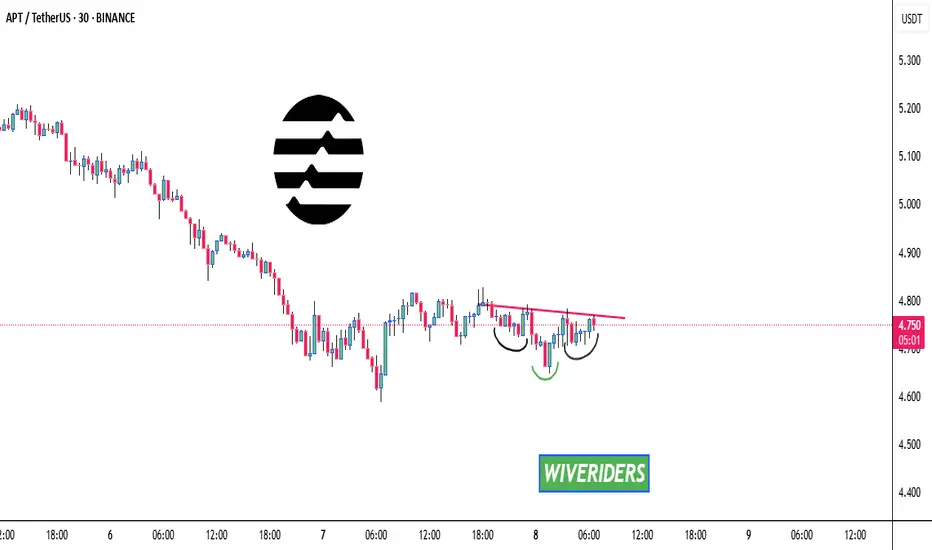
APT Coin Forming an Inverted Bullish Head and Shoulders! 🔥 APT Coin Forming an Inverted Bullish Head and Shoulders! 🚀
APT Coin is currently forming an inverted bullish head and shoulders pattern! 🧠 If the price breaks the red resistance line (neckline), this could trigger a strong bullish move! 📈
Keep an eye on this breakout – it's setting up for some exciting action! 🔥
Let’s catch this move together! 🌊💸
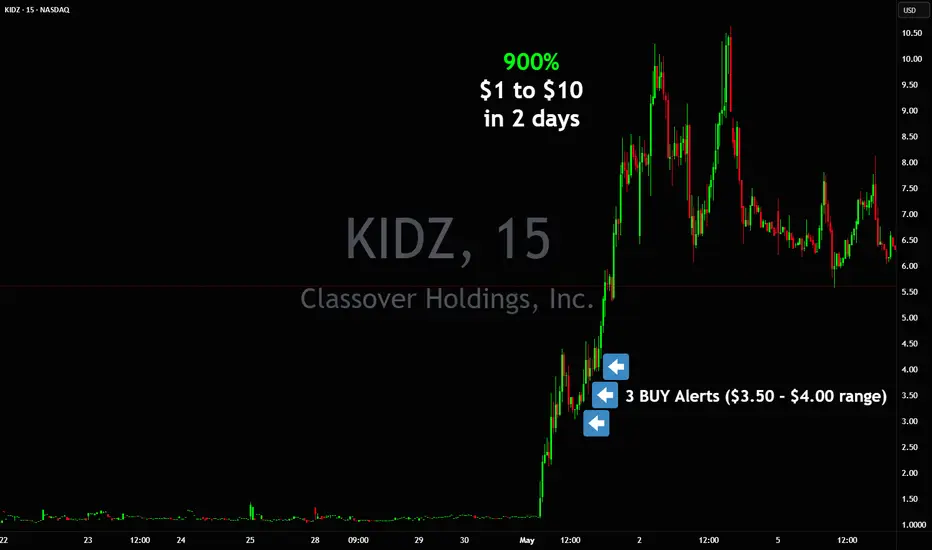
From $1 to $10 doing 900% in 2 days $KIDZ💣💥 $1 to $10+ in 2 days +900% NASDAQ:KIDZ similar to AMEX:GPUS
Shortsellers attempted similar tricks during the day and got squeezed the same way on both 🤣 making us awesome gains along the way
Please 🐻 attempt to do it again on next setups.
3 Buy Alerts in $3.50 - $4.00 range more than enough money made into vertical to $10+
Nightly $SPY / $SPX Scenarios for May 7, 2025🔮 Nightly AMEX:SPY / SP:SPX Scenarios for May 7, 2025 🔮
🌍 Market-Moving News 🌍
🏛️ Fed Decision Day Amid Tariff Pressures
The Federal Reserve concludes its two-day meeting today, with expectations to maintain the benchmark interest rate at 4.25%-4.5%. Despite President Trump's calls for rate cuts, the Fed remains cautious due to inflationary risks from new tariffs and migration policies.
📈 U.S.-China Trade Talks Resume
U.S. stock futures rose overnight on news of upcoming high-level trade talks between the U.S. and China, marking the first discussions since the imposition of 145% tariffs on Chinese goods. Treasury Secretary Scott Bessent and U.S. Trade Representative Jamieson Greer are set to meet with senior Chinese officials later this week.
🛢️ Oil Prices Rebound on Demand Hopes
Oil prices climbed as U.S. production declined and demand in Europe and China showed signs of recovery. Brent crude rose 0.6% to $62.52 per barrel, while U.S. West Texas Intermediate increased 0.74% to $59.53 per barrel.
💼 Key Earnings Reports Ahead
Several major companies, including Uber ( NYSE:UBER ), Disney ( NYSE:DIS ), and Novo Nordisk ( NYSE:NVO ), are scheduled to report earnings today. Investors will be watching these reports for insights into corporate performance amid ongoing economic uncertainties.
📊 Key Data Releases 📊
📅 Wednesday, May 7:
2:00 PM ET: Federal Open Market Committee (FOMC) Meeting Announcement
2:30 PM ET: Fed Chair Jerome Powell Press Conference
3:00 PM ET: Consumer Credit Report (March)
⚠️ Disclaimer:
This information is for educational and informational purposes only and should not be construed as financial advice. Always consult a licensed financial advisor before making investment decisions.
📌 #trading #stockmarket #economy #news #trendtao #charting #technicalanalysis

Nightly $SPY / $SPX Scenarios for May 6, 2025 🔮🔮
🌍 Market-Moving News 🌍
📉 Market Retreats Amid Tariff Concerns
U.S. stock markets declined on May 5, 2025, as investors reacted to potential tariffs and key earnings reports. The S&P 500 dropped 0.6%, and the Nasdaq decreased 0.7%. Notably, Palantir Technologies ( NASDAQ:PLTR ) fell nearly 8% in extended trading despite raising its full-year revenue forecast and exceeding Q1 revenue estimates.
🏛️ Fed Meeting Commences Amid Political Pressure
The Federal Reserve's two-day meeting begins today, with the central bank expected to maintain its benchmark interest rate at 4.25%-4.5%. Despite President Trump's calls for rate cuts, the Fed remains cautious due to inflationary risks from new tariffs and migration policies.
🎬 Entertainment Stocks Under Pressure
Streaming giants Netflix ( NASDAQ:NFLX ) and Disney ( NYSE:DIS ) experienced premarket losses of over 5% and 3%, respectively, following President Trump's proposal of a 100% tariff on foreign-made movies.
🏠 Housing Market Faces Challenges
The U.S. housing market is weakening due to persistent high mortgage rates and economic uncertainty driven by tariff policies. Mortgage rates, currently averaging 6.76%, have deterred both prospective buyers and sellers.
📊 Key Data Releases 📊
📅 Tuesday, May 6:
8:30 AM ET: U.S. International Trade in Goods and Services (March)
⚠️ Disclaimer:
This information is for educational and informational purposes only and should not be construed as financial advice. Always consult a licensed financial advisor before making investment decisions.
📌 #trading #stockmarket #economy #news #trendtao #charting #technicalanalysis

Weekly $SPY / $SPX Scenarios for May 5–9, 2025🔮 Weekly AMEX:SPY / SP:SPX Scenarios for May 5–9, 2025 🔮
🌍 Market-Moving News 🌍
🏦 Fed Holds Rates Amid Political Pressure
The Federal Reserve is expected to maintain its benchmark interest rate at 4.25%-4.5% during its meeting on May 6–7, despite political pressure to lower it. Investors will closely monitor Fed Chair Jerome Powell’s post-decision remarks for insights into future monetary policy directions.
📊 Key Economic Indicators on Tap
This week brings several important economic data releases, including the U.S. trade balance, initial jobless claims, consumer credit, and wholesale inventories. These indicators will provide insights into the health of the economy amid ongoing trade tensions and concerns over consumer confidence.
💼 Corporate Earnings in Focus
Major companies such as Palantir ( NASDAQ:PLTR ), Advanced Micro Devices ( NASDAQ:AMD ), Uber ( NYSE:UBER ), Walt Disney ( NYSE:DIS ), and Ford ( NYSE:F ) are scheduled to report earnings this week. Investors will be watching these reports for signs of how companies are navigating the current economic landscape.
🌐 Global Events and Leadership Changes
Europe is set for significant leadership changes, with Friedrich Merz expected to be confirmed as Germany’s new chancellor. Additionally, the Vatican’s conclave to elect a new pope convenes on Wednesday. These events, along with the 80th anniversary of VE Day, may have broader implications for global markets.
📊 Key Data Releases 📊
📅 Monday, May 5:
9:45 AM ET: S&P Global Composite PMI (April Final)
10:00 AM ET: ISM Non-Manufacturing Index (April)
📅 Tuesday, May 6:
8:30 AM ET: U.S. International Trade in Goods and Services (March)
📅 Wednesday, May 7:
2:00 PM ET: Federal Reserve Interest Rate Decision
2:30 PM ET: Fed Chair Jerome Powell Press Conference
📅 Thursday, May 8:
8:30 AM ET: Initial Jobless Claims
10:00 AM ET: Wholesale Inventories (March)
📅 Friday, May 9:
3:00 PM ET: Consumer Credit (March)
⚠️ Disclaimer:
This information is for educational and informational purposes only and should not be construed as financial advice. Always consult a licensed financial advisor before making investment decisions.
📌 #trading #stockmarket #economy #news #trendtao #charting #technicalanalysis
