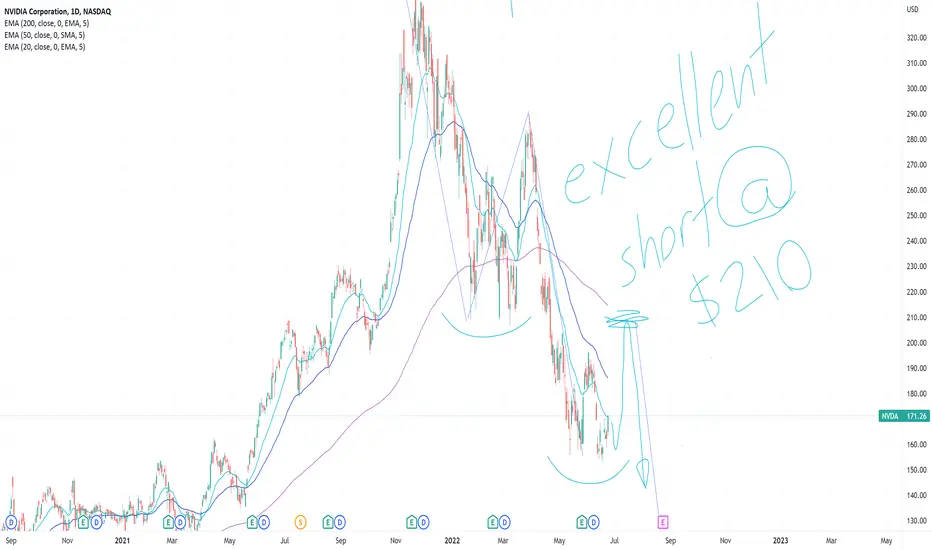
NVDA predictionHey all, I'm noticing many market-moving names are repeating the redistribution patterns they made leading up to the fakeout rallies and subsequent moves lower in March of this year(Namely AAPL , MSFT , AMZN ). I think NVDA is setting up beautifully for a rally higher back near the $210 zone where I fully expect it to reject and breach new lows in a violent manner. Considering the cyclical and overvalued nature of NVDA and semiconductors(which are still relatively high up), it would be no surprise to me if it were to see its pre-pandemic values well before year-end.
Disclaimer: I think we're at the end of a market cycle and are currently in a redistribution phase before the market heads to new lows(in the midst of a crash)
Marketcrash
NDX 100 WARNING: ABC wave C may reach 10500 or even 9500Since last week I have been warning that there will be a short oversold rally after FED testimonies in Congress & Senate but the worst is not yet over despite retailers rushing to buy the dip & exchanges trying very hard to keep BTC above the impt 20k in order to prevent mass selling.
NDX Nasdaq 100 has been making a downchannel since it turned down after completing wave B @15265. The most probable support is at 10500, which is a 36% crash from ATH. 10500 (double my yellow box) is also a confluence of the 0.618 retracement from pandemic low to ATH & the weekly wma200 level. If 10500 fails then the pre-pandemic top @9500 will be the maximum pain, which is a 42% drop from ATH of 16764.
After ABC ends, the target levels for take profit will be 12k & 13k respectively indicated by blue arrows.
Not trading advice

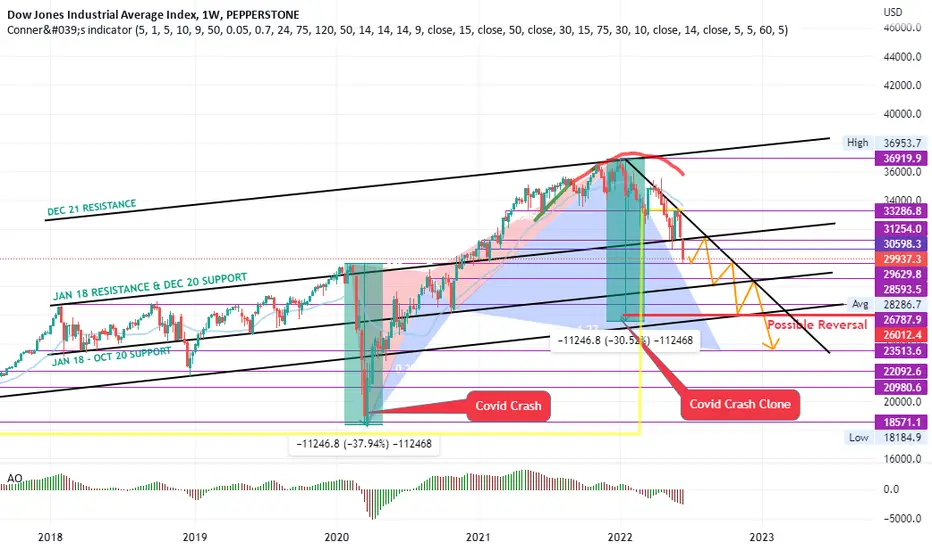
US30 THE DOW 30 CRASH, ONE YEAR LATER UPDATE Last year May we saw a potential crash for the Dow Jones 30 due to inflation fears
and now what we predicted is finally happening.
In our analysis a year ago Dow 30 was trading at 34,644 after reaching highs of 35100
we saw a potential sell signal on the 1W chart which was the formation of a bearish harmonic.
this halted our longs and swings on the Dow.
So what is Fueling the Dows Crash at the moment?
Same thing which was fueling it about a year ago, inflation fears in the US.
US investors have lost their trust in the Fed's ability to control inflation even
with the current 75 basis points interest hike we saw this week during the FOMC on Wednesday
to try and curb inflation, investors believe that the Feds tools have failed. Recent data has shown
that inflation is now at its highest in the last 40 years in the US and analysts have predicted
a decline in US GDP in the next coming years
meaning the US could be facing a recession or is already in one.
WHAT TO EXPECT
Currently @ 29,900
Next support for Dow 30 is 29,500 so we expect it to reach this support level before short term
retracement back to +30,000
Looking at the Covid Crash we expect Dow 30 to fall at least 10,000 points from its highs which were at 36,400 meaning
We expect Dow 30 to reach 26,000 before any reversals,
Our initial target from a year ago was 23,500 and we still think this might be a possibility.
Our positions
Active sell positions @ 31,600 & 31,300 from our last analysis link is attached below
New positions
Sell Limit @ 31,000 TP @ 30,000
Sell Stop @ 29,000 TP @ 28,000
Sell Stop @ 28,000 TP @ 27,000
Buy Stop @ 30,100 TP @ 30,600
Buy limit @ 29,500 TP @ 30,000
Buy limit @ 26,800 TP @ 28,000
Buy limit @ 23,700 TP @ 33,000
Note these are low risk entries
link to previous analysis attached below
Note: this is just an analysis based on technical analysis & current events. All investments involve risk, our analysis and trading strategy does not guarantee future results or returns. Investors are fully responsible for any investment decisions they make.
Bitcoin 4-10k!? Ethereum $100-$500!? What? Holy ****! Really?Traders,
What I am seeing on these charts is shocking! Let's dive in.
- Stew

Another chance to sell AUDCADThe market is in turmoil, but we can still make money as we follow the trend.
AUDCAD is down on every time frame.
We will sell this now based on the pattern and expect a drop of 80 pips.

How we made 7.26% in May with 63% win rate while markets fell Last month when markets took a beating, we were able to make 4% within 11 days of trading using trading view to help track our trades.
The month of May was a really volatile month and it took some courage to get back to where we are today. As you can see from our equity curve, we were down about 7% midway through the month and staring down a gun barrel.
teenfxtrader.wordpress.com
Here are some very important lessons that we learnt from our trading from the month of May.
1) Do not get into markets that you don't understand before testing them out thoroughly. - We started getting into indexes and especially the JPN225. What we didn't realize is that this pair moves really fast and can either wipe you out and make you lots of money. We lost 4% on the first trade but made 12% on the next. Still not sure whether we should trade this but if a good opportunity comes up why not? Just keep your positions super small.
2) Risk control is so important even if you are losing - - It is so easy to lose your marbles when you are down 7% in the first 15 days. However we need to accept that losing trades will happen and the only way you can control it is by not risking too much. Your account will ebb and flow. Some weeks are just flat. Sometimes you can have a quarter where you are totally flat and I am sure that will happen for us soon as well.
3) Winning percentages means nothing - We have always been taught in school that you are a loser if you do not get 80% and above. In trading, losing 40% of your trades is still okay as long as you lose with dignity. This month we lost 37% of our trades but yet made 7.26% by holding on to our winners.
Where do we see the market going in June 2022?
The past 2 weeks has been bullish. This is not the end of the market crash unfortunately. It is call a bear rally or a bull trap and we are likely to see the markets being pushed down to the previous lows. We still believe the target for DJIA is 26,000 and the S&P will reach 3600 within the next 3-4 months. In the meantime, we plan to take small trades to help us grow our equity as we have done in the last 45 days.
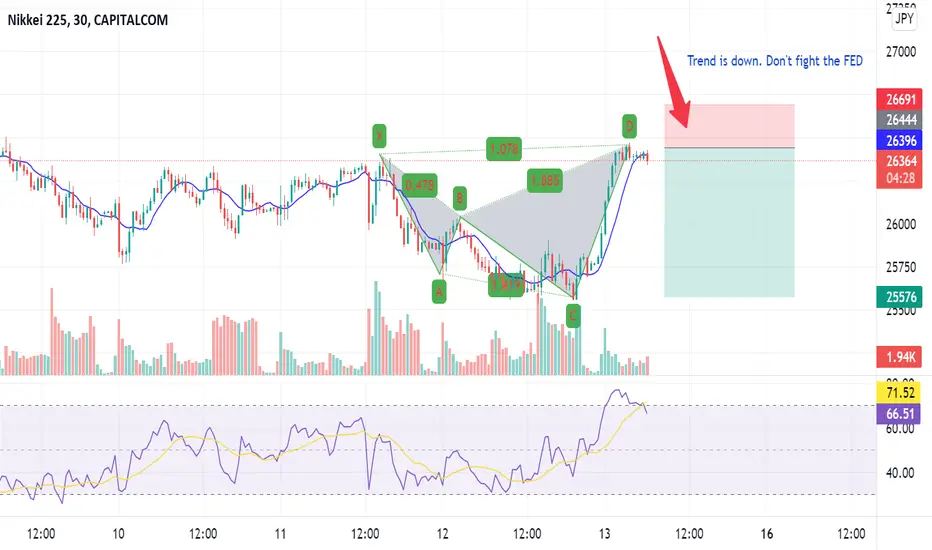
In the meantime, we are looking at a sell of JPN225 at the level marked out but it is an uptrend so we may go long until this price is reached for the sell.
Good luck!

I am selling the NIKKEI (JP225) nowThis is my first trade on NIKKEI and I am scared :)
Well I just follow my rules, so I shouldn't worry.
1) Daily is down
2) H4 is down
3) Nice harmonic pattern setting up
All other indices are showing similar symptoms.
Hope it will be a good one. Stop loss is steep at 200 points but the reward is better.
BULLISH IN 1.15 HOURS FOR BTC!I believe that the reversal will occur around 4 am EST ( MAY 16 ) , and we will see #bitcoin hit 32 800 over the next two days and hover there for a couple of days before dropping to 30 700. After that, we will see breakouts like JASMY, SAND, CRO, NEAR, APE, MANA etc.
I am buying the altcoins listed above. Do your research. I believe we will see a new market cap ranking that will become more solidified with currencies tied to NFTS and other needs of the NFT and gaming communities for blockchain P2E. I believe now is a great time to BUY GMT, KNC, APE and NEAR! THEN HOLD AND WHEN YOU UP 20 - 30 % remember retracements are very lucrative used correctly. Trade responsibly and proactively! BE VIGILANT; THE MARKET NEVER SLEEPS! When you sleep, place a stop loss if you're leveraging
REMEMBER YOU HAVE ONLY YOURSELF TO RELY ON!!! KNOW WHAT YOU ARE DOING!!!!!!
DONT WATCH LUNA GO TO 0 then say you lost everything because of LIUNA, I am sorry for the losses but I lost as well and cut them at the point of 30%. Set up a system and remember the market IS VOLATILE AND NOW PICK UP currencies for half price!
Happy Trading!
- EhBeast
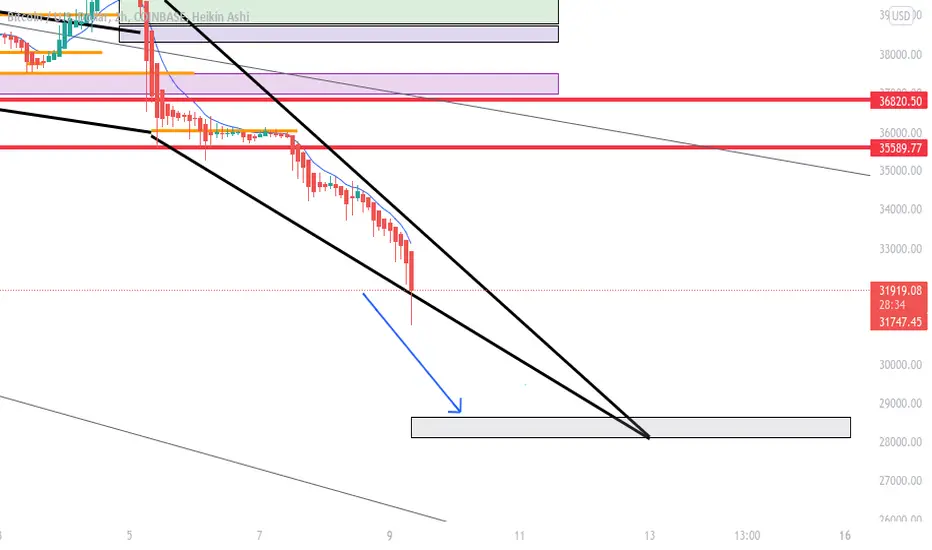
BTC 34-35k Rally, Crash AfterIm speculating that Bitcoin will make a short rally into the 34-35k zone. Once it hits this zone I believe we will see the bears takeover, this wedge setup that is being created backs up my idea. Along with BTC rising to 34-35k, we will see a short increase in SPY, QQQ, AMZN, TSLA, and other major companies. After this short increase I honestly think the market will crash... stocks and crypto. I will be heavily shorting SPY, BTC, and US30 once the market rises towards the zones I have set. BTC: $34k, SPY: $415, QQQ: $315, AMZN: $2700, TSLA: $820. US30: $34k. With inflation increasing and home prices rising, I see a market crash coming... who doesn't lol.

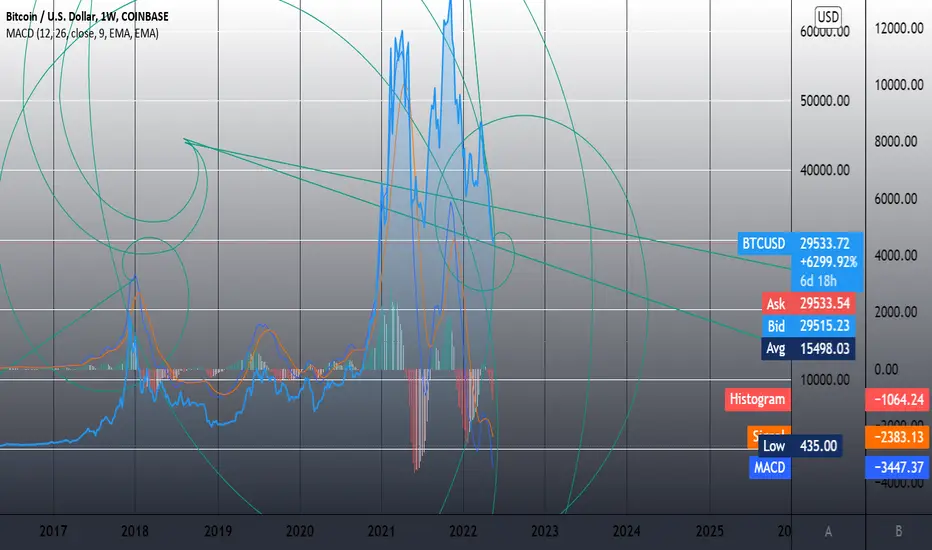
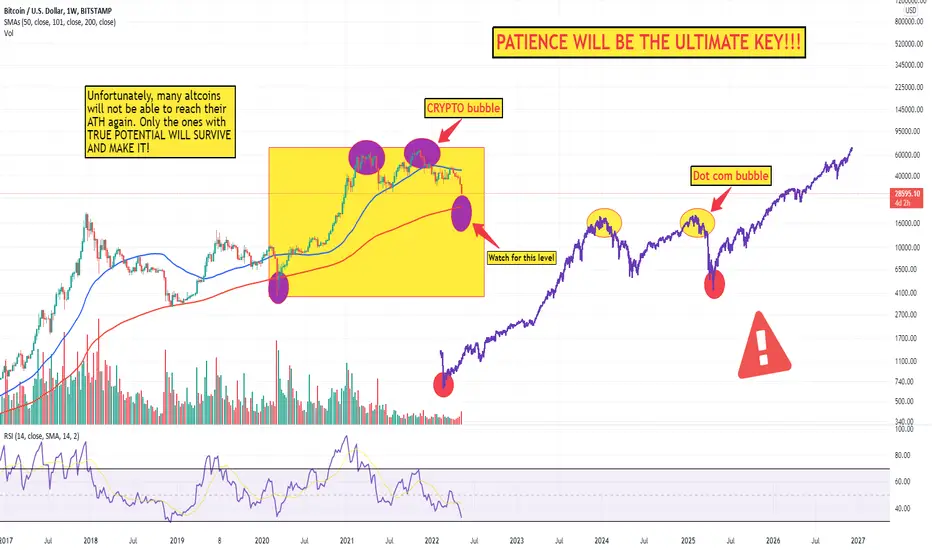
Only Some Will Survive !!!History repeating itself as bitcoin is clearly resembling the patterns from the 2008 dot com bubble. I personally believe that the total crypto market cap will come down to the 500-600 billion range and many Alts will get absolutely reckt!!!
Not a financial advise, not a financial advisor either :))
QQQ PutQQQ has been in a downtrend since the start of April along with SPY, BTC, US30. The market is clearly crashing, I believe QQQ will fall to $285 - $293 zone and create a small rally after. Im looking to pick up QQQ $288 Put Expiring 5/13, the current price of the contract is going for about $245-250. Once QQQ hits my zone I will then look to pick up some short term calls.

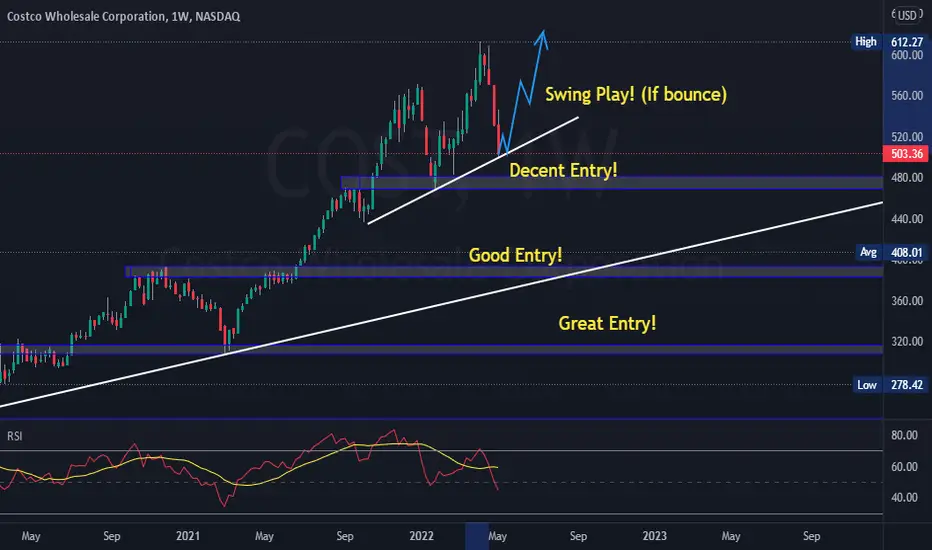
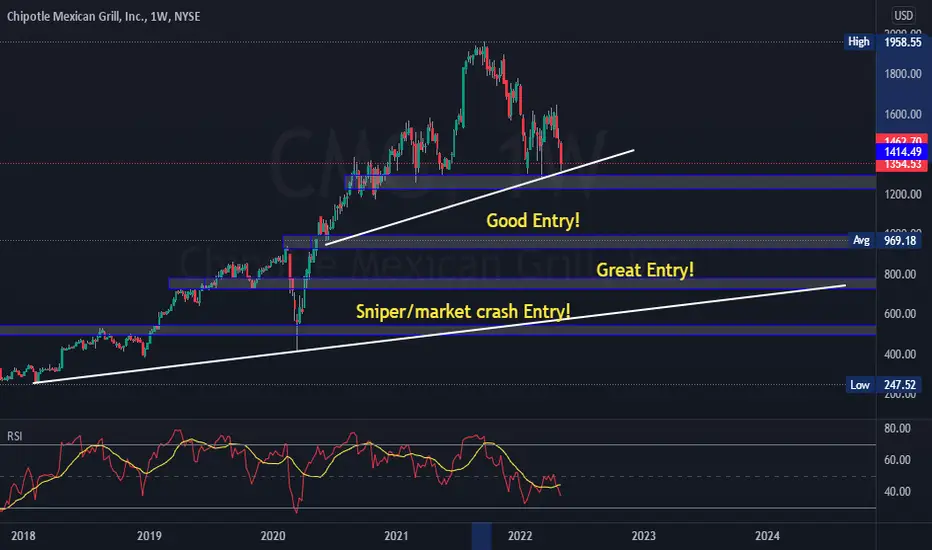
2X 1WK Analysis! (+30% Discount)Chipotle has been performed and managed well over the years! It has discounted more than 30% and in a bear market look to build yor long term portfolio with these areas to buy!
When will S&P500 finish its first correction wave ?!?Hello traders!
I think we are all looking at the indices charts that keeps falling with the effect of the crisis and economy management from the Fed and central banks.
**According to Truflation, the inflation rate is at 11.4% in the USA**
This economic crash is not yet to stop, we will be experiencing crazy time in the incoming month and years...!
BUT ANYWAY , today we are analyzing the S&P500 with the Elliott Waves from the crash of the Covid-19, and what we can see is that:
The 5 of the Impulse Extended Ending Diagonal Wave has been confirmed the 22 Nov '21
- An EED have 5 waves that are subdivided into correction waves 3-3-3-3-3.
- In an expanding diagonal ending, wave 1 is small, wave 3 is medium and Wave 5 is long.
Since then, we are in an ABC pattern that we are about to finish in the incoming week
For me, it is the first Wave of the correction pattern that we are about to be witness in the incoming month and until next year.
Because the worldwide economy is not looking good, in my opinion I would say that we are finishing Wave W of a WXYXZ.
ZOOM IN for a better view of the objectives that have been found for the end of the downtrend (light blue C of the ABC) :
1/// 4000 is strong by being the 100% of the ABC pattern
2/// 3900 is strong by being the 113% of the ABC pattern
3/// 3850/3825 is the strongest by being the 123%/127,2% of the ABC pattern and near the 38.2% of the entire Impulse Wave Retracement
ZOOM OUT for a better view of the overall structure of the S&P500
You can also check my analysis on the NAS100 where the structure is pretty much the same.
.
.
Please feel free to ask question and recommendations in the comment section, I would be more than happy to answer your questions

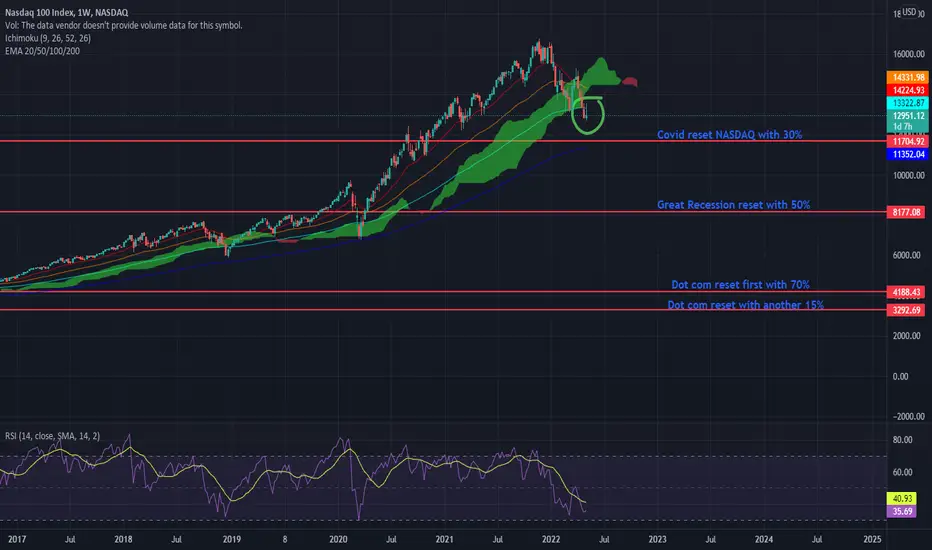
The Great Reset of 2022In the light of a recession with the GDP seeing negative growth in Q1 and a tighter monetary policy from Fed as well as rate hikes from Fed does the high profile growth stocks see a slow down.
The main buyer of these high profile growth stocks is NASDAQ where many of these stocks see a bearish market (e.g. Meta Platforms, Zoom and Netflix) as investors go from high profile growth stocks to safer investments such as commodities and real estate in fear of a recession.
Also consumer spending is lower than before as consumers does not buy multiple streaming services, delivery services or technology in general but instead safe money and keep e.g. dollar instead of stocks and cryptocurrencies.
This negative consumer spending causes these high profile growth stocks to see a slow down in growth as their balance sheets are negative.
NASDAQ may see correction towards the green part of the green cloud but after that a more drastic drop off as the price crossed underneath the green cloud.
To support this claim does the EMA and the RSI are both showing this correction is likely to happen.
In tune with inversion of the yield curve may the NASDAQ see negative movements like it did during the last times this happened in: 2001 and 2007 right before the Dot com bubble and the Great Recession respectively.
USDJPY - The great 1000 pip SHORT coming up USDJPY has been a raging bull and moved up quite quickly. However everything that goes up finds it way down. Here are the reasons the bull run is over.
1) There is a huge harmonic pattern in play now.
2) Monthly, Weekly, Daily RSI are overbought
3) Daily Divergence is in play.
The trade will not happen immediately. We need to observe this for about 2-3 weeks to be sure that there is absolute weakness. Until then, I will continue to go long as the trend is up.
Whenever the JPY strengthens, the Stock market sees huge declines. All the JPY pairs are showing weakness as hinting at a JPY strengthening. We have seen this in AUDJPY, NZDJPY, EURJPY and GBPJPY. CADJPY and CHFJPY are showing weakness now so all stock traders should be wary of "SELL IN MAY AND GO AWAY".
Good luck!

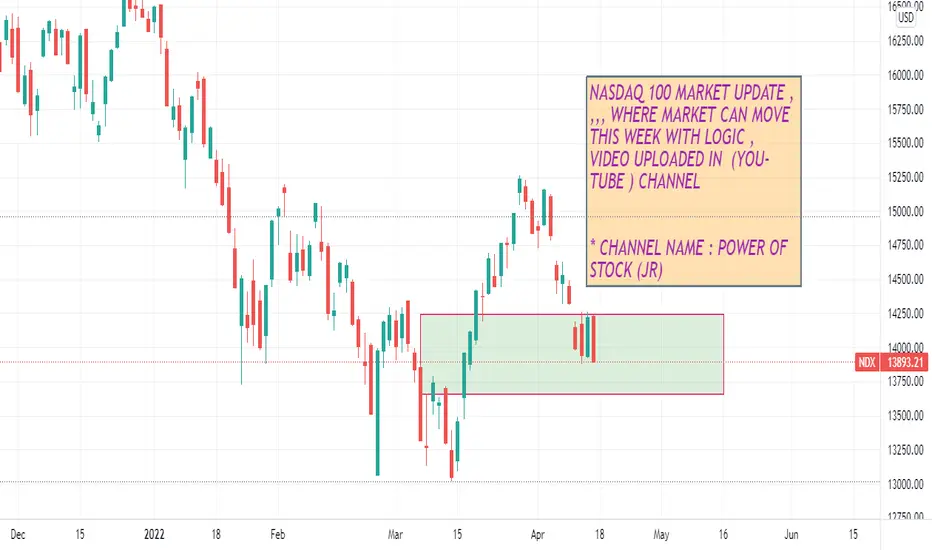
NASDAQ 100 WILL BE CRUSH THIS WEEK??????*market is now selling pressure where market can find bottom lets see what suppose to be happened this week
RUNE/USDT double top playing out The RUNE/USDT has showed a double top pattern on the 4H chart and is likely to play out on the longer time frames.
This follows a likely price drop from 9.29 USDT to 7.38 USDT. A drop in 20%.
This also follows a rejection from the EMA lines and the RSI shows signs of being overbought.
Here has the analysis showed sign of playing out on the daily time frame.
No financial advice.

A Global Serious Recession and Downfall of Stock MarketThroughout the latest 20 years, the difference between US10Y and US02Y bonds is the one legitimate screener on the recessions on the real economy and indicator of bloodbath of the stock markets.
1987, 2000-01, 2008 and latest coronavirus crises are exactly corresponding the bottoms of the chart.
Now, chart sharply falls and I expect an extensive crash on the real economies or in stock market. This might be related with the recession expectations driving from a huge inflationary era that we are about to enter in.
That's why investors should really watch this closely, since the risk is high enough to take into consideration. Again speaking, I would not be surprised if we see a major sell-off in the stock market within 2022.
However, there must be a catalyst in such a scenario, like it happened in mortgage crises or covid-19. It seems like there might be some extreme conflicts between Russia-US-China axis like Putin is going extremely harsh on Ukraine, even speaking or trying to use the nukes. Yet, this is just a highly speculative possibility. The point is there must be a huge political event if we to observe such a sell-off.
Again, investors should watch this closely.
This is not a financial advice.

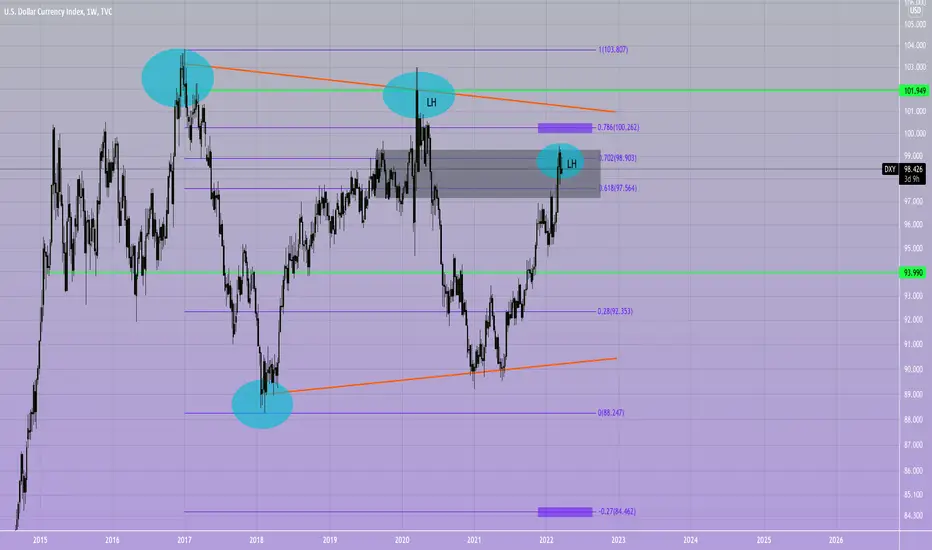
IS DXY AKA DOLLAR ABOUT TO COLLAPSE?Is history about to repeat itself once again.
The dollar has enjoyed a spat of Bullishness since may last year. It seems to be slowing down at present though.
Running into Monthly fibonacci levels at present the .702 is holding. I'd like to see a close below the .618 next to confirm the move to the downside, targeting D extension @ 84.6
Because the market likes round numbers, I wouldn't be surprised to see a final push up towards the .786 aka 100. Technically price can push as high as 102 and still be printing Lower Highs on the weekly and monthly timeframes. This is bearish price action, given the state of the world economy at present. Especially the USD, I can't see the DXY making an impulsive move upwards. This leads me to believe that the local top for DXY is nearly in and with it a bearish couple of months will follow.
On a macro-economic level, what we could see playing out here is essentially the collapse of the US Dollar. It has maintained dominance and world reserve status due to the petrodollar. As the US pushes for sanctions more countries are moving away from the Dollar. One significant move has been the rise of the Petroyuan. China's response to economic warfare committed by the US. Once this is fully established demand for the Dollar will not only go down, it will collapse. Not to mention the US currently has inflation at around 8% whilst China is sitting pretty at around 0.9%.
There is a clear winner here and it is not the dollar. So either a miracle happens or we are about to witness a new world order. Time will tell, either way what we're witnessing is a massive shift in the global powers. The USA is on its last legs and they seem to be digging an even bigger hole than the one they're already in.
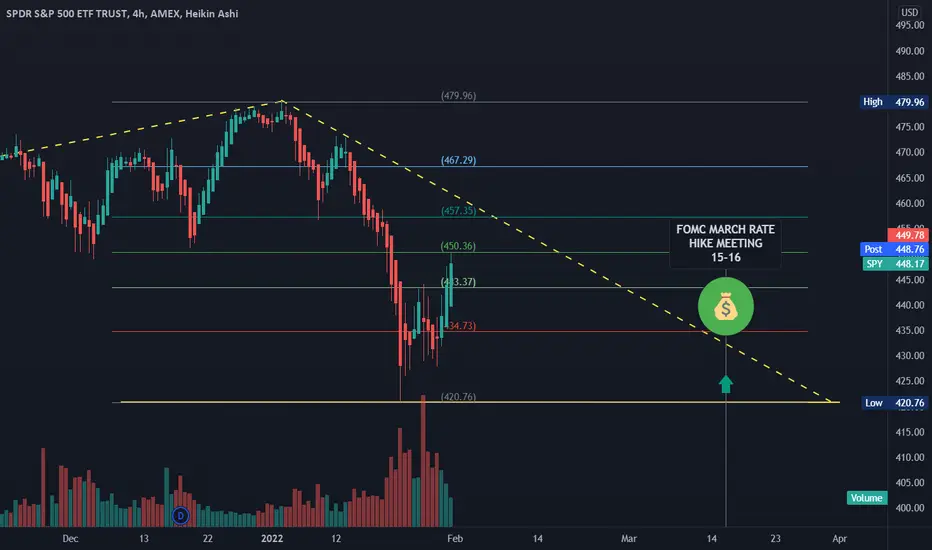
SPY COULD FORM A MACRO WEDGE - INTEREST RATESGet your tin foil hats ready for this one folks. It's a long shot, but just throwing this perspective out there to see how it lands in a few weeks.
SPY loves to form wedges, especially after the breakout of other patterns.
In this case, SPY was forming quite the strong channel since September, until it broke out in January (see chart below)
Now that it has broken out, and volatility is at its highest, one potential outcome is SPY / SPX forming a wedge to calm the storm.
Here is where it gets interesting - charts also love symmetry. The price action on one side of a pattern often times matches the price action on the opposite side as well (time is a factor that affects how this looks on the chart, either squeezing or elongating the trends)
Before SPY dumped in January, it had a stair stepping, wedge-like pattern on it's way up - which took 200 days to reach ATH from $415 (a key level). SEE BELOW
Now here is where the tinfoil hat comes on. So far, SPY has mimicked the double bottom formation first seen on the left side. SEE BELOW
Notice both form a 'W' shape, with the left side having less volatility, and therefore having more time to form price action (30 days)
The right side having more volatility, formed a similar pattern in 10 days. 1/3 of the time
This would make sense if we also look at the volume, which is on average 2.4x higher than last September / October.
Following this same logic, we should reach 415 in approximately 1/3 the time it took for SPY to reach ATH from 415 (200 days mentioned previously.)
That means it would take ROUGHLY 66 days to reach 415 from ATH -- March 11 -- The Friday before the first released rate hike and when the FED will release their interest rate plans. This would put the March 15 - 16 FOMC meeting right at the vertex of this wedge.
The MACD also confirms this in a way. If SPY continues its current MACD trend on the Monthly, it should approach baseline in March, flipping red (Take a look at SPY chart, and what happens when the monthly MACD flips red without a catalyst like the FED meeting.)
It also means we could see a more volatile spike to around 460 in the very short term (first week of February or so) and then a trend down from there.
What are some problems with this perspective? It's based entirely off of connecting dots that may not even be there. Also, with all of the news and volatility happening right now, SPY could do something completely un-organized and un-predictable, but it doesn't hurt to try.
This post was written largely for fun, and I'll keep the analysis in the back of my mind. However, I do not plan on basing any of my strategies or trades on the idea alone.
Let's see how poorly this ages ;)
- Thanks for reading!