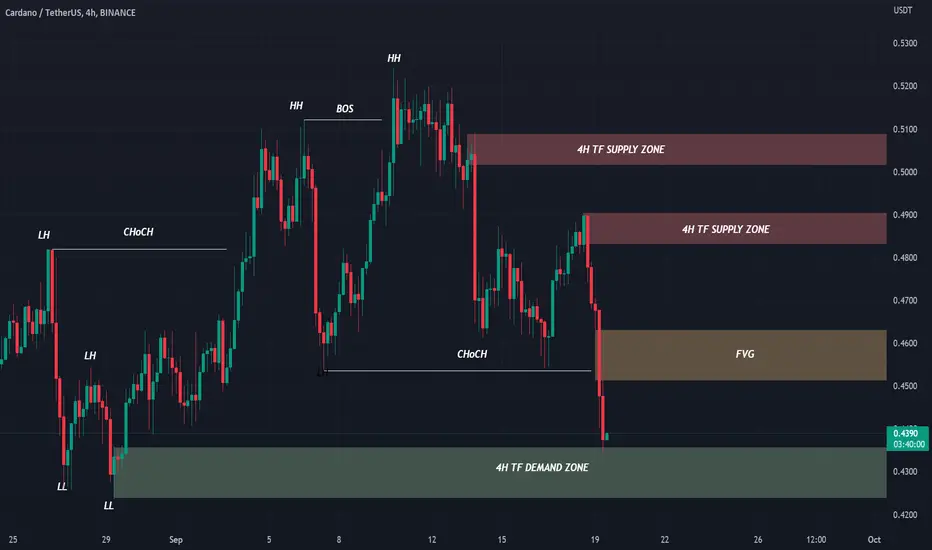
ADAUSDT 4H Fundamentals/News:
almost all financial markets are waiting for Fed interest rate decision this week.
Estimated the rate will rise in a range between 0.75-1
most staying out of the market and wait for clear direction.
Technical:
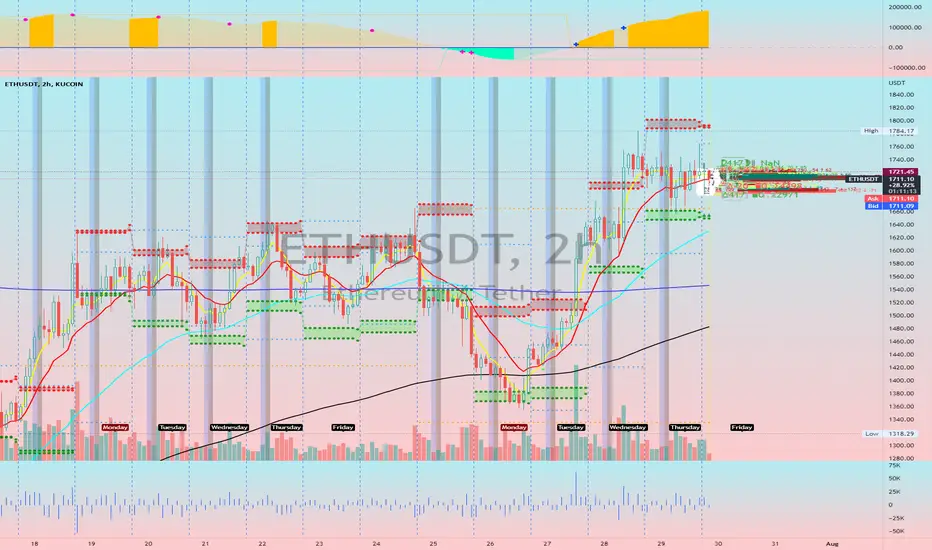
Presently, the price has reached the position of the previous 4-hour demand zone (0.4240-0.436) and temporarily stopped falling
But there is still no clear signal
Entry signal
do long "only if" when the LTF is in the demand zone (0.4240-0.436),
and return to HL-HH constructure,
or K bar appears as a clear signal
First TP: 0.451
Second TP: 0.463
Third TP: 0.483
SL is the lower edge of the demand zone at 0.424
All are personal opinion, not investment advice.
Any suggestions and feedback are welcome!
Marketmaker
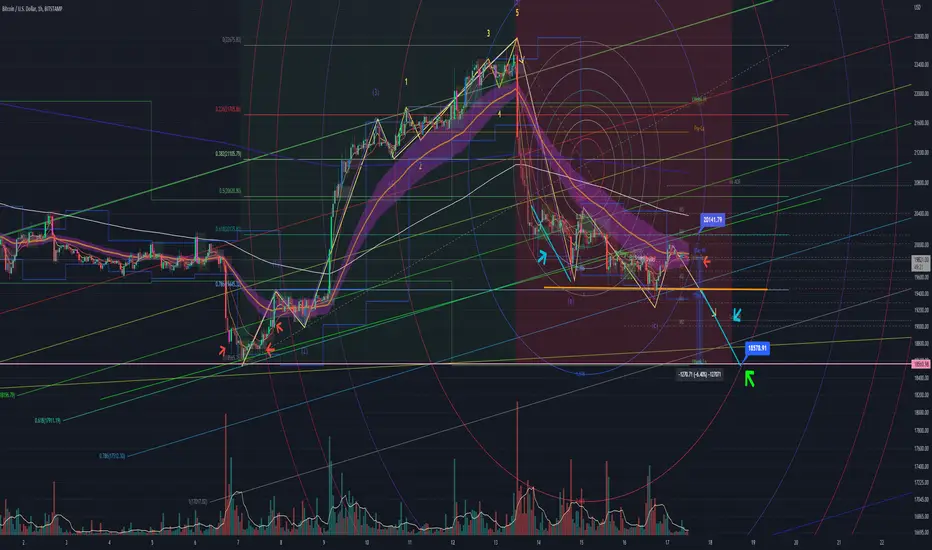
BTC USDT ELLIOT WAVE , Market Maker , Pattern AnalysisBTC USD.
I was going through the charts and found a pattern that could play out... Of course, everything here is definitely NFA.
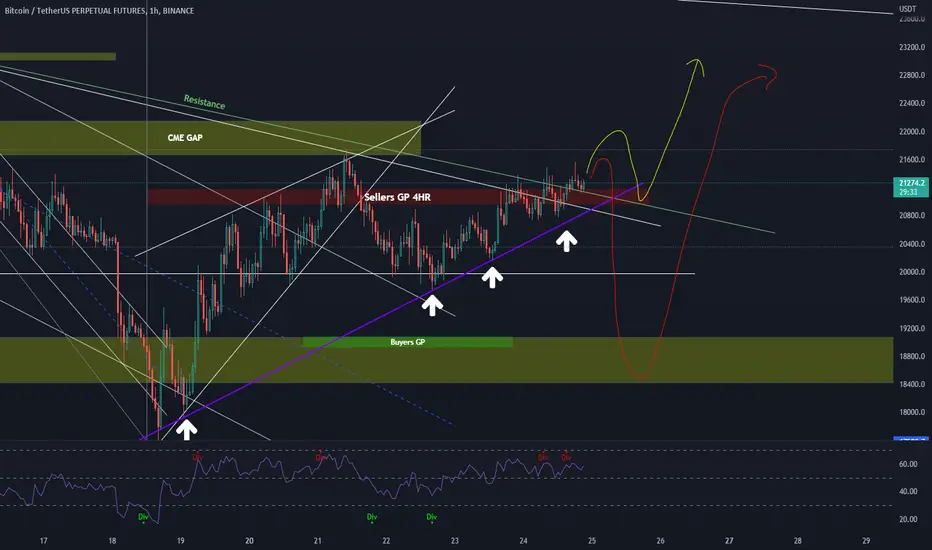
This is a 1H BTC chart.
This anlysis combines Elliot Waves, Market Maker strategy along with some basic technical analysis .
The green background showing were done with the first 5 waves and on the red background part price is currently sitting on the beginning of the last third leg.
I use channels for S/R , and fib circles for timing the moves. I think if we might see a move when we cross the circle, or close to it and since the wave cannot be considered if the price breaks the previous higher high, and we have already seen previous waves develop, i have to assume the pattern is valid, and we may see 20141 as highest it can go.... for now.. maybe.
Ill add some more confluence...The chart also has 3 vector candles that need to be recovered marked by the red arrows on the chart .. which gives it an even higher probability of the drop.
The pink line and the green arrow is showing where we could see the last point where it could bounce from, before heading down..
The Cyan line represents the measured move we could see in the next leg.... which also adds to the confluence of this idea...
There also an alternate version of the chart, which expands the fib circle a little more just in case the price lingers on a bit, but i would still expect a move right around where the next ring crossing is.
Comments and Thoughts are welcome..
US 100 LONG hello traders
There is a demand area that is overtaken by the price. The price is expected to rise above the area to execute unexecuted buy orders
There is an important support and resistance area
Accumulation occurs above the support and resistance level and below the consumed demand area
If the price breaks the consuming demand zone, I think it will be a buying opportunity to target supply zones

USDCAD sniper entries with Derlsony from TANZANIA. Follow me for more trade setups with 85% to 95% accuracy for training and mentorship

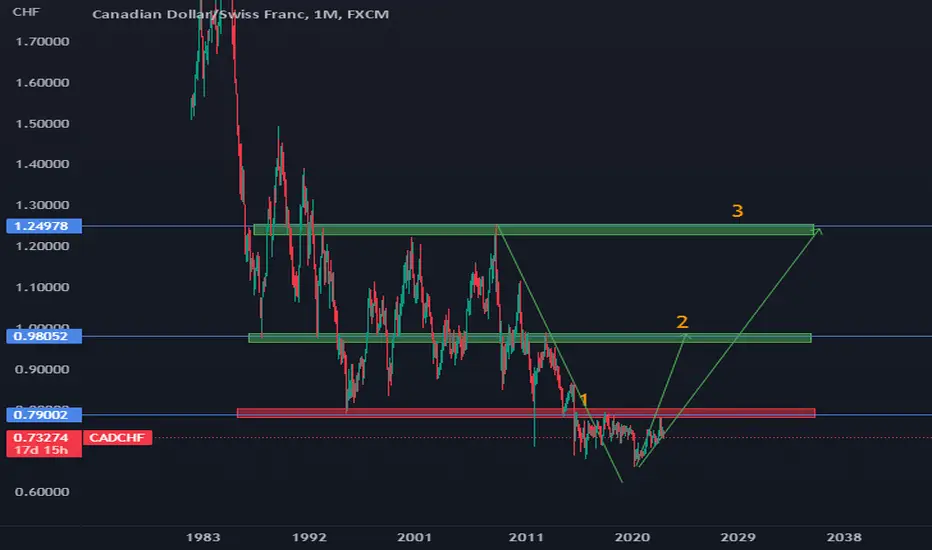
Lesson 1: The Market-Maker's GameLet's look at how market-makers succeed in trapping you and I in the market to make billions. These techniques, when grasped, can have an immense positive influence in your trading. Market-Makers use areas of support and resistance to accumulate/distribute order blocks. This creates massive liquidity for them to be able extract big profits, leaving the ordinary retail trader holding an empty bag.
----------------------------------------------------------------------------------------------------------------------------------
1. Support was broken at the 0.79000 zone. They break support zones like this to trap all the SELLERS. those who placed STOP LOSSES at 0.77400 anticipating price to go down are kicked out of the market before price starts to climb higher and higher. This is the biggest reason why traders wonder why the market kicks them out before it moves in their desired direction. It's as if someone is watching your trades. Well, market-maker can see where most STOP LOSS orders are placed. They push the price to those levels to wipe traders' positions.
2. The maker-maker's intention is to take the price up without being too transparent. Their intention is to make you believe that price is headed downwards when in fact it's going up. Their first target in this case is the 0.98000 zone. When price gets to that zone both BUYERS and SELLERS will be shaken off the market so that they can take the price up some more to the 1.2500 zone (3).
3. At 1.25000 more manipulation will take place. At that price level a lot of amateur retail traders will be thinking that price is still going up. What ensues then is a big drop. Maker-makers would have now trapped BUYERS to create liquidity for taking the price down.
This is critical to understand. If you can trade how MARKET-MAKERS are trading you'd be able to extract profits off the markets on a consistent basis.
---------------------------------------------------------------------------------------------------------------------------------------
Do drop questions in the comments section. I will be ready to answer.
BTC: Reading the Tape on the DailyScenarios I'm considering:
1) Price makes a run upward to the short-term target above (note that these moves can take weeks or months).
2) Price continues lower into deeper levels of liquidity seeking more sell orders (the logic for this is explained down below).
3) Price crashes below anything I've mapped out here. My Longs get liquidated and I cry myself to sleep with all the Moon Boys and Moon Girls out there. (JK I only trade spot, so I can't get liquidated).
Scenarios I'm not considering:
1) Price skyrockets to the moon and annihilates the ATHs over the next few days, weeks or months.
2) BTC goes to zero and proves all the no-coiners right.
Things to watch:
DXY (US Dollar Index): If it continues higher, we can anticipate some more pain in crypto and riskier equities.
FOMC Meetings on September 21-22: We need to know the narrative of interest rates.
**********************************************************************************************************************************************************************************************************
If this is your first time reading one of my posts, I recommend reading through this section at least once. Otherwise, you can skip this section of concepts and terms.
**********************************************************************************************************************************************************************************************************
Key Concepts and Terms:
ICT: The Inner Circle Trader (Michael J. Huddleston). He is considered a controversial trader due to some of the chest beating alpha male behavior and trolling antics he was known for in his younger days. Additionally, many traders feel insulted when their retail trading indicators and axioms (i.e., their ideologies of how the market works and how they view market structure etc.) are criticized and questioned by ICT. There is a religious element to trading schools and communities. Traders from any school, and people in general, get rather defensive when you poke them in their fundamental axioms. You can make an argument that ICT himself, ICT students and SMC traders are as guilty of this as the traders they often poke fun at. However, when it comes to reading Price Action and Market Structure, I respect ICT as one of the few mentors out there who applies a market making model to trading and who teaches traders to think outside of retail logic. By this, I mean how we interpret things such as order flow, liquidity, and algorithmic price delivery on the charts. From the retail side, we do not have access to the same level of data feeds and analytics to filter out DOM noise (order spoofing, HFTs, etc.) that “professional” traders supposedly do have access to, so I would argue that we really need to try theorizing what price action fractals might look like on the charts from our retail trading avenues with the data that we do have – most notably the ability to tape read. Note that I am not talking about reading the DOM, which is one definition of tape reading. Instead, I am talking about reading price action on the charts from candlesticks (or bars) in order to analyze Time and Price. This is not the same as trading patterns such as flags and pennants or individual candlestick patterns (dojis, hammers, etc.). We are trying to interpret the context and the series of candlesticks (i.e., pure price action OHLC and time) as a reflection of price seeking liquidity and how large orders are booked into the markets.
Market Makers: There are three ways you are likely to hear this term used. The first use is for large banks and financial institutions who provide liquidity and who capture the bid-ask spread at a granular level for profits. The second use is for the technical definition of liquidity on the order books. You have likely heard of maker fees vs. taker fees. Makers add liquidity to the markets and takers remove liquidity from the markets by hitting the bid or lifting the offer. Under the second definition, we retail traders can also be “market makers.” The third use of the term is for those entities who we posit as the real string pullers behind the scenes. In Forex, we know for a fact that the central banks directly control the ultimate direction of everything. Outside of Forex, the central banks still impact everything in other markets, but we might assume the direct string pullers to be commercial banks, funds, whales or some other entity. In some ways, this definition does overlap with the first one if we consider the narrative of who controls the balance (areas of fair value) and imbalance (fair value gaps) in any given market. The main difference between the first and third definition is the degree of macro level cynicism and price manipulation that we ascribe to the latter definition of “market makers.” Many traders – myself included – believe that these market makers (the string pullers) leave certain clues in price action based on the algorithms they use and we try to hunt for setups based on signatures of time and price in a given market.
Smart Money: This a rather ambiguous term that is used often by certain trading communities. It can refer to large funds (whales), market makers(string pullers), or “in-the-know” traders who supposedly know how to read the footprints of what the market makers are doing. I tend to use the term to refer to the latter group, but you would have to interpret what someone means on a case-by-case basis from context.
Smart Money Concepts (SMC): According to ICT, he has taught hundreds of thousands of students over the last three decades through his online mentorship. Apparently, some of the former ICT students did not uphold their NDA and ICT’s teachings have allegedly been leaked over the years and rebranded as SMC. These SMC traders argue that they are teaching Wyckoff. ICT has made multiple videos to highlight how Wyckoff and ICT teachings are different. Having studied about the real Richard D. Wyckoff from books and StockCharts.com, I tend to agree with ICT on this issue, but you would really have to do your own research and come to your own conclusion. I get the impression that many of the newer SMC traders genuinely believe they are using Wyckoff when they first start studying smart money trading systems, so I am guessing only a percentage of traders intentionally try to steal ideas and concepts. That said, be wary of any “traders” who try to sell you any trading “education,” systems, indicators, and setups – regardless of whether it is smart money or some other trading framework. While you cannot expect anyone to reveal 100% of their cards or to hold your hand for free, people who genuinely care about you should be willing to provide at least some information at no cost.
Imbalance: I am using this term to refer to broader areas where price has been delivered too much in one direction. ICT’s Fair Value Gap is more precise, so I leave it to you to go study on your own from ICT since most of his content is available for free now.
Liquidity: I am using this term on the charts to refer specifically to counterparty liquidity. ICT splits this into two categories: Buyside and Sellside Liquidity. Above old highs, we anticipate a large number of potential Buy Orders because that is where Short positions get stopped out (a stop loss for a Short is a Buy Order), Breakout Long Traders ape in at these levels, and overleveraged Short Positions can potentially get liquidated. Thus, ICT refers to these areas of value as Buyside Liquidity. This does not mean traders should be looking to Buy here. The idea is to think counterparty and realize that it is a potential opportunity to pair those Buy Orders with Sell Orders which would be Profit Taking from Longs or Short entries. Below old lows, we anticipate a larger number of potential Sell Orders because that is where Long positions get stopped out, Breakout Short Traders ape in at these levels, and overleveraged Long positions can potentially get liquidated, especially in markets such as crypto. Thus, ICT refers to this as Sellside Liquidity because of the counterparty potential for pairing those Sell Orders with Buy Orders – which of course amounts to new Long entries and Profit Taking from Shorts. After one area of liquidity has been “taken out,” then we anticipate price to potentially reverse and go after the nearest liquidity in the opposite direction. However, recent lows can continuously get attacked and recent highs can continuously get attacked, so it does not mean we are expecting immediate price reversals or continuations. You would need to use a top-down approach from the HTFs to the LTFs and look for market structure shifts or breaks. While I personally anticipate price to behave a certain way after reaching these areas of value, I would never try to call the exact bottom or top of any short-term, intermediate-term or long-term move. Price can run much deeper into liquidity than I anticipate. As I am still in the process of improving as a trader myself, there are likely more experienced traders than me out there who have a better sense of depth expectations while trading from the same framework and way of viewing the markets. Regardless, I believe strongly in the idea of taking partials and taking risk off the table after we reach each area of liquidity, as price can always go higher towards intermediate-term liquidity after claiming short-term liquidity to the upside and price can always go lower towards intermediate-term liquidity after claiming short-term liquidity to the downside.

Short-term and intermediate-term targets for COIN (ICT)ICT traders and "SMC" traders will be familiar with most of the Market Making ideas on here. For traders who aren't familiar with any of the terminology:
Buyside Liquidity refers to where we expect Short positions to get stopped out when Price runs on old Highs.
We anticipate Order Pairing at these levels where Smart Money Sell Orders are paired with losing Short traders who're forced to Buy at a "Premium."
Sellside Liquidity refers to where we expect Long positions to get stopped out when Price runs on old Lows.
We anticipate Order Pairing at these levels where Smart Money Buy Orders are paired with losing Long traders who're forced to Sell at a "Discount."
I won't explain what Order Blocks are in detail here. I'm not an expert on Order Block Theory and ICT teaches it over on his Youtube Channel for free.
Basically, we're looking at theoretical price levels that should be "supported" or "resisted" in the traditional retail trading sense based on Institutional Order Flow.
Scenarios I'm considering:
1) Price runs down to the Preliminary Target and then makes a small rally back to the Gap before reversing back again to make an aggressive run down to the Main Target levels. After the Main Target has been reached, we'd anticipate an aggressive rally back up.
2) Price crashes straight through to the Main Target levels (short-term Bearish ) and then rallies to target the Gap (intermediate-term Bullish ) and to potentially higher Buyside Liquidity levels (with the darker green areas representing more ambitious Price Targets).
3) I'm wrong and Price recovers at the current choppy Gap Filling area and rallies straight up to take out the Buyside Liquidity immediately.
4) I'm completely wrong and Price does nothing that I'm anticipating based on the logic I've outlined here.
Some traders might wonder how what I've outlined is any different from traditional Support / Resistance levels or Supply / Demand zones.
The main difference is the logical framework around liquidity and order flow combined with ICT's Top-Down approach and Time & Price Theories.
ICT traders are anticipating targets based on an Imbalance or old Highs and Lows. We're always thinking "to and through" as opposed to the Price respecting some Support / Resistance level unless there is a valid context such as Institutional Order Flow.
If you're interested in the concepts here, you can check out ICT's Youtube channel. I'm not affiliated with ICT in any way and I'm not a paying student of his.
He's been making most of his elite content available for free in 2022, so everything I've learned is through his free content.
Most of the "SMC" concepts out there are taken from ICT, so I would recommend going to the source to learn.
Note that ICT does not consider volume. I used to rely on volume all the time, especially when applying Wyckoff and "VSA" strategies.
I no longer consider volume as much as before, but I do glance at volume (real and tick volume) for markets with centralized volume across a long span of time on the HTFs to make sure there is confluence with my theories around accumulation, re-accumulation, distribution, re-distribution, and manipulation. This is why I bothered to mention it on the chart (orange box) where we do see a heightened level of contracts traded within this range. Also, we know that Cathie Wood and other institutional investors have an interest in accumulating within this range. That said, I still prioritize HTF liquidity narratives over anything based on volume.

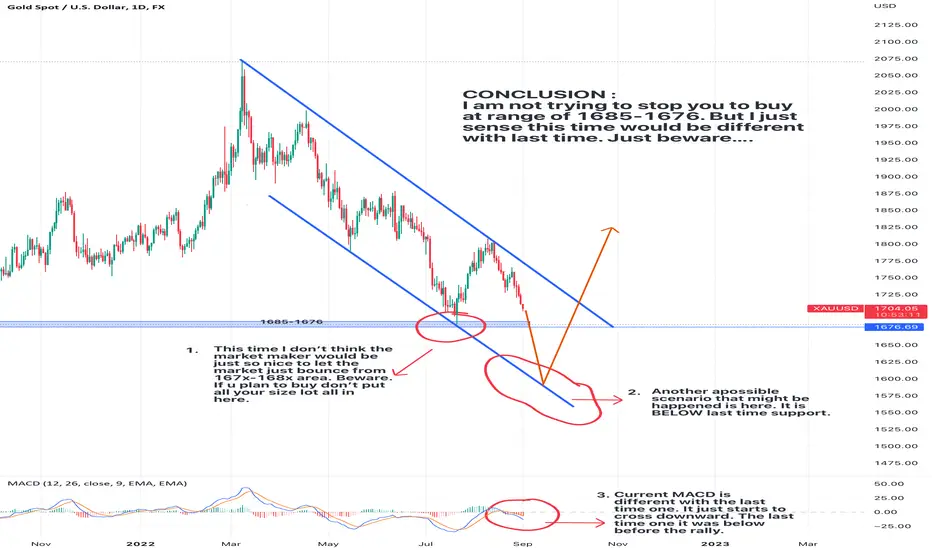
BEWARE. The Market Maker Would NOT Be AS NICE AS LAST TIMEThis is just opinion from my observation. Let’s see. I am not trying top stop you to buy or trade. Just beware. The big boys would not be as nice as last time. I wish you all manage your trade well. Overall trend is strong bearish.
MarketMaking and MarketMaker. What is it and who is it?All participants in financial exchanges can be divided into two categories - market makers, who set the mood in the market, and market makers, private investors with small capital.
Market makers ( they are in minority ) will always manipulate market makers ( they are in majority ).
What is a market maker, who he is, what he does at the exchange and why he is needed?
WHO IS A MARKET MAKER AT THE STOCK EXCHANGE?
This is a professional in the market with very large money, without whom trading is impossible - because this figure is considered a key player in the market and moves the price. Most often, this is the whole financial organization.
MARKETMAKER is the one who creates and maintains the liquidity level of exchange , currency , cryptocurrency , futures instruments , etc.
It is only possible to make transactions on the market through the market maker, who regulates the processes so that the exchange is not dominated by only sellers or buyers.
The MARKETMAKER is obliged to buy even if the market is dominated by sellers and even if it leads to losses. And when the market is dominated by buyers, the market maker must sell in order to balance the market. The main purpose of the market maker is not to make money, but to regulate supply and demand, to maintain liquidity.
CATEGORIES OF MARKETMAKERS
Large commercial banks, but not by themselves, but united in groups: they are called institutional market makers.
Brokerage companies
Dealing centers
Investment funds
Private investors with significant capital.
WHY DO WE NEED A MARKETMAKER?
It stabilizes the market, controls price movements, satisfies traders' demand. And since large financial institutions take on this role, they can be both sellers and buyers.
The market maker makes a huge number of deals every day and ensures the liquidity of assets.
The peculiarity of their work is that market makers can support the quote both in the buy and sell direction simultaneously on the same financial instrument, which makes the price move more smoothly and price gaps disappear.
TASKS OF MARKET MAKERS
Ensure profitable deals for all participants
To maintain sufficient liquidity for any instrument throughout the trading session
To accumulate orders within the instrument being traded
Find and consolidate the best price offers and record them in the price book
Provide all participants with information on current quotes as soon as possible
WHAT AND HOW DO MARKET MAKERS MAKE MONEY?
The best way to make money on the exchange is to be able to correctly predict large price movements and timely open positions in this direction.
No market maker can do it on a large scale, but a small impulse is enough to start the process of a large price movement. And for this market maker first forms a trend in the direction he needs, after which he acts in the opposite direction. Thus, the market maker makes a profit, while other participants lose more or less.
Since market makers are the first to review current orders, they are the first to find out about the emergence of a trend in one direction or another and do everything necessary to balance the market and not allow a large surge of volatility. For the fact that he keeps the market price of the instrument in the predetermined limits, the market maker receives a significant discount on the commissions. And his profit is the difference between the bid and ask prices, which is called the dealing spread.
Because the exchange is interested in maintaining the liquidity of assets, it encourages healthy competition and advocates the presence of several market makers on one floor. It reduces the cost of transactions, increases the speed of transactions and makes pricing transparent. Even the exchange rules often contain a clause that a deal is legal if a market maker is involved, i.e. it is quite a significant and influential market player.
HOW DOES THE MARKET MAKER WORK?
He establishes a connection with his clients through a program, analyzes the market and executes orders of his broker's clients. Often he prefers to work with mid-sized brokers to have the necessary volume of transactions to make money.
Marketmaking. Order-Making and Order-Making.
The function of Order-Making is to watch a particular company's stock and make predictions. Order-taking is to execute traders' orders and take additional profits.
HOW DOES PROFIT TAKING TAKE PLACE?
Like other market participants, market makers can also incur losses, which occurs if a position is chosen incorrectly. But due to the fact that market makers work with large volumes of trades and a large number of clients, they always have an opportunity to cover their losses.
Regards! R.Linda!

A View From The Institutional Perspective This is usually on a range chart when I use them so I hope I converted them over alright. This gives you a Market Makers view of the market. Usually I would invert the scales like the top indicator is. Does it look familiar to anyone? Just wondering ho many use things like this. Personally I find Realtime volume footprint chats to be fascinating. Also this maker maker style chart is a great tool to see why the market moves the way it does, especially if you use it to see what happened on a losing trade.
I admit I there is still so much to learn when it comes to this and VFPA but supply and demand is as simple as it gets. Hope this helps someone. Try looking at it on ranged charts as well. It looks different and I prefer the bars to any style candle but I couldn't get this to work with the bars not in ranged charts. I mainly us it to see where I went wrong in a trade and learn from it but it can be use for so much more. Footprint charts will show you exactly where the market is moving to at any given time if used properly.
Free tools I use in conjunction:
bitcoinwisdom.io
aggr.trade
I use many more such as Sierra Charts, Motive Wave, Hyblocks, Bookmap and a few more but they can get pricy. The above are free and paint a nice picture. Bookmap is sort of free but it is my least favorite but is easy to use and well supported.
I sort of hope the bear market is not over because I like to use that time to study and learn new things as well as prepare for next bull. According to cycles I don't see how it could be over. Usually a bear lasts at least a year and crypto usually 2. I mean it is never always bearish there are some bullish moves in them but the majority is downtrend and sideways range. Sideways markets are a great time to truly test your trading skills. It seems easy just looking at it but in my experience it is anything but and very hard to extract profits from. It is why I expect to see the markets reverse very fast to really wreck reckless less experienced traders. As soon as you get comfortable in a nice long BAM! The DROP! That is a terrible way to think and I still have problems with it personally. is a terrible way to think when this is happening cause you miss out on a lot of opportunities waiting on the other shoe to drop. I hate that I have grown some bearishness in my older age. I guess like everything there must be balance.
I hate these but here it is: None of this is financial advice because I am not getting paid to provide it and am not your financial advisor. This is all for fun and educational purposes and only intended to assist you on your trading journey not keep losing in the markets. Anyone who says its easy and quick is full of crap or got really lucky once and will eventually end up where they were before. The only way to succeed in finance and trading is to learn all you can and progress slowly. Not the most fun but the only way I have seen truly work long-term. Remember we are competing with some of the smartest minds on the planet and it's not necessary to beat them. We can work with them or grab profits from their gains. Going against them is not something I ever recommend doing. They are not the enemy anyways, just made out to be, I believe we our are own worst enemies in trading especially in the beginning. This is something I will continue to be learning probably right up to the day I die or eventually retire but doubt I would stop trading even then.
Also I will never ask you for money or crypto for anything. You should keep all your assets and never pay anyone for signals. Learn to see your own and if you are going to pay for something pay for good education from a real professional. It is easy to check their references and most don't share their trades till after the trade is over. Everything I do I do for free, no premium, no telegram or discord. Had a free telegram group but no time to maintain it. It was for fun Cryptoholics Anonymous and G3N3S1S TR4D3ING but I just closed them as it was too time consuming. Please be very careful and do not lose your hard earned assets to scammers or become liquidity for some random group offering trade signals. Personally I don't have much free time so I am not on as much as I would like to be but I try to check in as often as I can.
Enjoy. I suggest you seek out as much information as possible if this interests you. It has made a difference i my trading, added an edge but it is hard to chart for others to see. At least it is for me anyways. Remember Capital Preservation is key and risk management is key to capital preservation. I know everyone is screaming that now and they usually do during a bear market but that all goes away when the market turns bullish. Just something to keep in mind.
USDCAD NY Possible Sell SetupAfter a vertical move.. it is highly probable that USDCAD makes a move back down to it's original Consolidation Area.
This is a classic Pump and dump Set up

BNB/USDT BINANCE COIN CHANGES CHARCTER TO THE BULL TRENDBNB is about to have some local pump agter taking sto loss of the last buyer and touch MM POI. entry on the lpwer timeframes

Who is the MARKET MAKER and how they manipulate the market ?!!!!-WHO ARE THESE PEOPLE, WHY ARE THEY SO MEAN AND MANIPULATIVE
-I SWEAR I WILL NEVER TRADE CRYPTO AGAIN ITS ALL PUMPS AND DUMPS
-AAAGGHHH NOT AGAIN....they stop hunt me again and I am rekt once more.
-THESE MARKET MAKERS ARE FULL OF ---- .
yup, we have been all there my friends I get your feelings, I really do! but you think market makers are evils and are here just to manipulate the market? for real?
bare with me for a couple of minutes and I will break it down for you.
WHO IS THE MARKET MAKER
A market maker is a simple man, but this simple man has a lot of money and with a great amount of money, comes great amount of power.
let me borrow a sentence from 'investopedia' so I can introduce you to this simple man:
"The term market maker refers to a firm or individual who actively quotes two-sided markets in a particular security, providing bids and offers (known as asks) along with the market size of each. Market makers provide liquidity and depth to markets and profit from the difference in the bid-ask spread."
did you notice that? "Market makers provide liquidity and depth to markets.."
so it is fair to say that their existence is crucial for every market. without market makers, there may be insufficient transactions and fewer investment activities, which means you can not buy your favorite altcoin/asset at a certain price because there is no one willing to sell to you.
it's simpler than you think, market makers provide deals in the market, they offer 'x' amount of securities at a given price (bid) and also offer to sell 'x' amount of securities slightly higher than where they bid (ask).
When an investor initiates a trade they will accept one of these two prices depending on whether they wish to buy the security (ask price) or sell the security (bid price).
I also borrow the last sentence from 'investopedia' xoxo
HOW DO MARKET MAKERS MAKE PROFIT?
the difference between their bid price and ask price is what we call 'spread'.
if the bid price of a stock is $10 for example, and the asking price is $11, then the spread is $1 (or 9%).
if I buy one share of that stock at 10 and sell it at 11 I will put $1 in my pocket as profit. but market makers make a trade with spreads as low as $0.01.
why? we will get to that very soon, what important here is that even in small spreads you can make a lot of money if you are investing with A LOT of money, and boy they do have a lot of money.
as I mentioned earlier they keep the spreads really low for multiple reasons:
the obvious reason is to make the market moves slightly with a natural flow which we can witness in liquid markets such as forex or Bitcoin for instance, the orderbooks are always tight.
another reason is the exchanges that offer different market makers to come and heal their order books and 'depth'.
so there will be a domestic rivalry between market makers as well in order to execute their trades before anyone else and they will keep the spreads as low as possible.
another quote from 'investopedia' which is the sponsor of today's article (lol): "Market makers must operate under a given exchange's bylaws, which are approved by a country's securities regulator, such as the Securities and Exchange Commission (SEC)."
WHAT WILL HAPPEN IF THE SPREAD IS HIGH?
you will die..
Nope, it was a stupid joke ffs
when the spread is high the depth of the market is shallow, and when the depth is not deep enough, any player with a fat bag can move the market in any direction that they want.
what is this 'depth'? glad you asked:
"Market depth refers to a market's ability to absorb relatively large market orders without significantly impacting the price of the security." (by order of the investopedia)
Market depth can be evaluated by looking at the order book of an asset/stock/..., which consists of a list of pending orders to buy or sell at various price levels. On any given day, there may be an imbalance of orders large enough to create high volatility, even for stocks with the highest daily volumes.
are we done here? you all understand? good lets move on
BUT WHY ARE THEY SO EVIL?
It's all about business darling, a man gotta eat and feed his familia.
these market makers usually work on behalf of large institutions, and they are brokerage houses that provide trading services for investors in an effort to keep financial markets liquid. but they can also trade individually and make some profit on their own, this is where they manipulate you with fake breakouts and deviations and upthrust and springs and blah blah blah. without market makers trading won't be fun ;)
thanks for baring my none stop nonsense writing, although I put a lot of hours behind my research so I don't falsely deliver the wrong information!
so leaving a like and comment will cheer me up a lot, and although I don't have A LOT of money to be a market maker, I have A LOT of free time to create content such as this. (follow me :D)
the next article will be about the taker buy-sell ratio !!!!!!!!!

BTC Next Moves PossibilityWith this inverse H&S, we should always look at market in 2 ways, either up or down.
There might be an exhaustion at breakout/retest/fakeout of H&S, and it drops to grab liquidity .
Or on the other hand, it can just retest and move up. But be careful, Market makers/whales will grab liquidity both sides.
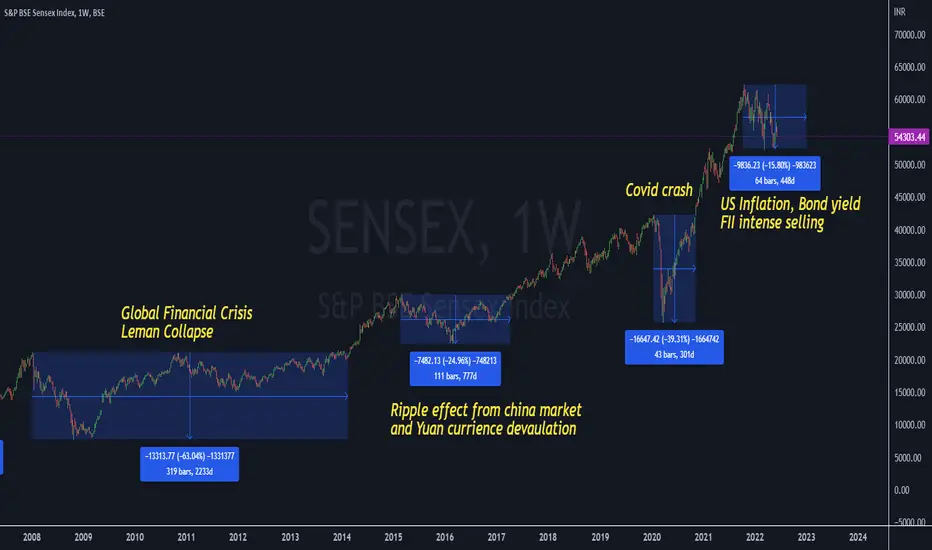
Indian Market - Major crashes in the HistoryThese are all the major crashes that held in the Indian market
June Week 2: EURGBP Long-term trend signal!Hi friends, I hope y'all had a fantastic weekend ;)
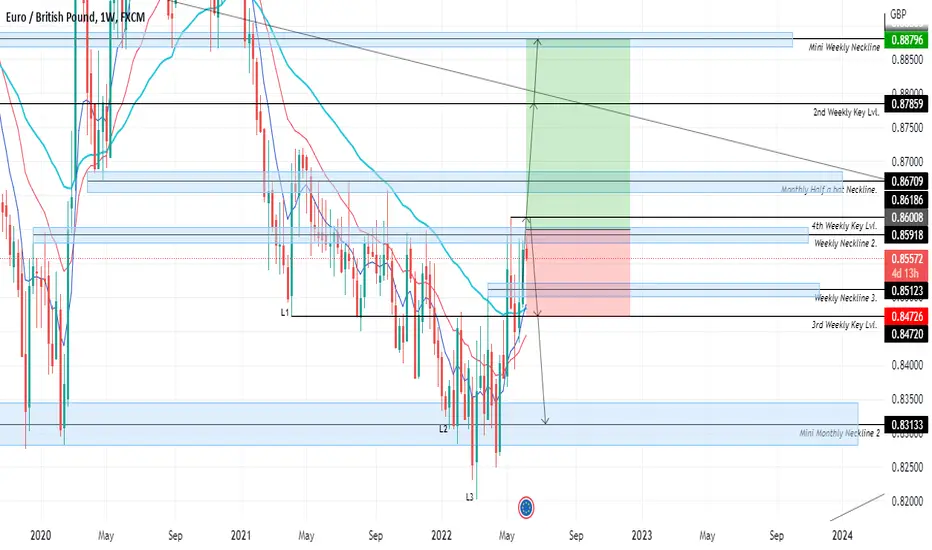
Today, we have possible long-term bullish rally on this baby. I kind of doubt the trade but looking at how the correlating pairs that have GBP as a base currency behaved (by bearish dropping in the previous weeks) instilled faith in planning to take this trade with you guys. Before we do that, lets take a look at how the bulls and bears might behave in triggering and dis-confirming this trade.
Bulls: -If the price bullish breaks and retests the Weekly Neckline 2/ 4th Weekly Key Lvl and 200 m.a (that's visible on my MT4 chart), that will
trigger our trade signal that I call a Double Bottom A-E.2 signal, and the price will rally for the patterns L1, L2, L3 together for the short-
term m.a's trend that will probably end on the last take profit point.
Bears: -If the price bullish bounces off the Weekly Neckline 2/4th Weekly Key Lvl and 200 m.a with a bearish reversal candle pattern close,
before or after taking the trading, that will tell us that the price isn't ready to rally to the last take profit point, and instead it will signal
a drop to our stop loss key level.
That's it for today. I hope you found value in this. If you have a different perspective, feel free to share it in the comments section, I'd love to know your thoughts on this pair!
Stay Blessed,
Doji-2k1
Why Do Pullbacks / Retracements Happen?When price moves from A to B, it rarely moves in a straight line.
To get from A to B, price moves in that direction, retraces a little, then moves in that direction again.
Why does that happen ?
1. Natural supply / demand dynamics
The further price stretches up the less buyers join into the move. After some time whoever wants to buy already has bought. The others which have not yet will look for a retracement to buy again or to even short the move.Sellers will inevitably start testing the move. To see its strength at a point where they feel buying is at its weakest. As the sellers join the fight, buyers will see the upward momentum drop. Some will begin to sell out pushing momentum further down. The market makers who are moving the market the most will also reduce their buying pressure so they can save their capital to support the market after the retracement In order to ensure that there will be a higher swing low.
2. Manipulation by market makers.
"Saving their capital" sometimes generates whole trends, rather than just a small pullback. Long uptrends for long periods of times will eventually finally hit consistent supply above which MM will not be able to push further. At this point the big players will start dumping a large amount of their supply the market goes into a steep decline covering almost the entire distance of the uptrend before the big player starts to scoop up all the inventory at a low price and repeat the upside move again.
3. Shaking out weak hands
In order for a market to push higher. It needs to shake out the weak hands by engineering pullbacks. Weak hands will provide the necessary liquidity for the market maker to push the price higher.
4. Stops hunting. Market makers know perfectly well there will be traders moving up their stops up with the market. They will hunt them down. Sophisticated algos and trading programs will be used for this which further adds to the supply that causes retracements to occur.
If you enjoyed this information make sure to live a like!
Let me know in the comments what you think about it!

Learning This Pattern Will Change Your Trading Forever.I trade from a strictly fundamental standpoint. The reason that 95% of traders are failing is because they are simply looking at a chart. The catalysts behind the movements of the chart and the why behind what's going happening on the charts is the news. Technical Analysis can only be applied properly once you have an objective, data based bias on the market.
I call this pattern the market maker news pattern.
Depending on whether or not it is a bullish or bearish day, this pattern can be found all over the charts on any given week.
It happens on every chart.
When you understand the why behind this pattern and can recognize it while it is happening, you will be able to catch massive moves in the market that happen very quickly.
I hope this helps you grab a billion points and pips!
Blessings to you and your trading!

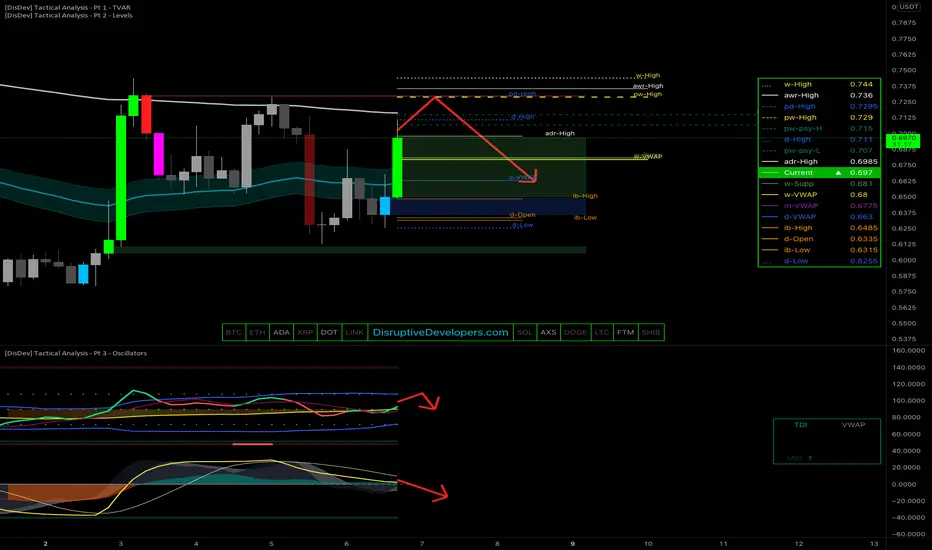
ALGOUSDT - INTRADAY TRADEToday we are looking at Algo because we noticed that while the majority of the Cryptocurrency market is down for the day, Algo is currently showing a >10% gain.
Time Frame
In this example, we are using the 4-Hour chart because we noticed a High Volume candle being triggered.
Strategy
Tactical Analysis - The evolution of the Traders Reality Hybrid strategy which stemmed from Steve Mauro's Market Maker Method and Trader at Home's PVSRA (Price Volume Support Resistance Analysis) systems.
Trade Idea
This is a very basic trade setup. Price is at the high's and is approaching the 200 EMA on the 4-Hour chart which is the equivalent of the 800 EMA on the 1-Hour. Typically price will react to the 800 EMA and tends to revert back towards the mean of the 50EMA. The daily V-Wap is currently sitting right around the 50 EMA providing more confluence for this trade idea as the price also usually will return to the Daily VWap which is where the institutional traders will find the liquidity to fill their positions.
Additionally using the Trader Dynamic Index indicator in the oscillator section at the bottom of the chart we can see the price line has crossed the Market Base Line heading up however, we are seeing bearish divergence, Vwap Mac-D, and momentum all declining.
Indicators Used:
The Tactical Analysis 3-Indicator Suite
- Tactical Analysis Part 1 - TVAR (Tactical Volume Analysis Recovery)
- Tactical Analysis Part 2 - Levels
- Tactical Analysis Part 3 - Oscillators
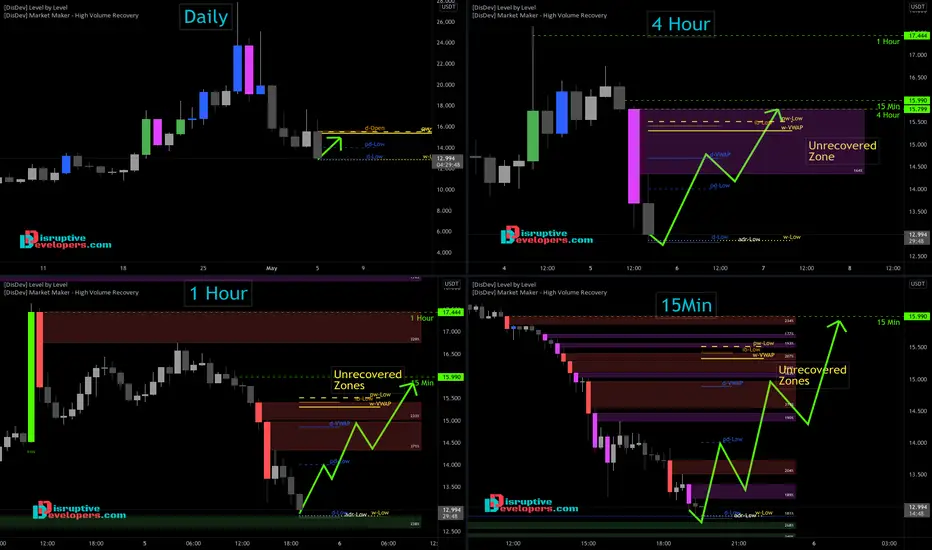
APEUSDT - INTRADAY TRADEThe best risk to reward trade set-ups are usually found when you trade with the trend. To identify these ideal set-ups you plan your trade by starting with a high time frame and working down to an executional one.
Time Frame
In this example, we are looking at 4-time frames for APEUSDT. The 15-Min, 1-Hour, 4-Hour, and Daily.
Strategy
For this trade set-up, we are simply going to look at recovery zones and key levels to determine what we think the price is going to do over the next few hours.
We are using PVSRA candles which will be colored differently based on increased volume over the running average. The recovery zones are shaded to the right and are dynamically adjusted to show which portion of the High Volume candles have not yet been recovered, or where the price has not yet been retraced to.
Trade Idea
Starting with the Daily chart we can see that the trend is down and there are no recovery zones. The 4-hour chart has a high recovery point of $15.79, the 1-hour is $17.44 and the 15min is $15.99.
Price is currently at the daily and weekly low with the average daily range low very close.
Indicators Used:
DisDev -
Level by Level
DisDev -
Market Maker - High Volume Recovery
How to study indicators?Hello everyone
Today I want to talk about indicators.
Every trader has used indicators at least once in his trading, but not everyone knows how they work and why they should be used at all.
The best way to understand something is to look for answers to questions yourself.
Below I will give you some questions that you will have to answer in order to understand the operation of the indicator.
Problem
Most beginners start their way of studying indicators with books or articles on the Internet, where it is told: buy here when this line crosses this one, when the indicator enters this zone, and so on.
With such a study, the trader does not understand how the indicator actually works, which indicators are similar to each other and why the indicator gives these signals.
By answering these and other questions, the trader will be able to understand for himself whether he needs this indicator.
Our task is as follows:
1) find out how the indicator is calculated;
2) understand how this indicator reacts to changes in parameters;
3) to understand what all this means in the context of market data.
Find answers to the questions
If you really want to get into the essence of the work of this or that indicator, do the following:
1. To begin with, you can start by studying the history of this indicator. It is best to look for the original source to understand what the creator of the indicator put into this tool. Any information will be useful for understanding the tasks that were set before the indicator at the time.
2. How can the indicator help us or why is it more useful for us to use the indicator than just looking at the chart?
3. Which indicators are similar to this one? Of course, it will not be possible to study all the indicators, but it is not necessary. It is enough to observe and understand where the indicators give the same signals. Thus, we will remove unnecessary repetition of signals on the chart.
4. What exactly is taken into account when the indicator is working? For this work, you need to be able to calculate or program at least in general terms. You can use third-party special programs. The main goal is to understand the details of the indicator calculation.
5. Change the data tracked by the indicator to see how it reacts to controlled price changes. Examples are: a market in flat, where a trend begins to emerge, and then a second return to flat occurs; a game on trend strength; a flat with one subsequent large price jump; "ladder" markets; stable long-term trends and their reversals; fluctuations (for example, sinusoidal) with different periods.
6. Take the knowledge you have gained and look at the indicator on the price charts. Notice how it reacts to price spikes. Analyze this stage of information collection. Your goal is to see how this indicator works on a large amount of data, and not to dig deep.
7. Now find out how you can test what you see in paragraph 6. Is it possible to test this indicator manually, or will a software algorithm be required to test it.
8. Having received all the data and understood the work of the indicator, you should understand whether this indicator is needed in your strategy?
It will be difficult to answer all the questions, but the benefits will be tangible. You may spend several days or weeks searching for answers, on the other hand, you will learn something that most traders do not know. You will be able to really understand the signals of the indicators and be able to use the right indicator at the right time – which most do not know at all.
If you do not learn how to understand and use trading tools correctly, you simply will not be able to trade in a plus.
Good luck!
Traders, if you liked this idea or if you have your own opinion about it, write in the comments. I will be glad 👩💻

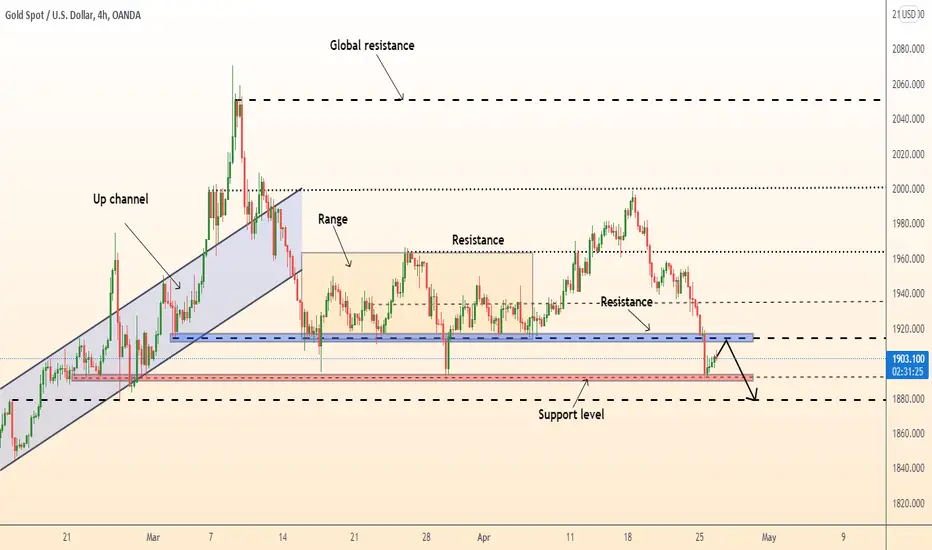
DeGRAM | XAUUSD reached the supportGOLD reached the support level and bounced up. After the correction, which should approximately end at the resistance level, a fall is expected below the support level.
--------------------
Share your opinion in the comments and support the idea with Like.
Thanks for your support!
DeGRAM | EURJPY reached the supportEURJPY reached the support level of 137 and bounced up. The continuation of the movement to the resistance level is expected.
--------------------
Share your opinion in the comments and support the idea with Like.
Thanks for your support!
