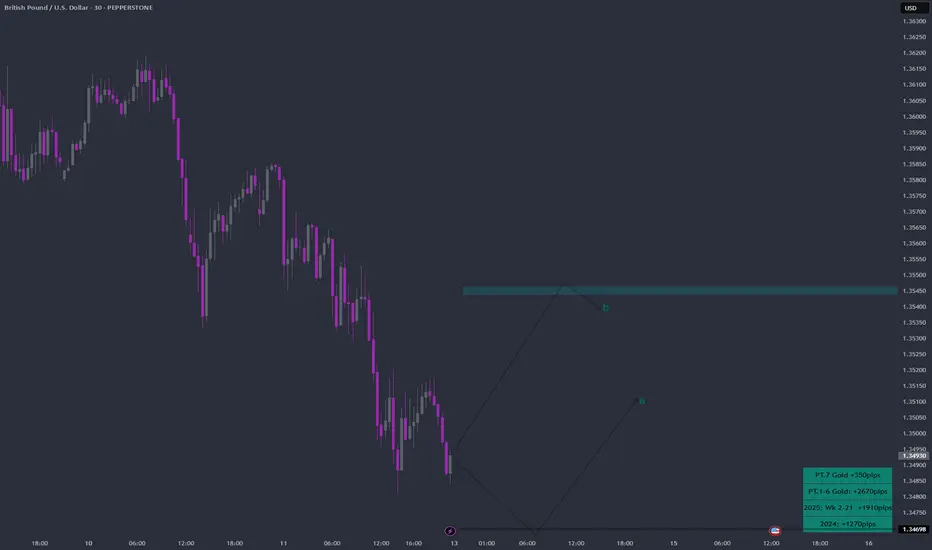
GBPUSD Week 29 Swing Zone/LevelsAfter 7 straight weeks of profitable gold trading, we’re shifting gears to GBPUSD.
Why this pair? It’s offering a classic low-risk, high-reward setup that many traders appreciate:
🔒 Stop Loss: 10–15 pips
🎯 Take Profit: 50–100 pips
We’re analyzing price action using a simple but powerful concept:
Each zone is drawn based on how the high and low of one day compares with the next. For example:
Monday’s high/low vs Tuesday’s range
Tuesday’s vs Wednesday’s, and so on
This method helps spot potential continuation zones as market structure unfolds across the week.
👉 The key? Patience, and letting the levels tell the story.
As always price action determines trades
Marketstructure
XAUUSD Daily Sniper Plan – July 14, 2025Hey team 👋 and welcome to a fresh new week on the charts!
We’re starting this Monday without any major news — just pure price action, clean zones, and structure doing all the talking. No distractions. No excuses. Let’s lock in our focus and let the market show us where the edge is.
🔸 Bias: Bearish while below 3390
Last week’s rejection from the H1 premium zone (around 3375) created clear signs of exhaustion. Price is now forming lower highs and lower lows, with clean CHoCHs on both H1 and M15. Until we reclaim 3390, we remain bearish — waiting for the next lower high to form.
🔽 Sniper Sell Zones (above current price)
3360–3370 → H1 premium FVG + CHoCH OB + EMA5 cap
3380–3390 → Inducement zone + internal imbalance + RSI divergence
🔼 Sniper Buy Zones (below current price)
3310–3320 → Discount FVG + BOS base + HL support
3280–3290 → Final HL structure zone + fib 61.8% + OB + RSI oversold
🟡 Decision Zone:
3330–3340 → Neutral zone
→ Wait for break and retest or rejection confirmation.
→ No setup = no trade.
🧠 Battle Plan – Execution Scenarios:
🔴 Scenario A – Bearish Setup Active:
If price returns to 3360–3370 or 3380–3390 and shows M15/M30 rejection → enter short.
Target: 3330 → 3310.
If 3390 is broken and held → cancel short bias.
🟢 Scenario B – Bullish Setup Activated:
If price sweeps 3320 or 3290 and reacts with strong bullish PA (engulfing or CHoCH) → enter long.
Target: 3340 → 3360.
No confirmation = stay flat, do not anticipate.
🟡 Scenario C – No Reaction / Choppy Flow:
If price consolidates between 3330–3340 without clean rejection or break → wait.
Let price show its hand. Today is Monday — we need clarity, not emotion.
Every level in this plan was drawn with purpose — no shortcuts, no borrowed zones.
If you value structure, discipline, and originality in your trading, you’re in the right place.
Your support means everything — I see every 🚀 and every comment, and I appreciate this community deeply.
Let’s keep growing, with real work and real structure.
Follow GoldFxMinds — we stay sharp, we stay true. 💛
📎 Trade Nation Disclaimer
Chart and structure based on Trade Nation broker feed on TradingView. For educational purposes only — not financial advice.

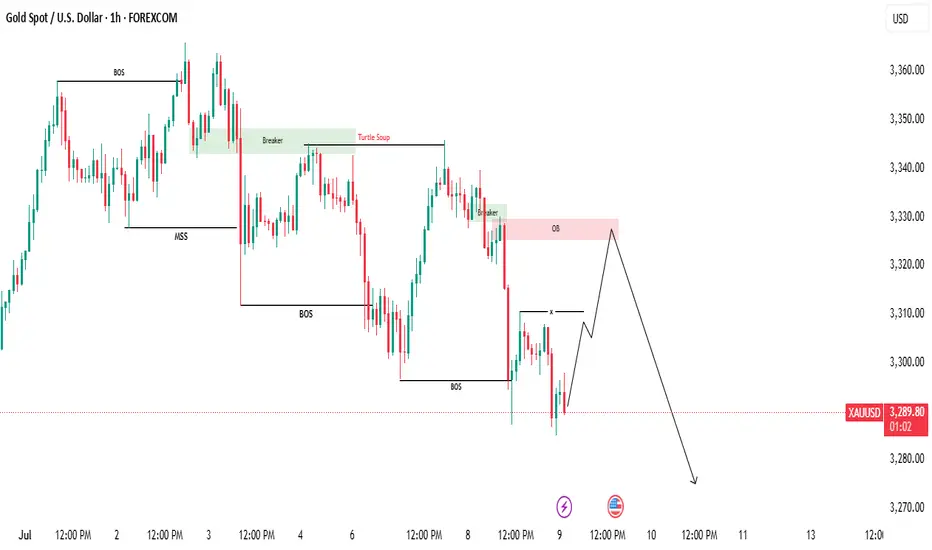
A High-Probability Play Unfolding!🌟 GOLD MARKET OUTLOOK – A High-Probability Play Unfolding! 🟡📉
Gold was riding a solid uptrend recently, showing strength across the board. But over the past few days, things have started to shift. We've seen a clear Market Structure Shift (MSS) followed by a Break of Structure (BOS) to the downside — signaling the start of a short-term bearish trend.
📍 What’s Happening Now?
Gold is currently trading lower after the BOS, but the market is now approaching a critical phase...
We’re expecting a retracement move to the upside — a temporary pullback that could trap early buyers (this is called inducement). This is where things get interesting!
🎯 What to Watch For:
Once the retracement plays out, we’ll be watching closely for:
🔻 Bearish Fair Value Gaps (FVGs)
🔻 Supply Zone Order Blocks
These areas could offer us high-probability sell entries aligned with the overall bearish momentum.
📉 The Target?
We’ll be aiming for the previous swing low, where liquidity is likely resting — a classic price magnet in such setups.
⚠️ Be Patient. Let the Market Come to You.
Wait for the retracement, let price fill the gaps, and only then look for confirmation to enter. Rushing in now means going against smart money flow.
🧠 DYOR – Do Your Own Research!
This is a market roadmap, not a signal.
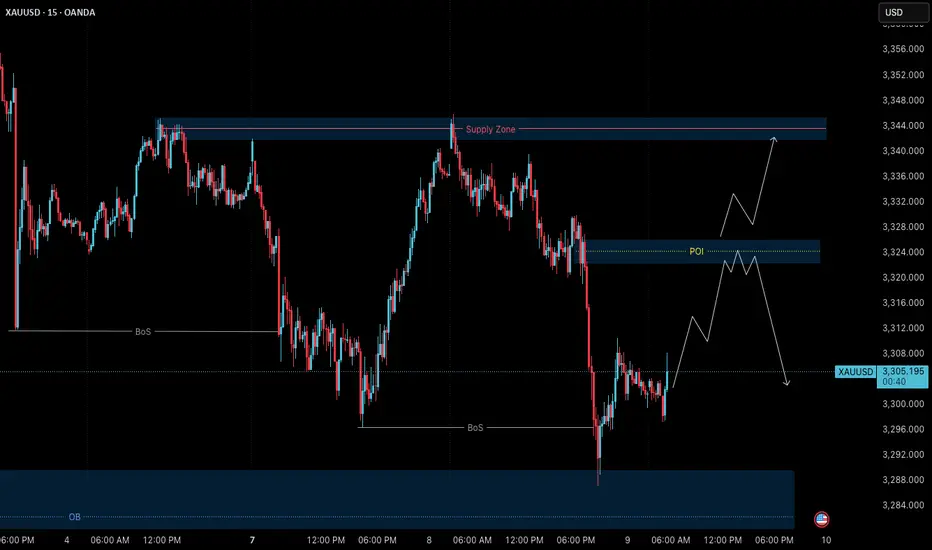
Gold (XAUUSD) – July 9 | M15 Bearish Pullback After H4 OB Tap🟡 Gold (XAUUSD) – July 9 Analysis | H4 OB Tapped, M15 Still Bearish
The market has just tapped into the H4 order block near 3280 (3288–3275) — a level we’ve been tracking closely.
However, price action shows that the H4 pullback is still active and not yet complete.
Yesterday, Gold respected the H4 supply zone (3342–3345) exactly as anticipated.
Since then, price broke below the M15 low at 3296 , confirming that bearish momentum remains valid on the lower timeframe.
🔍 Structure Breakdown
• H4: Pullback ongoing
• H4 OB: 3288–3275 (just tapped)
• M15: Broke below 3296 → Bearish trend continuation confirmed
• Current M15 State: In pullback phase
⚠️ Key Consideration:
While we are looking at bearish opportunities, keep in mind that the H4 OB (3288–3275) is a significant demand zone.
If the market begins to reclaim structure and breaks the Lower High(H4 supply zone), this could signal resumption of the H4 uptrend .
Until that happens, we remain cautiously short — but prepared to adapt.
📌 What We’re Watching
Despite the H4 OB tap, M15 remains bearish until proven otherwise.
So the focus stays on short opportunities — no longs unless structure shifts.
📍 Key M15 POI for Rejection:
→ 3322–3326 (Order Block)
→ If price pulls into this zone and gives M1 confirmation (ChoCh + micro BoS)
→ We’ll plan short setups aligned with current trend
If this zone fails, or structure flips bullish, we’ll wait patiently for a potential revisit of the H4 supply zone (3342–3345) — which remains a valid short area for high-probability setups.
🧠 Summary:
✅ H4 OB (3288–3275) tapped
❌ No bullish reversal yet — M15 still bearish
🔍 Watching 3322–3326 for possible short
📉 Bias: Bearish until structure shifts
But be flexible — if LH breaks, the game changes.
📖 Respect the structure.
The chart doesn’t reverse because you want it to —
It reverses when the market is done moving the other way.
📘 Shared by @ChartIsMirror
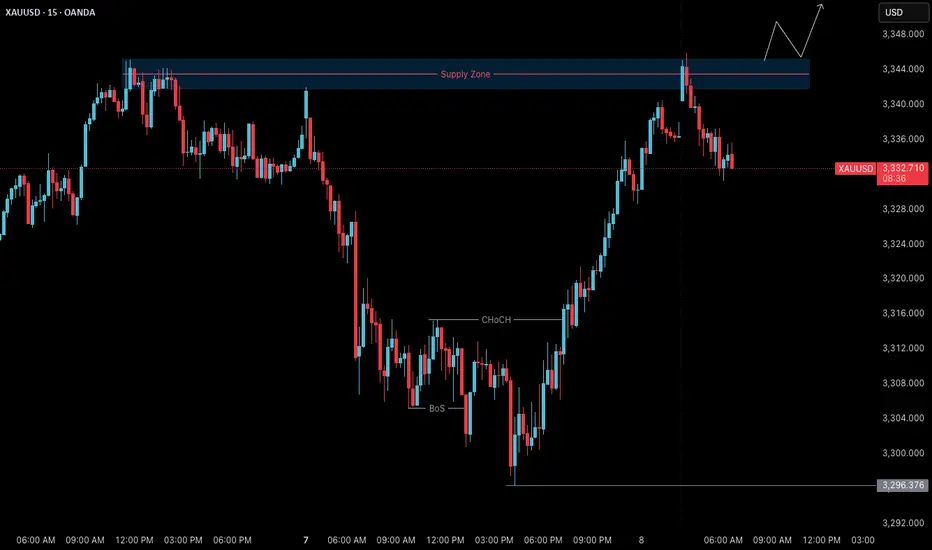
Gold (XAUUSD) – July 8 Analysis | Decision Day at H4 Supply Zone
Gold is currently trading inside a key H4 supply zone (3342–3345) , and today’s session could act as a pivotal turning point for the ongoing structure.
We are now in a region where the H4 may either complete its pullback and resume the uptrend — or allow price to drop deeper toward 3280 before any bullish continuation.
Market Structure Overview
• H4 Trend: Still in a pullback
• M15 Trend: Gave a Change of Character (ChoCh) in the previous session
• Break of Structure (BoS): Not yet confirmed on M15
This puts us in a state of unconfirmed reversal . Without a clean BoS, this could still be a liquidity grab .
Key Levels & Current Setup
📍 H4 Supply Zone: 3342–3345
→ This is where price is currently reacting
→ Sellers may step in here if the broader pullback continues
📍 M15 Structure Status:
→ ChoCh already occurred
→ Price is in a retracement phase
→ BoS is needed to confirm a shift and signal the end of H4 pullback
What Today’s Session Will Decide
🔸 If M15 breaks structure upward (BoS):
→ H4 pullback may be complete
→ Bias turns bullish
→ We’ll plan long setups from M15 POIs with M1 confirmation
🔸 If M15 fails to break and reverses:
→ This could be a liquidity grab
→ Sellers may push price lower
→ Next downside target: 3280 H4 order block , still valid
⚠️ Reminder: Be Prepared for Both Scenarios
• No M15 BoS = No bias
• Wait for structure, not emotion
• Do not force long trades without confirmation
• 3280 remains a high-probability target if rejection confirms
Final Thoughts
This is a structure-led market — we don’t predict, we prepare.
Today’s price action may bring directional clarity.
Structure over speculation.
Let price show intent.
Then act with process, not impulse.
📘 Shared by @ChartIsMirror
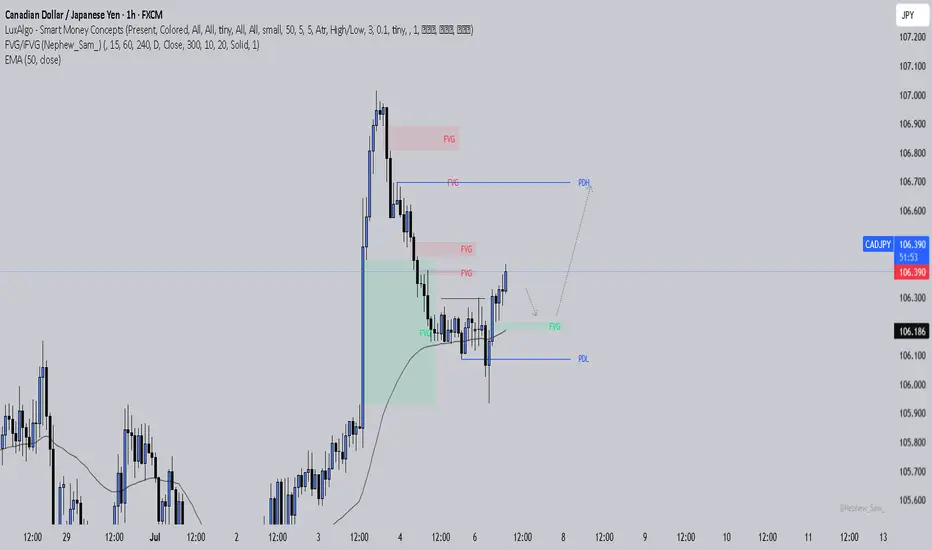
CADJPY: Is the Trap Set?Price swept the liquidity below the previous day’s low and then broke structure to the upside. That’s often a strong sign that smart money just stepped in. I’m now watching for price to pull back and fill the imbalance it left after the break. If it respects that zone, there’s a good chance we’ll see it push higher toward the previous day’s high where more liquidity is waiting.
I’ve also added the 50 EMA on this chart as an extra layer of confluence. It helps me stay aligned with the overall market direction and avoid taking trades that fight the current trend.
It’s easy to get impatient here and jump in too soon, but discipline means waiting for the story to fully unfold. Trust your levels, trust the process, and remember that protecting your mental capital is just as important as protecting your trading account.
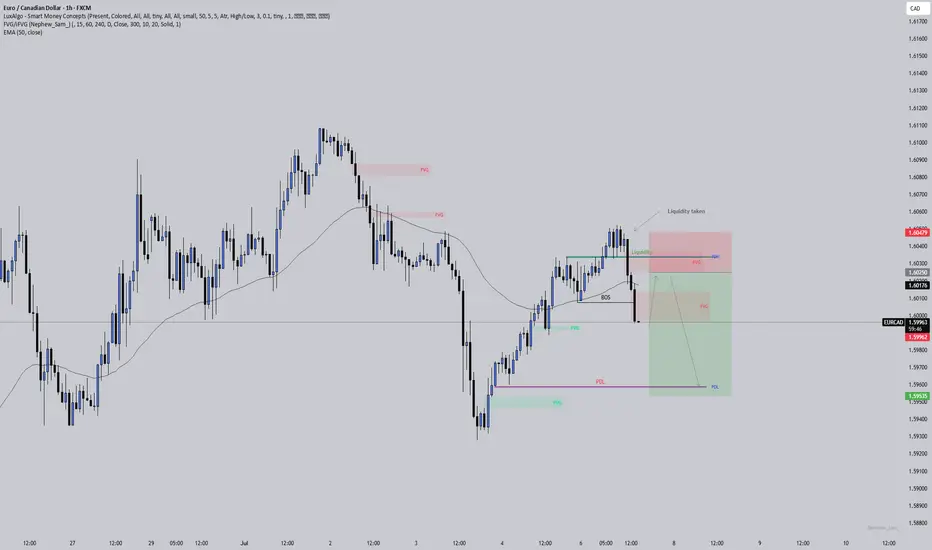
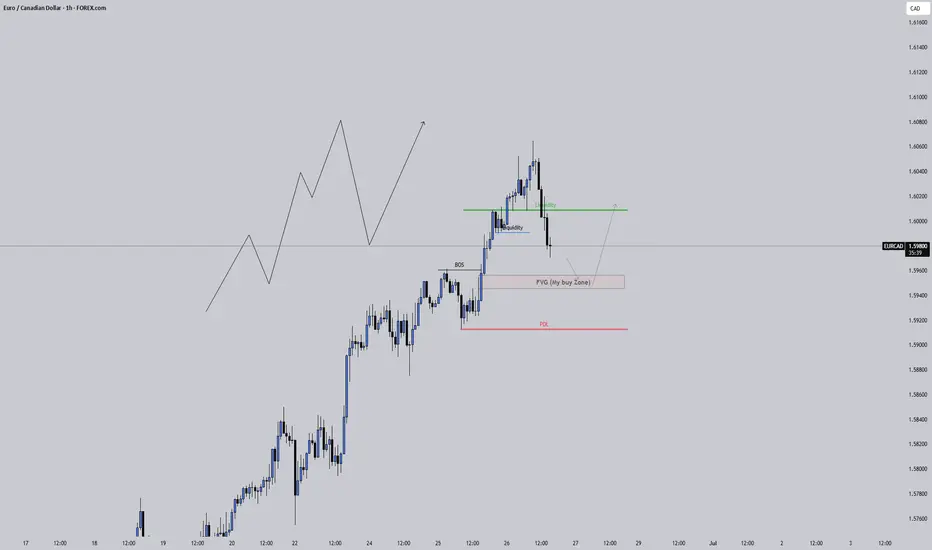
EURCAD: Liquidity taken, imbalance left behindPrice swept the liquidity above the previous day’s high and then broke structure to the downside. That’s often a sign that smart money was hunting stops before shifting direction. Now I’m watching for price to come back and fill the imbalance (FVG) it left after the break.
If that happens and price respects the FVG zone, we could see a continuation lower with the next target being the previous day’s low where more liquidity is likely sitting.
I’ve also added the 50 EMA here as confluence. It helps keep me trading in line with the broader market flow and stops me from fighting the trend.
This is one of those spots where patience is key . Let the market return to the zone on its own terms, wait for a reaction, and keep protecting your mindset just as carefully as your capital.
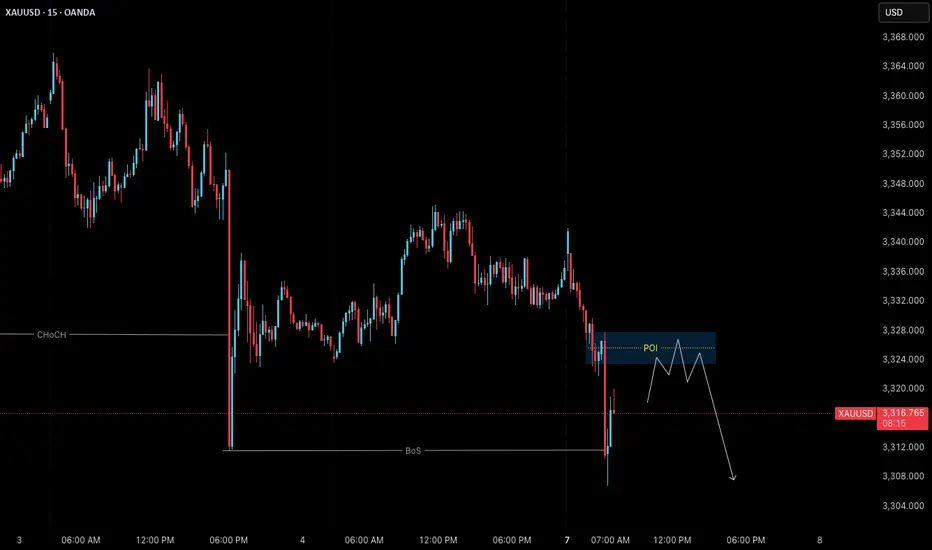
Gold (XAUUSD) – July 7 | Watching 3326 POI for Short Setup🟡 Gold (XAUUSD) – July 7 Bias | Short Setup Developing at 3326 POI
The Gold market remains in a pullback phase on the H4 timeframe , and price may still revisit the 3280 H4 order block before resuming its broader uptrend.
On the M15 timeframe, structure has now shifted clearly.
After an initial Change of Character (ChoCh) , we’ve seen a confirmed Break of Structure (BoS) , placing M15 officially in a downtrend .
✅ Why This Matters:
With both ChoCh and BoS complete, we no longer treat this move as a potential liquidity grab — it now reflects a valid structural reversal in the short term.
But instead of reacting impulsively, we study this shift as a live example of structure-based price action — and how entry zones form after confirmation.
🔍 M15 Order Block in Focus:
• 3323.500 – 3327.800 → Valid M15 POI for short setups
→ This is where we expect price might retrace before resuming its move
→ We’ll observe this zone for M1 confirmation (ChoCh + micro BoS) before taking any action
🎯 Target Zone:
• 3280 – H4 Demand
→ A clean structure-based target aligned with higher timeframe pullback
→ Our model requires minimum 1:3 RR , anchored to price structure
🔁 Key Takeaways:
• H4: Pullback phase remains intact
• M15: Downtrend confirmed (ChoCh + BoS complete)
• Execution plan: Observe 3326 POI; respond only if structure confirms again on M1
• No anticipation. No prediction. Just process.
📖 This is structure-based learning in real time.
We don’t chase setups — we observe shifts.
Let structure teach you. Let price confirm it.
The chart is the mirror.
📘 Shared by @ChartIsMirror
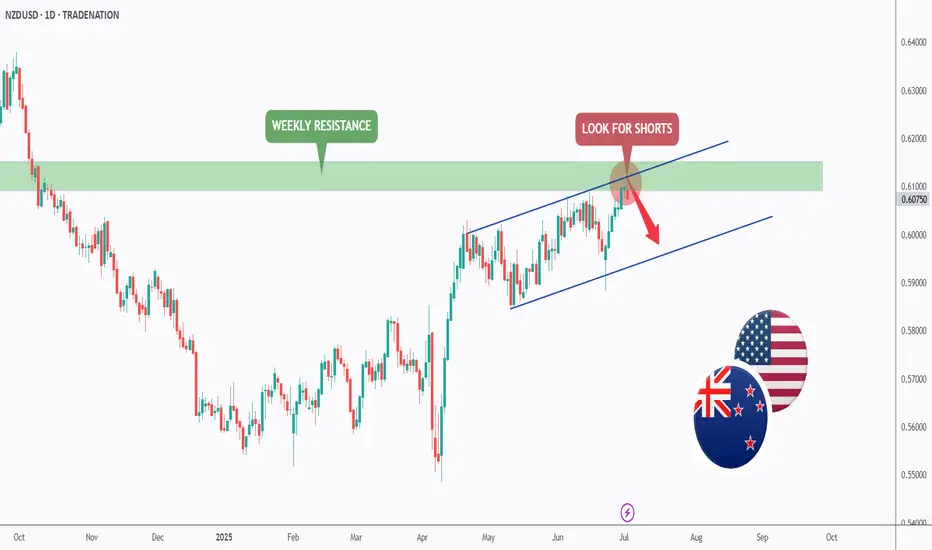
NZDUSD - The Bulls Are Exhausted! Hello TradingView Family / Fellow Traders. This is Richard, also known as theSignalyst.
📈NZDUSD has been overall bullish trading within the rising channel marked in blue and it is currently retesting the upper bound of it.
Moreover, the green zone is a strong weekly resistance.
🏹 Thus, the highlighted red circle is a strong area to look for sell setups as it is the intersection of the upper blue trendline and green resistance.
📚 As per my trading style:
As #NZDUSD is hovering around the red circle zone, I will be looking for bearish reversal setups (like a double top pattern, trendline break , and so on...)
📚 Always follow your trading plan regarding entry, risk management, and trade management.
Good luck!
All Strategies Are Good; If Managed Properly!
~Rich
Disclosure: I am part of Trade Nation's Influencer program and receive a monthly fee for using their TradingView charts in my analysis.
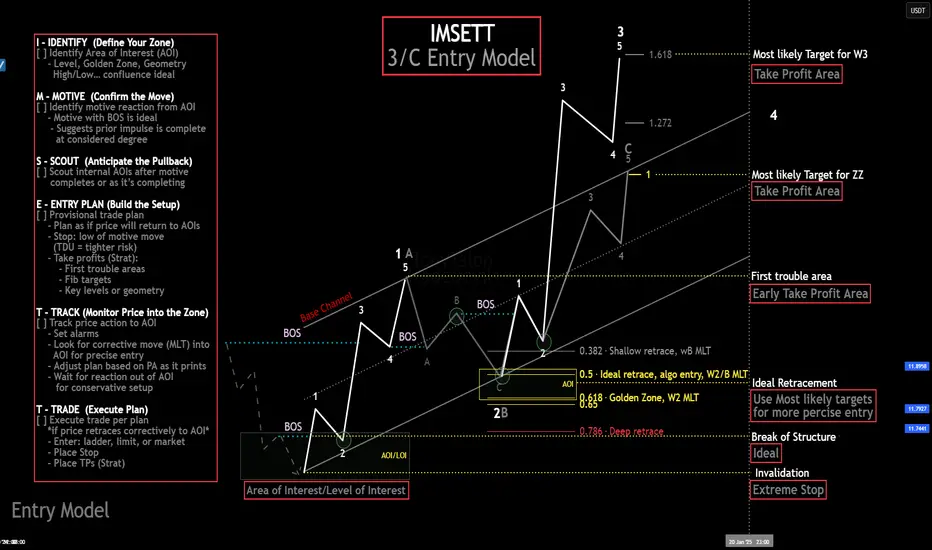
My Ideal Elliott Wave Entry ModelThe IMSETT 3/C Entry Model.
Every trader wants to catch the big moves the ones that pay quickly and decisively. In Elliott Wave, those moves often come during Wave 3. It's the strongest part of the trend, and when you're positioned early, the risk-to-reward is unmatched.
But not every opportunity hands you a clean Wave 3 on a silver platter. Sometimes you’re looking at a Wave C instead. That’s where the 3/C Entry Model comes in. It’s designed to get you aligned with high-conviction moves—whether the market is in a trend or a zig zag.
Here’s the edge: both Wave 3 and Wave C often start the same way—a strong, motive push off an AOI (area of interest), followed by a retracement. That shared structure gives us an anchor. Whether we’re labeling it a 3 or a C doesn’t change the fact that the initial impulse gives us clarity, direction, and a place to manage risk.
That’s what the IMSETT Model is built around:
Identify
Motive
Scout
Entry Plan
Track
Trade
Each step is focused, actionable, and repeatable. You're not trying to outguess the market—you’re reacting to structure, preparing for common behavior, and executing with intent.
I do have a video with a walk through.
This just the way I look for clarity in setups. As with everything in trading, nothing will work every time so do your own research this is not financial advice.
Cheers!
Trade Safe, Trade Clarity.
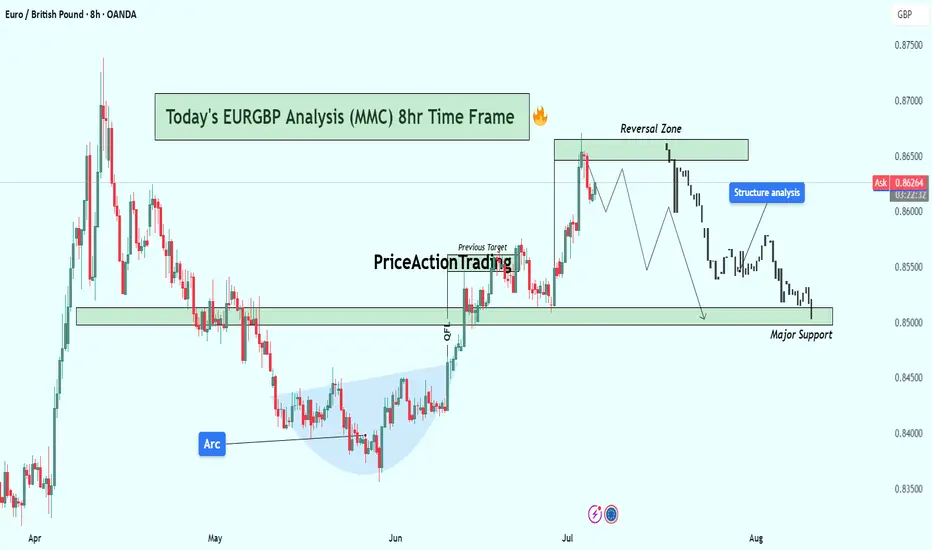
EURGBP 8H Analysis : Breakdown + Smart Money Structure + Target🧠 Phase 1: Arc Formation – Accumulation by Smart Money
The arc (May to June) reflects an accumulation base where price made higher lows with consolidative wicks and slow momentum, ideal conditions for institutional orders to build long positions.
Liquidity is swept below swing lows, stopping out early longs — this is classic smart money accumulation.
Volume compression during the arc followed by expansion on breakout confirms smart interest.
🔑 Psychology: Retail was likely selling here due to lower highs, while smart money was accumulating quietly at the bottom of the arc.
🚀 Phase 2: Breakout & Rally to Previous Highs
Price cleanly breaks above the arc’s neckline and previous resistance (labeled as Previous Target).
Momentum accelerates rapidly toward the reversal zone, likely due to stop hunts and FOMO buyers entering after confirmation.
Structure shifts bullish, creating strong impulsive candles — but these are often final exit points for smart money.
📌 Key Sign: Breakout aligns perfectly with market inefficiencies being filled, often a sign of a short-term top formation brewing.
🔄 Phase 3 : Reversal Zone – Distribution Phase
Inside the Reversal Zone (0.8650–0.8680), price shows exhaustion with multiple upper wicks and slowing bullish momentum.
Distribution signs: choppy movement, lower highs, and eventual breakdown.
Retail is often caught entering longs here on confirmation, while institutions offload their positions.
🧠 MMC Insight: This is where Mind Market Curve transitions from bullish impulse to corrective leg down — phase of deception.
📉 Phase 4: Structure Breakdown & Bearish Market Behavior
Price breaks through short-term higher low structure — confirmation of bearish intent.
The formation of lower highs and lower lows marks the beginning of a bearish trend shift.
Market is now targeting Major Support (0.8500–0.8520 zone), which is currently being tested.
🧭 If price breaks below 0.8500 with volume and aggression, next level is likely near 0.8430–0.8450.
⚖️ Current Price Location: Major Support Test
We’re at a critical decision point.
If support holds → expect a bounce to 0.8600–0.8620.
If it breaks → expect continuation to next liquidity pool below 0.8450.
This zone is where buyers and sellers will battle. Wait for:
Bullish confirmation (reversal pattern / engulfing candle) to go long.
Bearish breakout (close below zone + retest) to go short.
🔁 Summary of Scenarios
Scenario Conditions Target
✅ Bullish Bounce Rejection at support with bullish engulfing/pin bar 0.8600–0.8620
❌ Bearish Break Close below 0.8500 + retest as resistance 0.8430–0.8450
🔖 Educational Takeaway
This chart teaches how to:
Identify accumulation via arc and understand smart money behavior.
Recognize false confirmation zones (where retail enters late).
Understand structure shift as a trend reversal signal.
Execute trades based on reaction zones, not emotions.
If you follow MMC (Mind Market Curve), this is a textbook transition from:
Accumulation →
Expansion →
Distribution →
Breakdown
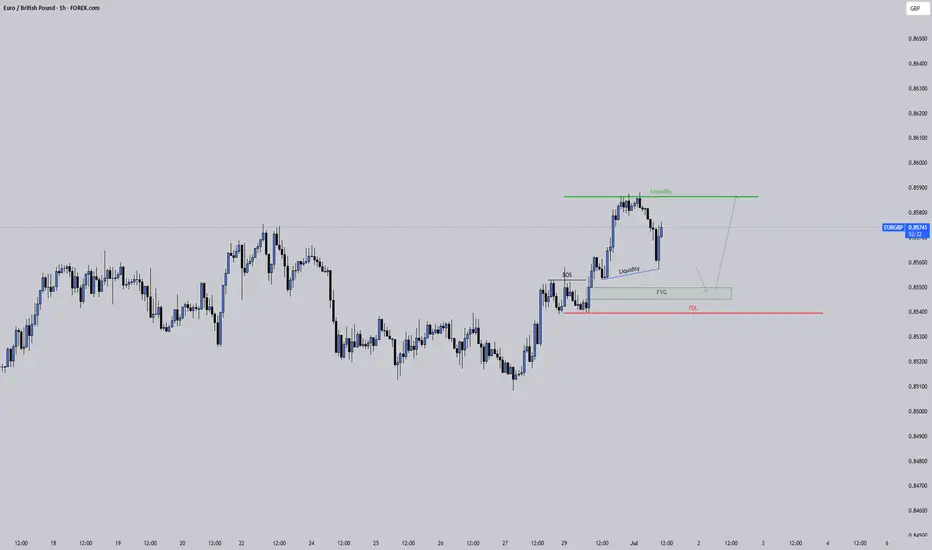
EURGBP Watching the FVG for a Possible Push HigherEURGBP has been showing a clean bullish structure on the 1 hour chart. We got a solid break of structure that left behind an imbalance and price is now pulling back.
There’s a fair value gap just above the previous day’s low and also some local liquidity resting below the last minor low. If price dips into that FVG, fills the imbalance and takes out a bit more liquidity, it could set up the next move up.
I’ll be watching how price reacts in that zone. A strong rejection could signal buyers stepping back in to target the highs and sweep the liquidity sitting above.
No need to rush. Let the market come into the level and prove itself first.
Xrp - The expected rally of +50%!Xrp - CRYPTO:XRPUSD - is still clearly bullish:
(click chart above to see the in depth analysis👆🏻)
Ever since Xrp rallied more than +550% in the end of 2024, we have been witnessing a quite expected consolidation. However Xrp still remains rather bullish and can easily retest the previous all time highs again. Maybe, we will even see another parabolic triangle breakout.
Levels to watch: $3.0, $10.0
Keep your long term vision!
Philip (BasicTrading)

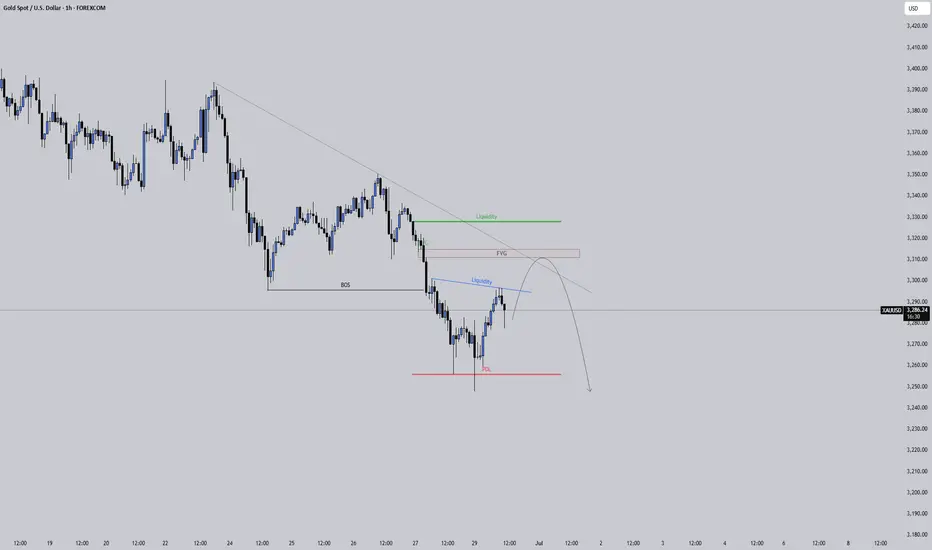
Watching Gold Tap Liquidity Before the Next DropGold is still clearly in a bearish structure on the 1 hour chart. We’ve seen a solid break of structure to the downside and price is now retracing.
What stands out is how price is pushing back up into multiple areas of interest. There’s liquidity resting just above this minor high along with a fair value gap and the underside of a bearish trendline. This cluster makes it a likely spot for sellers to step back in.
If price fills the imbalance around that FVG, it could set up the next leg lower. I’ll be watching closely for signs of rejection in this zone to see if the market is ready to continue the move down.
No reason to rush in early. Let price come to the levels that matter and confirm with a reaction. Staying patient pays.
EURJPY ANALYSISAfter seeing the previous weekly candle close bullish confirming buying strength and it could continue into weekly highs and confluences on the daily and the 4hr suggest that too

EURCAD: The Buy Might Be Hidden in the GapEURCAD just cleared out some liquidity at the highs and is now pulling back into an interesting zone. The bullish structure is still intact, and price has left behind a clean fair value gap right above the previous day’s low.
This zone is where I’m watching closely.
If price taps into that FVG and gives a strong reaction, we could see another leg to the upside. But no need to jump in blindly. Let the 15-minute timeframe show a change of character first.
If that shift happens, I’ll be looking for entries back toward the highs.
Let price come to you. Let structure guide you.
Amd - This is just the beginning!Amd - NASDAQ:AMD - perfectly plays out:
(click chart above to see the in depth analysis👆🏻)
Despite the harsh drop of about -65% which we have been witnessing starting back in 2024, Amd remains bullish. Just three months ago, Amd retested a textbook confluence of support. We saw bullish confirmation, the bottom is in and Amd will rally significantly from here.
Levels to watch: $200, $300
Keep your long term vision!
Philip (BasicTrading)

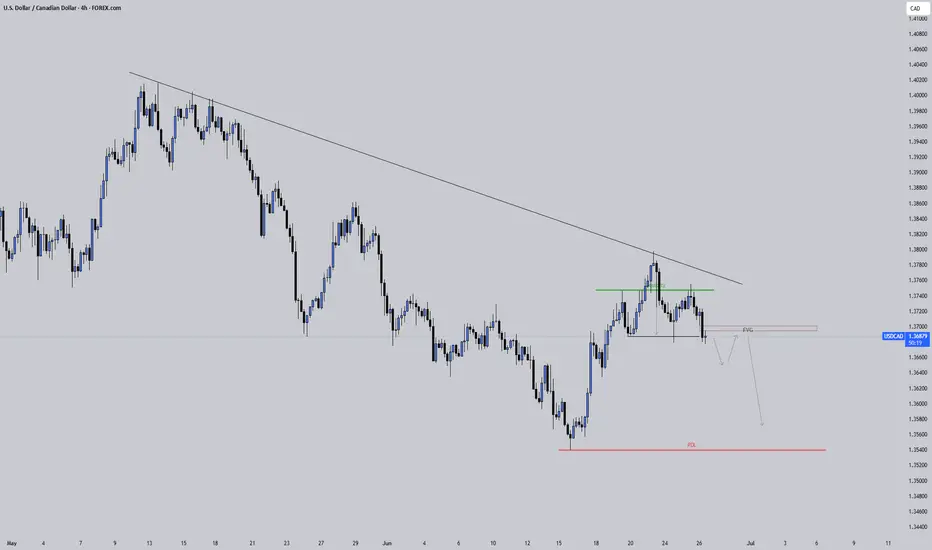
USDCAD: If This Breaks, USDCAD Might Be Lining Up a Smooth DropUSDCAD tapped into a clear liquidity zone and showed signs of weakness at the top. Price is now hovering near a potential break of structure, and a fair value gap has formed just above.
If we get that break, the idea is to wait for price to retrace into the FVG, then look for a clean continuation to the downside.
There’s also a bearish trendline holding well, adding pressure to the move. On top of that, a head and shoulders pattern is forming, another clue that momentum could be shifting lower.
No need to rush. Let the break happen. Let price return. Then act.
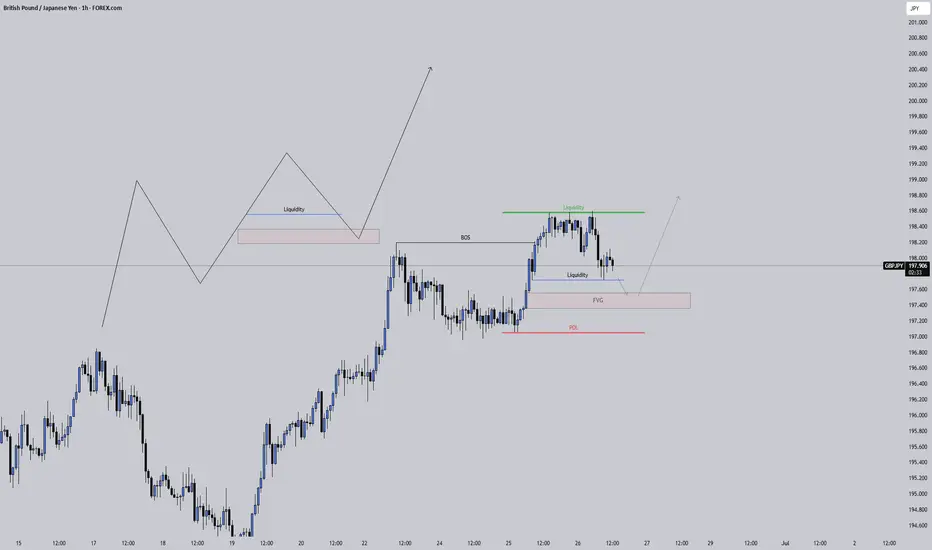
GBPJPY: Let It Come Lower Before It Goes HigherGBPJPY swept the highs, broke structure, and is now giving signs of a clean retracement. There’s a visible FVG just below, and a small liquidity pocket that hasn’t been touched yet.
If price drops into that zone and respects it, we could see a strong bounce that takes us right back into the highs and beyond.
This setup looks like a simple buy-the-dip scenario , but only if the zone reacts cleanly. No rush. Let price come down. Watch for confirmation before thinking long.
Don’t chase it. Let it unfold.
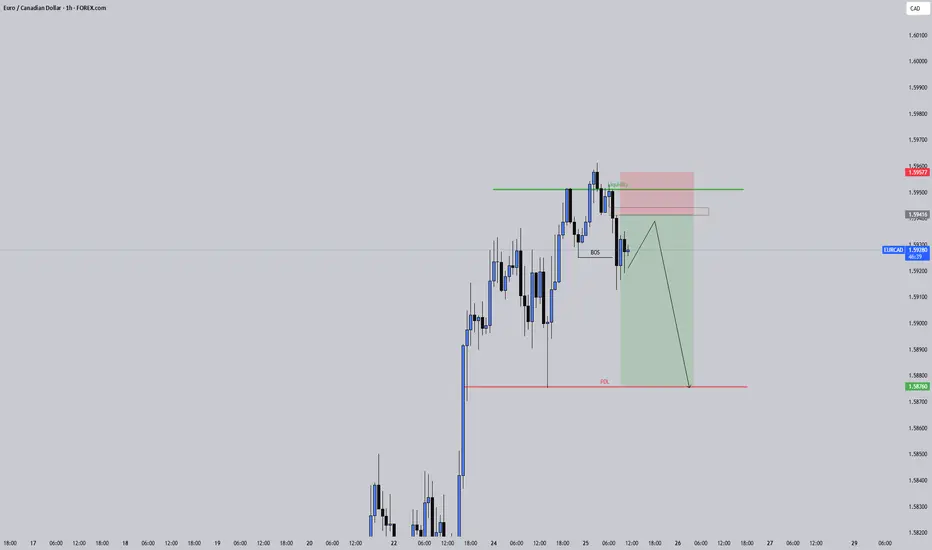
EURCAD: The Reaction Was Clean But The Drop Might Be CleanerEURCAD just gave a textbook reaction from a liquidity grab followed by a clean break of structure. After taking out the highs and filling the upper imbalance, price is reversing right back into a bearish FVG.
If price respects it, the downside continuation becomes even more likely.
This setup is simple and clear. Let the market pull into the zone and watch how it reacts. If momentum shifts again, the path down toward previous lows could be smooth.
Be patient. Let price come to you. No need to force entries. Wait for the lower timeframes to confirm the shift before making any move.
Bitcoin - We have to see new highs now!Bitcoin - CRYPTO:BTCUSD - is now at the previous highs:
(click chart above to see the in depth analysis👆🏻)
It could really not be more exciting on Bitcoin at the moment. With the current "all or nothing" potential breakout or double top creation, we will either see a bullrun or a bear market. So far, bulls are still strong, so the chances of a breakout luckily remain higher.
Levels to watch: $100.000
Keep your long term vision!
Philip (BasicTrading)

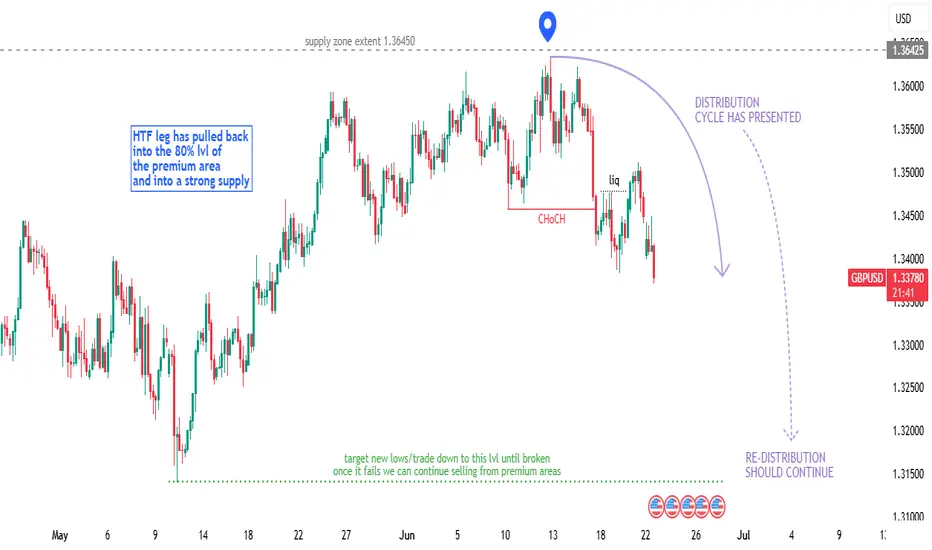
GBPUSD - Technical Outlook (Long + Short Term)In this article, I’ll share my current outlook on GBPUSD, highlighting both higher time frame (HTF) and intraday considerations.
Higher Time Frame Analysis
The overall trend remains bearish. Price is still trading within the previous structural leg, with the key level at 1.42500. Unless we see a decisive break above this level, my bias will remain bearish for this pair.
Recently, we’ve witnessed what looks like institutional manipulation to the upside, followed by a sharp bearish reaction from the weekly supply zone. This price action aligns with a classic Wyckoff distribution cycle, which often signals that the prevailing trend is likely to continue.
Intraday Advice
For short-term traders, it’s best to wait for lower time frame (LTF) pullbacks and signs of manipulation before considering short positions. If price continues to push lower, there should be opportunities to ride the trend down over the coming weeks, with multiple entry points along the way.
Trading Considerations
If this analysis plays out, there’s potential to maximize gains through both swing and intraday trades. However, patience and risk management are key. Losses are inevitable - what matters is managing risk and staying disciplined.
Key Points to Remember:
Wait for clear pullbacks before entering trades.
Stick to your risk management plan.
Stay patient and let the market come to you.
This is an exciting time to trade FX:GBPUSD , but always assess if the risk is worth the reward before entering any position.
Happy hunting predators...
Apex out!
GBPUSD London Session | Live Forex Analysis & Trade ideasIn today’s London session, we conducted a detailed intraday analysis on the GBPUSD currency pair using wave structure analysis on the 5-minute (M5) timeframe.
Price action confirmed a break below bullish market structure that had previously formed the Asian session high, signalling a potential shift in market sentiment to the downside. This breakdown confirmed short-term bearish momentum shift.
Following the completion of the bearish wave, the price retraced to form a structural pullback (trend reset), providing a discounted price zone for new short positions and offering profit-taking opportunities for earlier sellers.
Our trading plan for this session is to sell GBPUSD at 1.3488, anticipating a move below the midline (ML) support at 1.3462. The technical target for this trade, based on our London-New York session projection, is set at 1.3417.
The stop-loss for this setup is placed above MH of the bearish structure at 1.3505, maintaining proper risk management.
This trade idea aligns with our trend-following strategy and is supported by real-time price action analysis.
📉 Short Bias Confirmed
🎯 Entry: 1.3488
🛑 Stop Loss: 1.3505
✅ Take Profit: 1.3417
Trade safe, manage your risk, and stay blessed.
