Bank of India Breakout BK of India is very crucial level if stock break the pattern and close the candle with good strength.
We will see a good price movement in upcoming Days [/
Always do your own Analysis first
Marketstructure

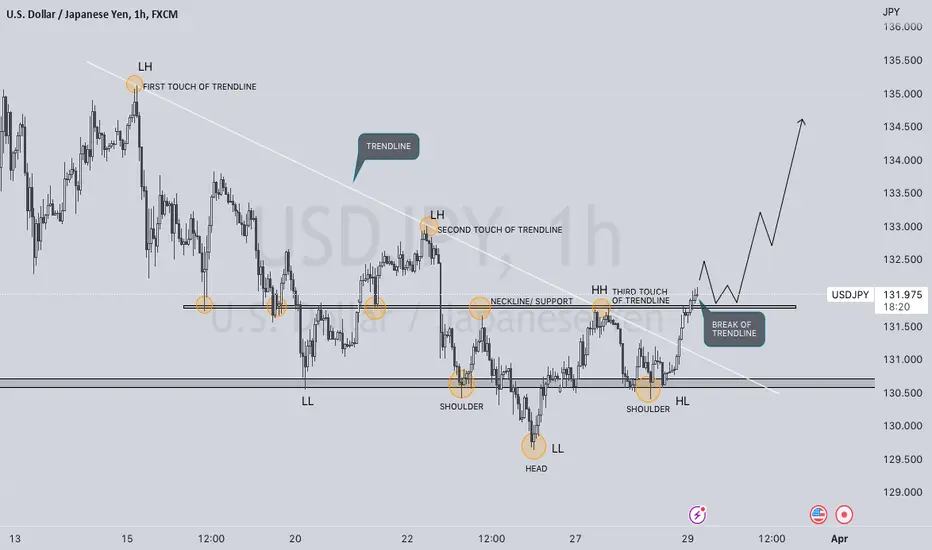
BUY ANALYSIS ON USDJPYThere are multiple confirmations for this buy trade. Firstly we have the change in market structure. secondly, we have the inverse head and shoulder pattern. Thirdly, we have the break out of the trend line after 3 touches. We can also see price try to break the support zone but it could not. So therefore, we await the retest of the trend line before we go long. Thank you
AUDJPY - Video Top-Down Analysis!Hello TradingView Family / Fellow Traders. This is Richard, also known as theSignalyst.
Here is a detailed update top-down analysis for AUDJPY .
Which scenario do you think is more likely to happen? and Why?
Always follow your trading plan regarding entry, risk management, and trade management.
Good Luck!.
All Strategies Are Good; If Managed Properly!
~Rich

BTC - Different Perspectives 🏹Hello TradingView Family / Fellow Traders. This is Richard, also known as theSignalyst.
📌 on Daily: Left Chart
BTC is currently bullish trading inside the red rising broadening wedge pattern.
Here is why the 30,000 is a strong rejection:
1- Round number => 30,000
2- Classic Support Zone Turned Resistance from Weekly timeframe
3- Supply zone marked on the chart
4- Intersecting with the upper red trendline acting as a non-horizontal resistance
📉 Hence, as BTC approaches the 30k - 32k zone, we will be expecting the bears to take over for a medium-term correction.
📌 on H4: Right Chart
For now, we will remain bullish as long as BTC doesn't break a previous major low.
The current last major low is highlighted in gray around 26,700
📉 If we break below 26,700 expect a bearish correction to start till around 25,000 support / demand.
Which scenario do you think is more likely to happen first? and why?
📚 Always follow your trading plan regarding entry, risk management, and trade management.
Good luck!
All Strategies Are Good; If Managed Properly!
~Rich
Narrow Range Trading and Potential Bearish TurnBitcoin has been trading in a narrow range, prompting some investors to consider putting their money into altcoins. The cryptocurrency is currently experiencing resistance at around $28,300 to $28,700, while the support level is at $26,800 to $27,000.
Bitcoin has faced some significant resistance in recent times, with a flush-out attempt on order block clearing. This is a sign that the cryptocurrency may be in for a bearish turn, and we could see a retest of recent support structures at 26,300, 25,400, and 24,700.
On the 4-hour timeframe, it is clear that the moving averages have spread out too quickly and too fast. Although MAs are not always the most reliable indicator for analyzing crypto prices, the underlying reasons suggest that there is more downside potential for Bitcoin. As a result, more money may be stuck on the downside in long orders, which will need to be picked up before there can be any further upward momentum.
Note that the Hourly EMA 50 for Bitcoin is currently at 27667. This could be an important level to watch for traders and investors who use technical analysis, as the EMA 50 can be a key indicator of short-term price movements. If the price of Bitcoin stays above this level, it could be seen as a bullish signal, whereas a drop below this level could suggest bearish momentum. However, it is important to note that technical analysis should always be used in conjunction with fundamental analysis and other factors that can impact the price of cryptocurrencies.
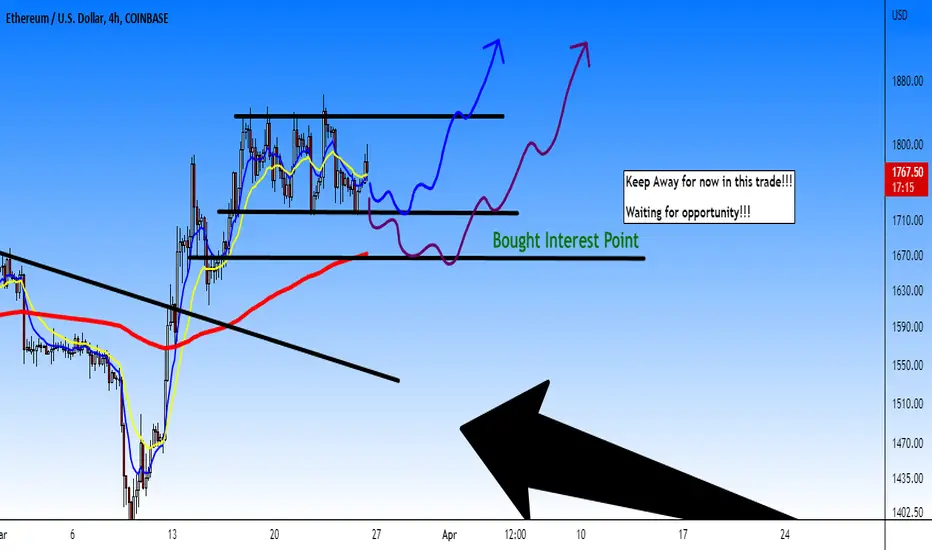
ETH/USD; waiting for opportunity to buyEthereum price look in the interesting scenario in H4 timeframe to buy in two points that I'm watching, and following this both scenario and model that I draw using blue arrow and purple arrow as model and trayectory to see in the next hours.
Meanwhile, we need to monitoring in Daily timeframe to know if Ethereum will still in this range that becoming a market trap and down to the $1,550 USD approx. But now, I will keep away of this trade and watching in the next hours if we see a good opportunity to long Ethereum.
Keep pending1!!
Weekly analysis USDJPY.For this week I like to share about USDJPY ideas. We clearly can see the structure still move like a normal market. Lower High, Lower Low. I expect the price will do Lower High at level that I'll markup. But, we must be neutral in the market. Don't blindly entry without any PRICE ACTION. Don't take this analysis as signal.
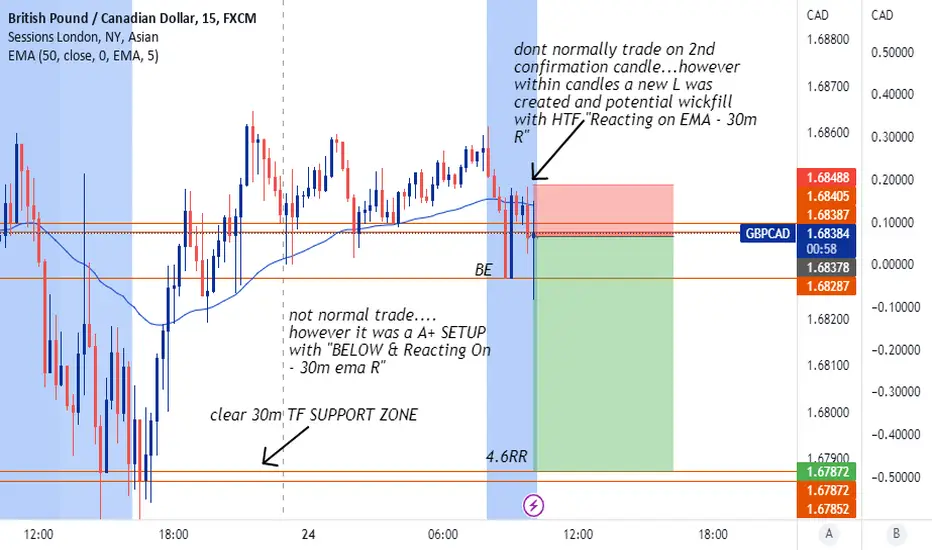
GBP/CAD Short - MARCH RECAPGREAT A+ SETUP:
Not the normal setup would take in P.A - always looked for 1st bearish candle if it was a sell but in this case I entered on the 2nd bearish candle - good RR and M.S - price is below and reacting on EMA - creating 30m dynamic R
NAS100As an investor and financial analyst, I am excited to share my latest analysis of the Nasdaq 100, along with my predictions for future trend changes based on a thorough analysis of supply and demand.
In my analysis, I have carefully examined the current market conditions, closely assessing various economic factors, including the performance of the top 100 companies listed on the Nasdaq stock exchange. My analysis is highly comprehensive, incorporating a range of technical and fundamental indicators to give an all-encompassing view of the market.
Based on this analysis, I have come to some exciting conclusions about the upcoming trend changes in the Nasdaq 100. My investigation of the supply and demand trends of the market reveals interesting patterns and developments that suggest a positive shift in the short term. I believe that the market is set for a major uptick, with several key stocks poised for a period of sustained growth.
If you're looking to stay ahead of the game in the fast-moving world of finance, then look no further. My analysis presents a unique insight into the market, shedding light on important trends, dynamics, strengths, and looming challenges in the coming quarters, on which you can lean to make informed trade decisions. Stay tuned for some game-changing intel!
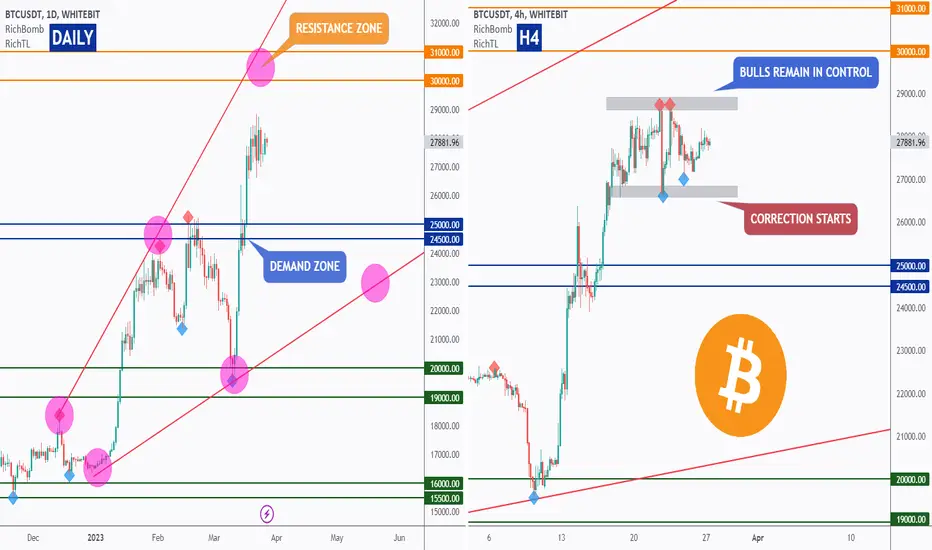
BTC - Still Bullish - For Now! ⏰Hello TradingView Family / Fellow Traders. This is Richard, also known as theSignalyst.
🗒 After rejection the 20,000 round number, BTC broke above the last major high in gray, and have been bullish since then.
We will remain bullish as long as BTC doesn't break a previous major low.
The current last major low is highlighted in gray around 26,700
📌 If we break below 26,700 expect a bearish correction to start till around 25,000 support.
🏹 Meanwhile, we are still bullish and the bulls would take full control again by breaking above the current minor high in gray around 28,500
In this case, a movement till the 30,000 weekly supply zone is expected.
Which scenario do you think is more likely to happen first? and why?
📚 Always follow your trading plan regarding entry, risk management, and trade management.
Good luck!
All Strategies Are Good; If Managed Properly!
~Rich

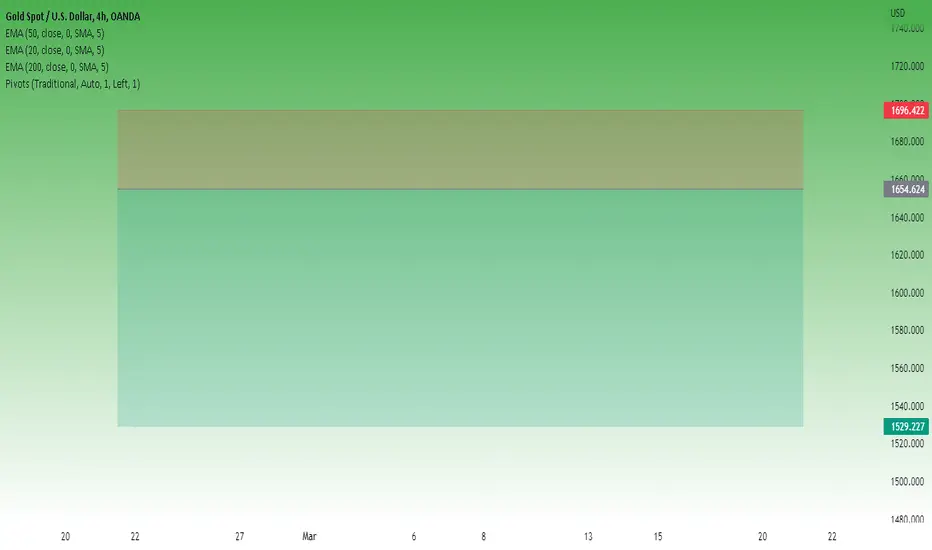
GOLD : How to trade with Rsi IndicatorOANDA:XAUUSD
What Does RSI Mean?
The relative strength index (RSI) measures the price momentum of a stock or other security. The basic idea behind the RSI is to measure how quickly traders are bidding the price of the security up or down. The RSI plots this result on a scale of 0 to 100.
Readings below 30 generally indicate that the stock is oversold, while readings above 70 indicate that it is overbought. Traders will often place this RSI chart below the price chart for the security, so they can compare its recent momentum against its market price.
How do you trade effectively with RSI?
The common levels to pay attention to when trading with the RSI are 70 and 30. An RSI of over 70 is considered overbought. When it below 30 it is considered oversold. Trading based on RSI indicators is often the starting point when considering a trade, and many traders place alerts at the 70 and 30 marks.
KEY TAKEAWAYS
The relative strength index (RSI) is a popular momentum oscillator introduced in 1978.
The RSI provides technical traders with signals about bullish and bearish price momentum, and it is often plotted beneath the graph of an asset’s price.
An asset is usually considered overbought when the RSI is above 70 and oversold when it is below 30.
The RSI line crossing below the overbought line or above oversold line is often seen by traders as a signal to buy or sell.
The RSI works best in trading ranges rather than trending markets.

GOLD : What Should Be Ideal Risk Reward Ratio OANDA:XAUUSD
A good risk/reward ratio could be seen as greater than 1:3,
where you would risk 1/4 of the overall potential profit.
For trading to prove profitable in the long term, a trader should not typically risk their capital for a lower risk/reward ratio,
as this will mean that half or more of their investment could be lost.
The risk/reward ratio marks the prospective reward an investor can earn for every dollar they risk on an investment. Many investors use risk/reward ratios to compare the expected returns of an investment with the amount of risk they must undertake to earn these returns. A lower risk/return ratio is often preferable as it signals less risk for an equivalent potential gain.
Consider the following example: an investment with a risk-reward ratio of 1:7 suggests that an investor is willing to risk $1, for the prospect of earning $7. Alternatively, a risk/reward ratio of 1:3 signals that an investor should expect to invest $1, for the prospect of earning $3 on their investment.
Traders often use this approach to plan which trades to take, and the ratio is calculated by dividing the amount a trader stands to lose if the price of an asset moves in an unexpected direction (the risk) by the amount of profit the trader expects to have made when the position is closed (the reward).
KEY TAKEAWAYS
The risk/reward ratio is used by traders and investors to manage their capital and risk of loss.
The ratio helps assess the expected return and risk of a given trade.
In general, the greater the risk, the greater the expected return demanded.
An appropriate risk reward ratio tends to be anything greater than 1:3.

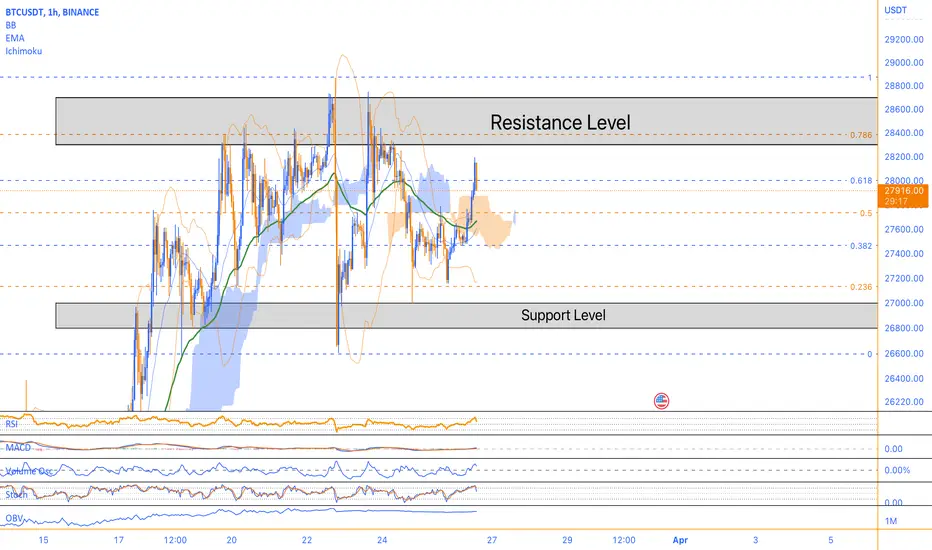
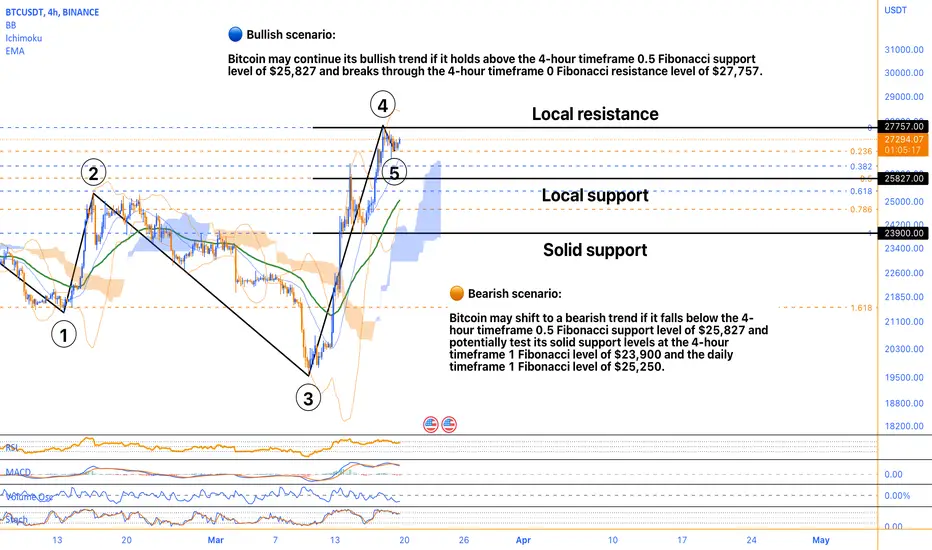
Bitcoin's Battle! Bulls vs. Bears! (TA - FA)Bitcoin is currently trading at $27,280, which is near the upper Bollinger band of the 4-hour timeframe. This indicates that Bitcoin is trading at a relatively high price compared to its recent price range, and it may face some resistance at this level. The RSI of 56 is in the neutral zone, indicating that Bitcoin is neither overbought nor oversold.
The Fibonacci retracement levels of the 4-hour timeframe are also important to consider. The 0.5 Fibonacci level at $25,827 may act as a support level if Bitcoin faces a price correction, while the 1 Fibonacci level at $23,900 may act as a stronger support level. On the other hand, the 0 Fibonacci level at $27,757 may act as a resistance level if Bitcoin continues to rise.
The volume oscillator of -18% suggests that the trading volume of Bitcoin has decreased recently, which may indicate a lack of interest from traders. However, the MACD of 792 is in positive territory, which suggests that the momentum of Bitcoin's price is currently bullish. The Stochastic oscillators of 75 also indicate that Bitcoin is currently in a bullish phase.
The 4-hour EMA 50 of $25,042 may act as a support level if Bitcoin faces a price correction. This is also near the 0.5 Fibonacci level, which strengthens the support level. The middle Bollinger band of the 4-hour timeframe at $26,563 may also act as a support level.
On the daily timeframe, the Fibonacci retracement levels are also important to consider. The 0.5 Fibonacci level at $22,399 may act as a strong support level if Bitcoin faces a significant price correction, while the 1 Fibonacci level at $25,250 may act as an even stronger support level. The daily timeframe also suggests that Bitcoin has been in a bullish trend since it broke above the 0 Fibonacci level at $19,549.
The recent news that Bitcoin's market dominance has hit a 9-month high as altcoins turn red is also worth considering. This indicates that Bitcoin is currently outperforming other cryptocurrencies in terms of market capitalization. However, this could also indicate a potential shift in the cryptocurrency market, as investors may be moving away from altcoins and towards Bitcoin.
Bullish scenario:
If Bitcoin continues to hold above the 4-hour timeframe 0.5 Fibonacci support level of $25,827 and the daily timeframe 0.5 Fibonacci support level of $22,399, it may continue its bullish trend. In this scenario, Bitcoin may break through the 4-hour timeframe 0 Fibonacci resistance level of $27,757 and the 4-hour timeframe upper Bollinger band of $28,418. The MACD of 792 and Stochastic oscillators of 75 both suggest that Bitcoin's momentum is currently bullish, and if these indicators remain positive, Bitcoin may continue to rise and potentially reach new highs.
In conclusion, Bitcoin is currently trading at a relatively high price compared to its recent price range, and it may face some resistance at the upper Bollinger band of the 4-hour timeframe. However, the momentum of Bitcoin's price is currently bullish, and there are several support levels that may prevent a significant price correction. The recent news of Bitcoin's market dominance may also have an impact on its future price movements.
Bearish scenario:
If Bitcoin falls below the 4-hour timeframe 0.5 Fibonacci support level of $25,827 or the daily timeframe 0.5 Fibonacci support level of $22,399, it may indicate a potential shift to a bearish trend. In this scenario, Bitcoin may face resistance at the 4-hour timeframe 0 Fibonacci resistance level of $27,757 and potentially even the 4-hour timeframe middle Bollinger band of $26,563. The volume oscillator of -18% and the recent news of Bitcoin's market dominance hitting a 9-month high as altcoins turn red suggest a lack of interest from traders and a potential shift away from altcoins to Bitcoin. If these indicators remain negative, Bitcoin may continue to fall and potentially test its solid support levels at the 4-hour timeframe 1 Fibonacci level of $23,900 and the daily timeframe 1 Fibonacci level of $25,250.
P2P | Deep Dive Into My SetupsHello family! Sending you all love and light today.
So I wanted to do an in-depth video about my style of attacking the markets now. I unlocked a new way to view my trades and I believe it just leveled up my confidence a TON!
So I will keep this description brief and go along with the day.
Thank you guys and gals, lets keep making it happen on trade at a time!

EURAUDAs a student of SMC, there might be a reversal probably by next week.
Divergence happening
market structure formed
major down trend
let's see how the price will react next week. If you have any idea or suggestions, drop a comment down below.
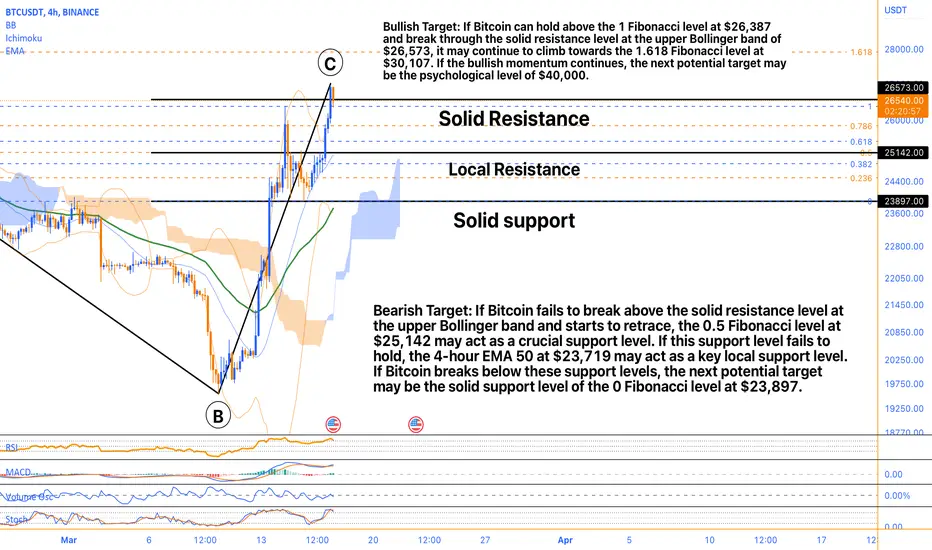
Potential Targets for Bullish and Bearish ScenariosBitcoin's current price is $26,600, trading above the 0.5 Fibonacci level of $25,142 and close to the upper Bollinger band of $26,573, which may act as solid resistance. However, the 4-hour EMA 50 at $23,719 is a crucial local support level, while the 0 Fibonacci level at $23,897 is a solid support level that has not been tested recently.
The RSI is high at 74, indicating that the asset may be overbought. However, the MACD is bullish at 886, while the stochastic oscillator is at 87, which suggests that there may still be potential for further upside movement.
Bitcoin has already surpassed the 1 Fibonacci level at $26,387, and if it can hold above this level, it may continue to climb toward the 1.618 Fibonacci level at $30,107. Nevertheless, it is crucial to monitor the support levels, as the asset may retrace from the current resistance levels.
The Bollinger bands are another critical indicator to watch. The lower band is at $23,606, which may offer support if the price begins to drop. The middle band at $25,087 can act as a pivot point for traders, and a breakout above or below this level may signal a change in the asset's price movement.
The volume oscillator is currently negative at -5.91%, indicating lower trading activity than previous periods. However, this may change if there is a significant price movement.
Recent news has highlighted that 74% of Bitcoin holders are currently in the money as the asset's price has exceeded $26,000. This suggests that there may be a higher level of confidence among Bitcoin investors, which may further drive the price higher. Moreover, there is speculation that Bitcoin is gearing up for a bullish weekend, which may lead to increased buying pressure and further price appreciation.
In summary, Bitcoin's technical indicators and recent news suggest that the asset may continue to climb higher, although traders should keep an eye on potential resistance levels and support levels for potential trading opportunities and risk management.
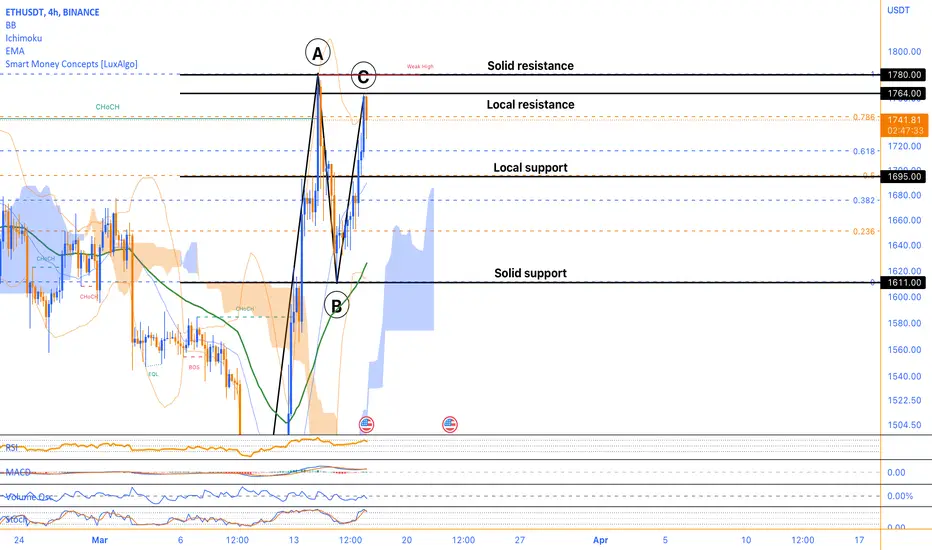
Riding the Bull, Key Support and Resistance LevelsLooking at the Ethereum chart, there are a few key prices that traders should keep an eye on. The current price is $1737, and technical indicators such as the RSI and stochastic oscillator suggest that the asset is currently in a bullish trend. The MACD is also positive, which indicates a strong momentum behind the asset's price movement.
However, there are also potential levels of support and resistance that traders should be aware of. The 0 Fibonacci level at 1611 could be a solid support level for the asset, as it is a significant Fibonacci retracement level. Additionally, the 0.5 Fibonacci level at 1695 could act as a local support level if the price were to experience any dips.
On the other hand, there are also potential levels of resistance to consider. The 1 Fibonacci level at 1780 could act as a solid resistance level for the asset, as it is a significant Fibonacci retracement level and close to the upper Bollinger band at 1764. Additionally, the upper Bollinger band could be a local resistance level to watch.
It is worth noting that the lower Bollinger band at 1615 could provide another level of support for the asset, while the middle Bollinger band at 1689 could provide an indication of the current price range. Furthermore, the volume oscillator is at -10%, which is not a strong indicator either way but is still worth considering.
In conclusion, traders should keep an eye on the potential levels of support and resistance, as well as the technical indicators, to make informed trading decisions. As always, risk management should be a priority to minimize potential losses.
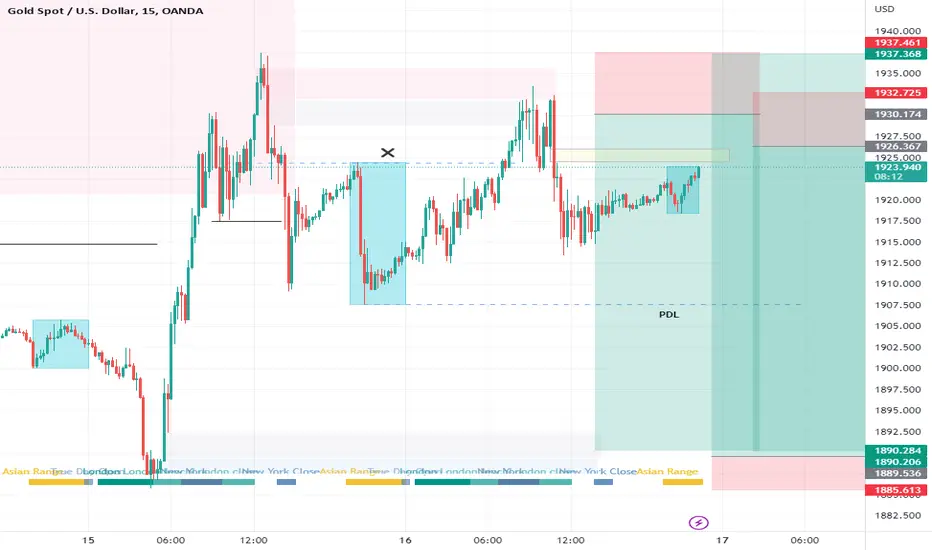
Sell XAUUSD Looking for additional sell re-entry after yesterday's sell from my earlier post. Once price retraces up to balance out the FVG, will look for a confirmation move down to sell.
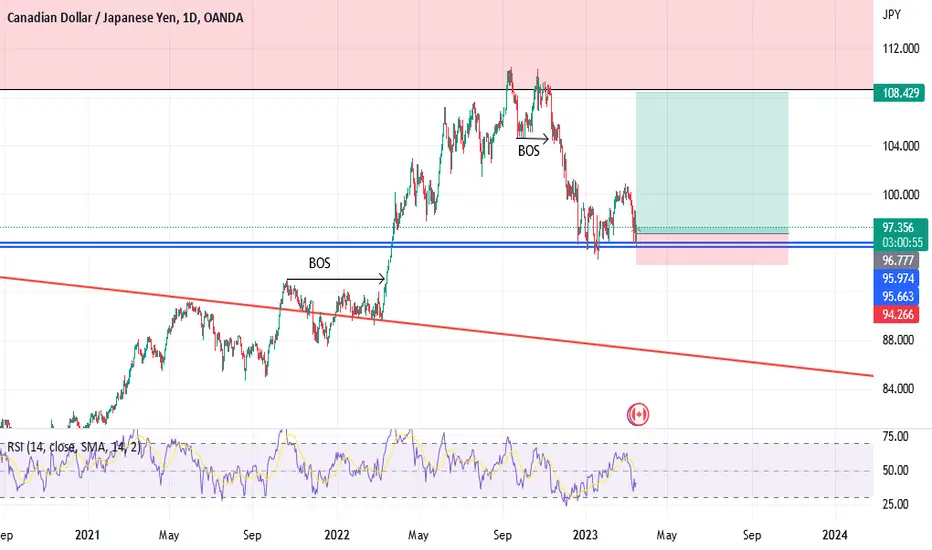
CADJPYThis will be my trade for CADJPY as the current market had made a new pattern on the chart. As a student of SMC, there is a break of structure, and it has a strong rejection on the OB. it may reverse from here. let's see how the price shall react.
if you do have any idea or suggestion, leave down your comment. let's discuss about it
A Deep Dive into Bitcoin's Technical Analysis and News ImpactBitcoin's current price is $24700, and it's being analyzed over a 4-hour timeframe. The Relative Strength Index (RSI) is 64, indicating that the cryptocurrency is in slightly overbought territory but still has some room to grow. The Volume oscillator is -8.52%, which indicates lower trading volume than average. The Moving Average Convergence Divergence (MACD) is currently at 1010, which indicates that the bullish momentum is strong, but it could turn into a bearish one if the trend reverses.
On the technical side, the 4-hour timeframe Fibonacci retracement levels suggest that Bitcoin's support levels are at 0.5 Fibonacci level of $22967 and 1 Fibonacci level of $19549, and resistance levels are at 0 Fibonacci level of $26386 and upper Bollinger band of $26813. The lower Bollinger band of $19820 is acting as strong support. The middle Bollinger band of $23317 indicates the average price level.
Bitcoin is facing a sharp correction in its price. The Paxful founder called the recent pump to $26000 as weak, indicating that it could be a bubble. On the other hand, a South Korean trader lost almost $1 million by shorting Bitcoin.
Based on the technical analysis, it seems that the current price of Bitcoin is likely to experience some resistance at the 0 Fibonacci level of $26386 and the upper Bollinger band of $26813. It may also find some support at the 0.5 Fibonacci level of $22967 and the lower Bollinger band of $19820. The sharp correction could have contributed to the lower trading volume indicated by the volume oscillator. The Paxful founder's statement may have added to the bearish sentiment, but the strong bullish momentum indicated by the MACD and Stochastic oscillators suggests that the current price drop may not last for long.
Regarding opening long or short positions, it depends on an individual's trading strategy and risk tolerance. However, here are some possible scenarios:
Long position: If the price bounces off the strong support levels and starts to move upwards, it could be a good spot to open a long position. Additionally, if the price breaks above the strong resistance levels with strong momentum, it could also be an opportunity to open a long position.
Short position: If the price breaks below the strong support levels with strong momentum, it could be a good spot to open a short position. Additionally, if the price reaches strong resistance levels and shows signs of rejection or reversal, it could also be an opportunity to open a short position.
It's essential to keep in mind that any trading decision should be made with proper risk management techniques in place, such as setting stop-loss orders and taking profits at predetermined levels. Additionally, traders should keep an eye on any relevant news or events that could impact the price of Bitcoin.

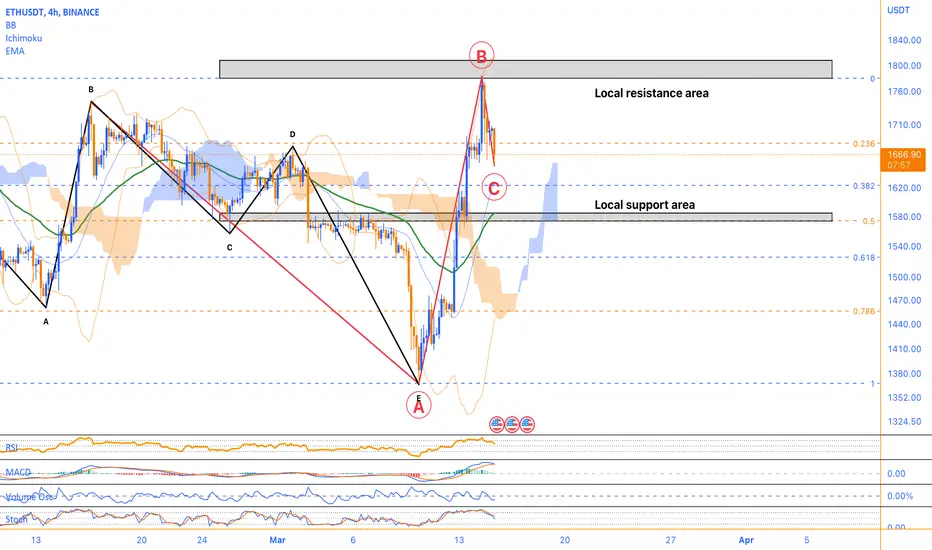
Riding the WavesLooking at the current price of Ethereum, it is trading at $1666, which is below the upper Bollinger band of $1808 but above the 4-hour EMA 50 of $1585. The RSI of 57.72 indicates that Ethereum is currently in a neutral zone and not overbought or oversold. However, the volume oscillator of -14.66% suggests that there is a lack of interest in the market, which could be a concern.
Despite the lack of interest in the market, Ethereum's MACD of 53.32 and Stochastic oscillator of 48.40 suggests that the price is in an uptrend. This could be good news for investors looking to open long positions. Additionally, the news article predicting that Ethereum's price could reach $1800 in the near future further supports the bullish sentiment.
Looking at the Fibonacci levels, Ethereum has strong support at the 0.5 Fibonacci level of $1574. If the price were to drop below this level and rebound, it could be a good spot for traders to open long positions with a stop-loss below the support level. On the other hand, if Ethereum breaks above the upper Bollinger band of $1808 with strong bullish momentum, it could be a good spot to open long positions with a stop-loss above the resistance level.
It is also important to consider the solid support level at the 1 Fibonacci level of $1368. This level could be a good spot for long-term investors to accumulate more Ethereum in case of a price decline. Additionally, traders should keep an eye on the psychological level of $2000, which could act as a solid resistance level. Breaking above this level could indicate a strong bullish trend and a good opportunity to open long positions.
In summary, Ethereum's current price, RSI, and volume oscillator suggest a neutral market sentiment, but the MACD and Stochastic oscillator indicates an uptrend. Traders should consider the support and resistance levels mentioned above when opening positions, and investors may want to accumulate more Ethereum at the solid support level of $1368. Keeping an eye on the psychological resistance level of $2000 is also important for traders.
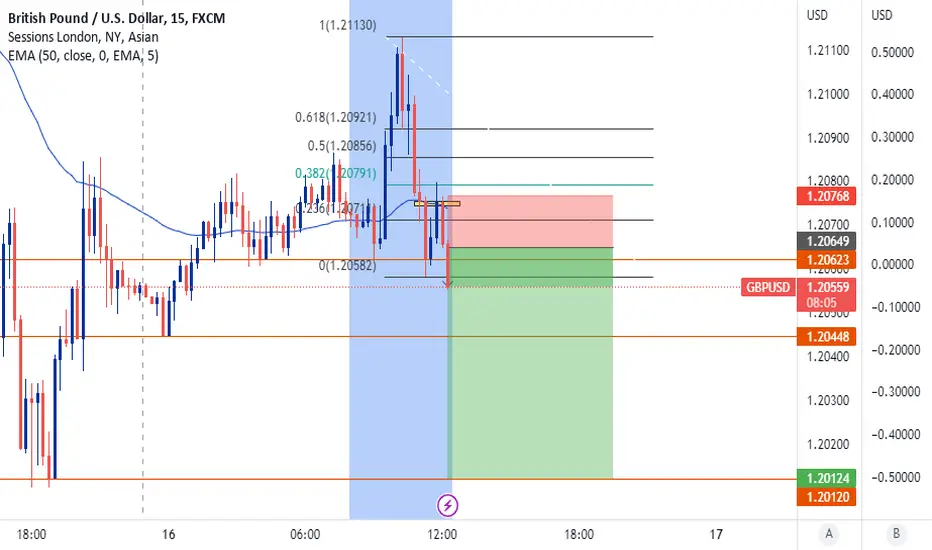
GBP/USD Short - MARCH RECAPGreat A+ SETUP
Price created a L, looked for a RT towards EMA as added dynamic R - decent 4RR & P.A with bearish engulfing candle...Will monitor the trade !