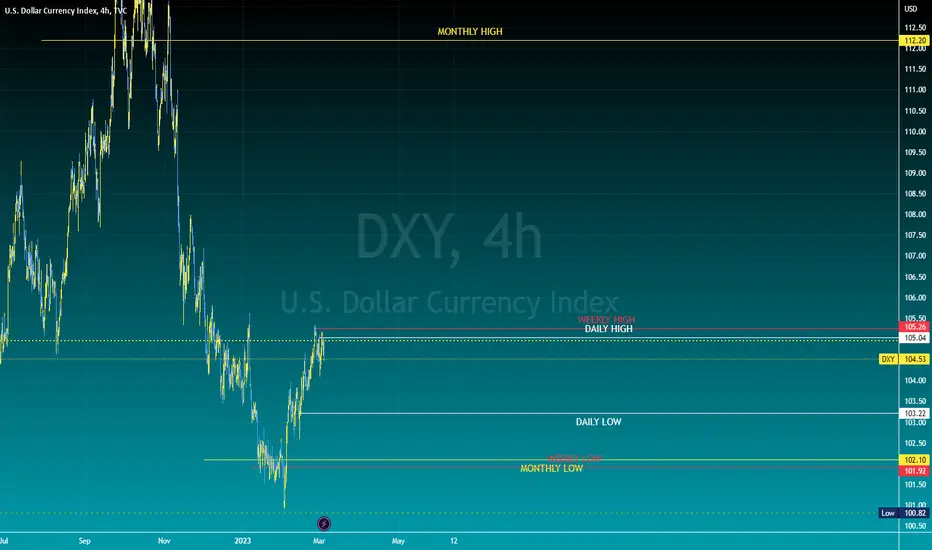
DXY$DXY After top down analysis i'm looking for DXY to continue to the downside after Fridays retracement.
Disclaimer: This is not trade advice. Trading foreign currencies, stocks, indices, etc can be a challenging and potentially profitable opportunity for investors. However, before deciding to participate in the financial markets, you should carefully consider your investment objectives, level of experience, and risk appetite. Most importantly, do not invest money you cannot afford to lose!!!
Good luck and Happy trading!
Marketstructure
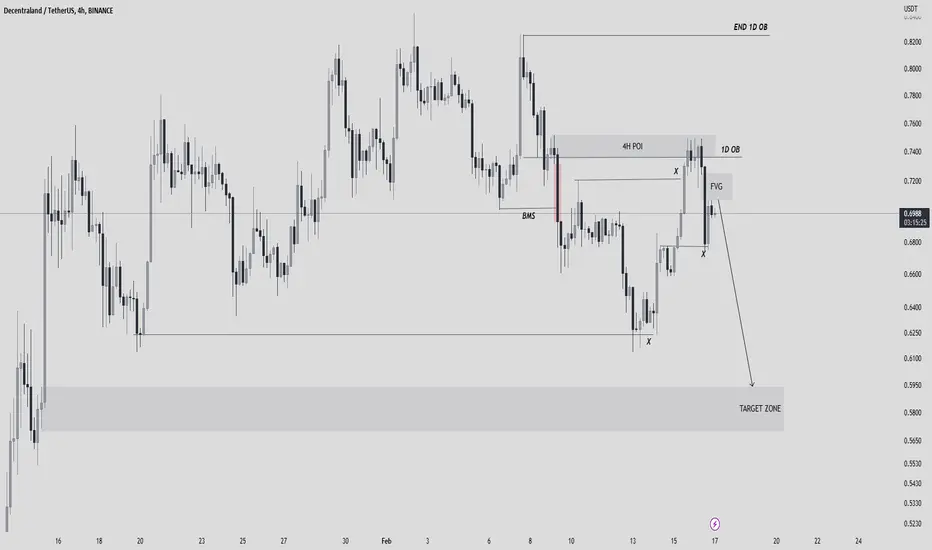
MANA/USDT SETUP Hello, traders
We monitor the cryptocurrency Mana for a selling opportunity, if we get a good entry on the shorter frame, the trade will be executed
EURCAD I Target REACHED! 60 Pips!🔥Welcome back! Let me know your thoughts in the comments!
**EURCAD Analysis - Listen to video!
We recommend that you keep this pair on your watchlist and enter when the entry criteria of your strategy is met.
Please support this idea with a LIKE and COMMENT if you find it useful and Click "Follow" on our profile if you'd like these trade ideas delivered straight to your email in the future.
Thanks for your continued support!

Market Maker Model on ETH Turns Out Super Bullish!Revisited the Price Action and identified a much clearer vision of Liquidity, Consolidation, and Direction.
Somehow, Ethereum has been very very very precise in its price and as to where it is headed.
This diagram shows the Market Maker Buy Model that happens in all timeframes. It cannot be more precise than this.
Ethereum expected to reach as low as -$650, clearing liquidity and mitigating an old bullish OB.
Enter back into its range, then the new trend begins.
I hope this helps!

My GOLD map idea.hi all,
TGIF & I wish u a great weekend ahead!
I see a good entry opportunity for short with a very good R:R, also this is my view on gold for upcoming weeks & months.
of course, a Higher High structure on high timeframe will invalidate this forecast. my stop for current position is above 1853.
trade well,
Alex

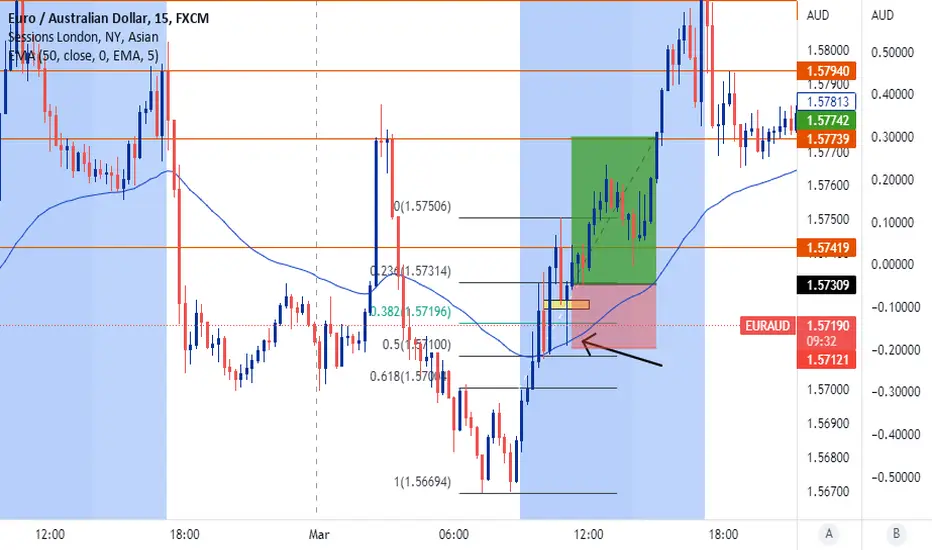
EURAUD Long Opportunity - MARCH RECAP
Been a slow few weeks with very little plays - 1st trade in around 10 days.
Price created a H, retraced towards the EMA and found support, looked like bullish momentum to continue - easy 2.3R.

Sniper Trading System EURUSD SET UPOur 12 AM 1HR Candle is GREEN indicating we are looking for the BEARISH play.
Narrative: We want price to continue to sell down to the 3rd Standard Deviation and sell to the break out traders at a discount:)
So we can trade today's price action BOTH ways. We sell to to the 3rd Standard deviation taking partials at the top and middle of our standard deviations.
Once price hits the bottom Second Deviation we begin to pull our profits and hunt for the BUY!
The DXY is strong right now that's further confluence for our sell to the bottom extremes.
Never over Leverage.
Trust your set up.
Have Fun!
Everybody Eat$
I AM Trading Made Simple.
Master Jedi & Sensi of #SniperGang

GBPCAD | Elliott Wave Hello Traders, here is the full analysis for this pair, let me know in the comment section below if you have any questions, the entry will be taken only if all rules of the strategies will be satisfied. I suggest you keep this pair on your watchlist and see if the rules of your strategy are satisfied.
The way I told you, you have to trade like this and you will have more profit always and you will not be a loss.

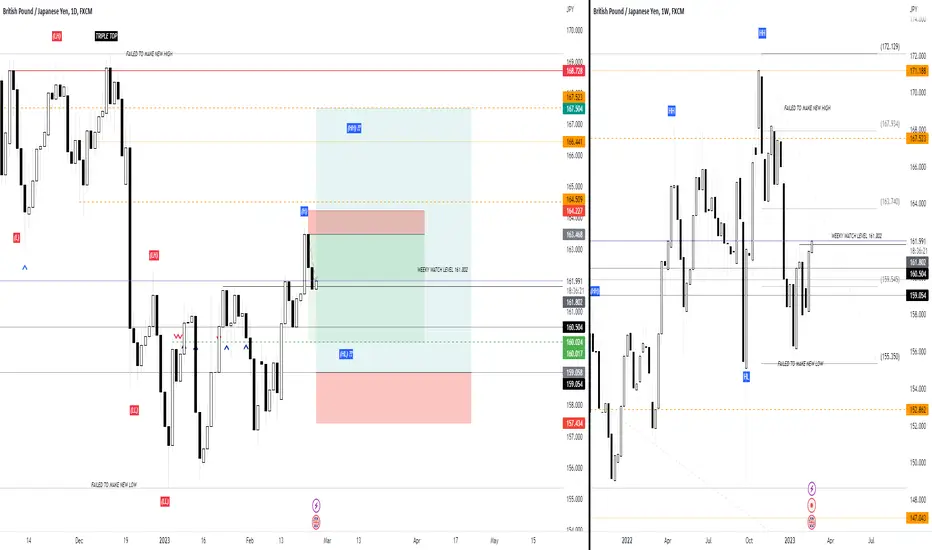
GBPJPY WEEKLY UPDATE 24/2 - 3/3Hi all
Weekly recaps:
The price of the GBPJPY has reached the 50% fibonacci level from the previous high of 172.129 and low of 155.350 following a breakout consolidation level (please see earlier post).
GBP/JPY needs to hold above 161.802 until this week's market close in order to continue its upward movement.
So, I expect that price will end the breakout pullback and begin a long position with 164.xx as the target.
Let me know what you think In the comments!
My trading strategy is not intended to be a signal. It's a process of learning about market structure and sharpening my trading skills.
Thanks a lot for your support.
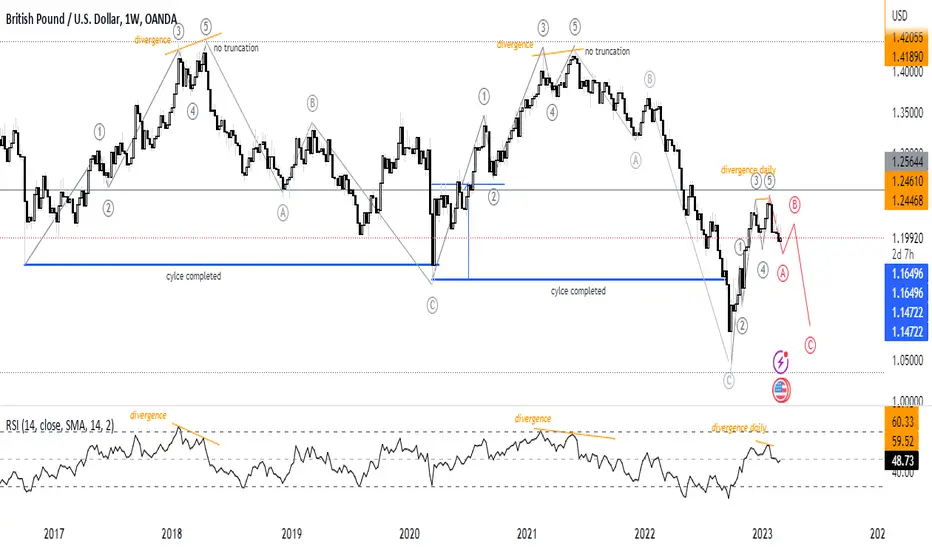
GBPUSD TRADE IDEAhi all
GBPUSD in weekly TF, no truncation between waves 3 and 5, as in the previous two cycles.
Can the price fall to 1.1797 in a few weeks?
My trading strategy is not intended to be a signal service. It's a process of learning about market structure and sharpening my trading skills.
Thanks a lot for your support.
BTC and the key level of 25,200. How to make money?Hello, everyone! Today we’re going to break down two things: the probable key level for BTC this year, 25,200, and what you can expect from the market in general if you have a medium or long term strategy.
A short story to begin
The 25,200 level was formed in early August 2022, when everyone stopped talking about the bankruptcies of 3AC, Celsius and several other companies. You could consider the 25,200 level a fair price for a neutral market in the current world economic realities. Then we had a fall due to the aggravation of relations between China and Taiwan, a small increase due to the Ethereum Merge in September and the FTX/Alameda crisis, panic sellings and general apathy. From this moment the set of positions began. It lasted almost 2 months until January 9, 2023. Then a local bullish run to 25,200 began, with one stop at 20,000-21,000. And now we hit the 25,200 level again and no one knows what will happen next
THE MAIN PART
1. All of the collapses and bankruptcies of 2022 were a surprise to all players. Each new crash was a great surprise and forced all participants to actively rebalance their positions. The example is Jump Trading and its fiat balance that was ~50% at the time of the FTX crash, even though the normal fiat rate since the Terra/Luna crash was ~30%. In other words, even the biggest players were influenced by the market and depended on the situation.
2. There is every reason to believe that it was the big players who were the main contributors to the November-January position set. After the FTX collapse, the market reached the peak of fear, the only thing that could push the market down even more at that moment was Binance/Coinbase fall, or crypto ban in the USA. Considering how quickly Binance worked and how actively Coinbase was in the process of personnel reorganization, the probability of their fall was extremely low. Also, all regulators mostly blamed SBF and executive team FTX/Alameda; there were no ideas to ban crypto in the rhetoric of regulators. Spoiler: it was introduced later and partially in the form of a stacking ban for US users so the companies would not be cheeky and would think about what they were doing. In general, the risks and probability of a bigger crisis were very low and the big teams understood it very well, that is why they started to set positions.
3. Logically, it will be clear that the level of 25,200 is most likely the most favorable level for the large participants – the beneficiaries of the fall. The price near the level of 25,200 allows you to easily sell those positions that were not sold after the collapse of 3AC/Celsius and the fall of FTX. Which in turn will take some time. After that it is only left to figure out what to do with the bad positions from the time of the Terra/Luna fall, to correct the balance of assets and build a smooth strategy for the future.
OUR BETS
The 25,200 level is completely artificial and created to sell over margin longs from 16,000 - 17,000 and sell problematic positions from the 3AC/FTX times.
After selling positions at the current level, the market will go down to 20,000 - 21,700.
After that, within 3-4 months, we will get to 30,000 - 32,000.
We should expect some interesting price movements, namely long/short squeezes.
The big players have learned to work with the risk of bankruptcy and the risk of regulators' influence: Genesis and the SEC bans are the best examples of that. Besides, there are very few of these risks left and a skilled team of analysts will be able to keep track of them and come up with strategies to work on them.
Asian liquidity will be a growth driver.
Share with us your forecasts on BTC and tell us what topics you want to be analyzed by our team , and we will write about it.
Don't forget to check our links below and check our trading pairs. Thanks for reading!

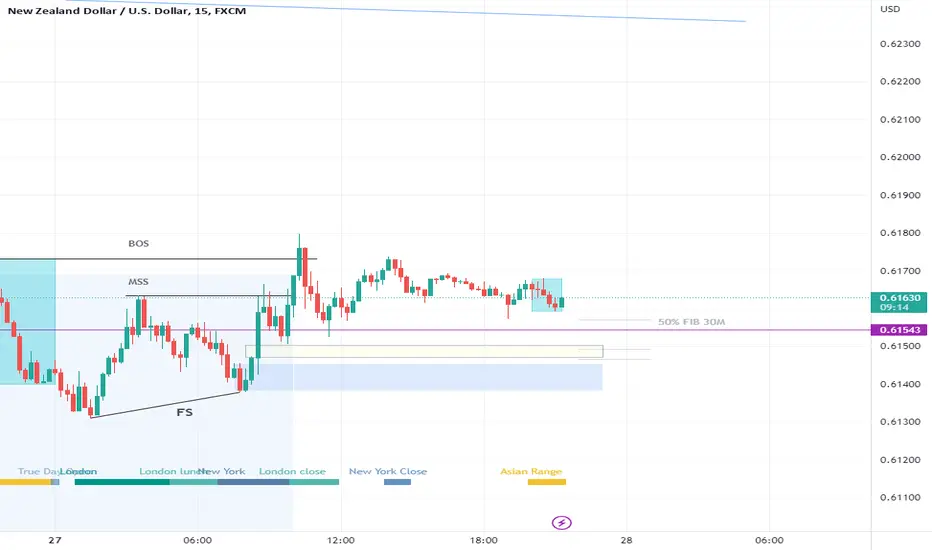
Potential NZDUSD Buy on Tuesday 28 Feb 2023Failure Swing (FS) occurred after breaking key support level. Looking for a buy when price retraces to the FVG on a 15m chart outlined in the yellow box.
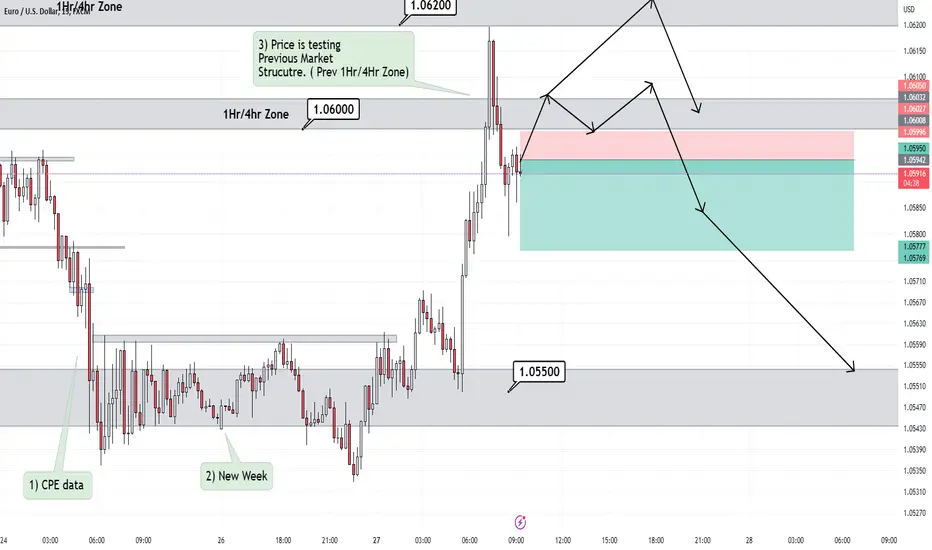
Will We Respect Market Structure? (1.06 EURUSD)Currently EU has bounced off our Daily Zone across the first London Session of the week. During the previous week, the first 5 trading sessions respected
the previous market structure, before consequently dropping to continue maomentum on HTF's. Currently the 4hr is retesting a previous 1Hr/4hr zone 1.06.
Will the Lower High Hold? Will the bear stay in control?
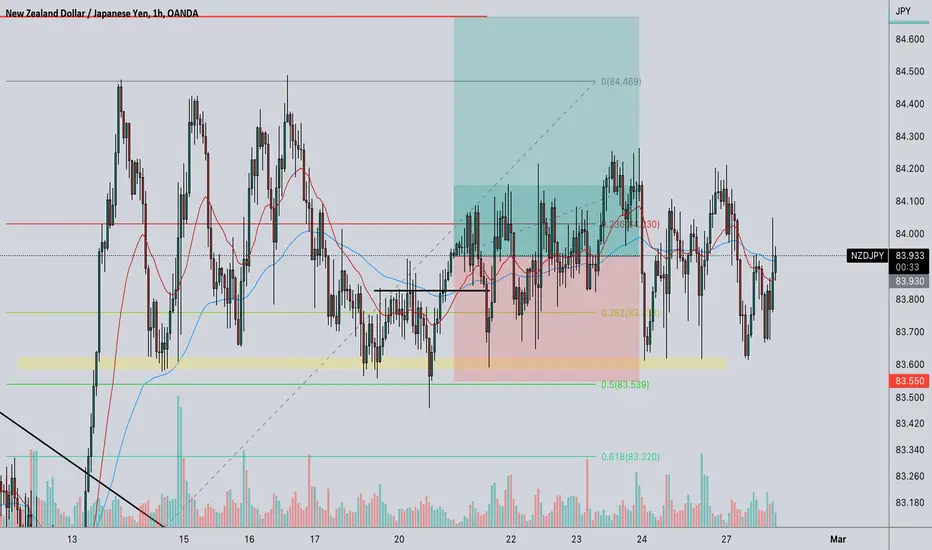
Nzd/jpy close trade at break even!!so based on previous analysis we see price is having a hard time pushing high and we seeing a lot more of bearish pressure so let close the trade at breakeven
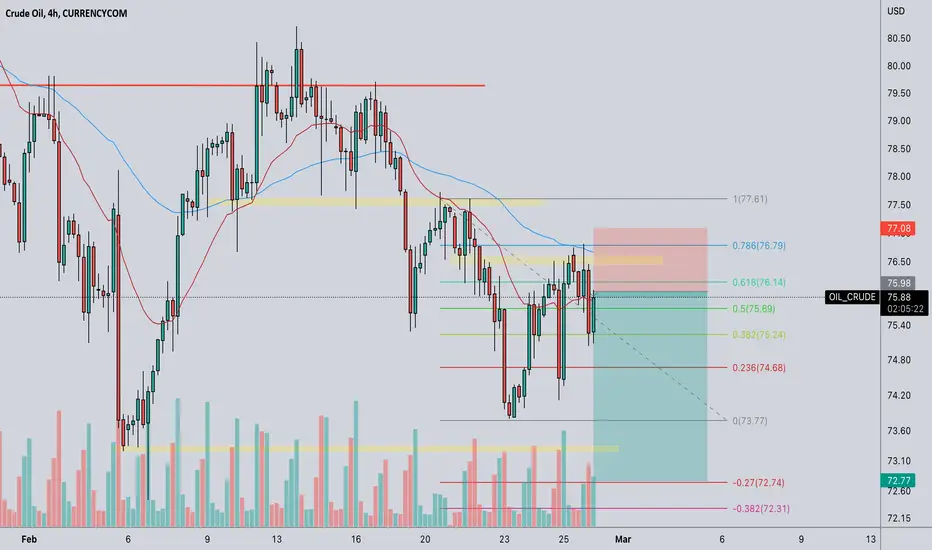
Oil Sell setup 320 pipsThis setup is based on previous oil analysis, so we see price retracing to 61.8% fib level which also act as a high resistance level, so shall see a continutaion to downside
check the previous analysis for continuation to downside on link below
Nice risk to reward
Hope you guys enjoy the rest of week
XAU/USD (GOLD) BULLISH OUTLOOKOANDA:XAUUSD
HI , TRADER'S , GOLD IS TRADING WITHIN FALLING WEDGE PATTERN
Falling wedge is bearish reversal pattern means price can reverse and go up
From last 3 week's Gold is bearish pressure , RSI AND STOCH NEAR OVERSOLD AREA
It indicate's that reversal in very near , 2 scenario's mentioned
if GOLD breakout upper wedge now than it can go upto 1832 area
if gold fall from current resistance than one more leg down to 1801 area and than back up again
Plan to buy dip's
❤️ Please, support my work with follow ,share and like, thank you !❤️

NZD/USD LONG TRADING SETUPOANDA:NZDUSD
HI , TRADER'S .. AS YOU CAN SEE MARKET WAS TRADING IN RECTANGLE
BEARISH RECTANGLE PATTERN Is bearish continue pattern
After breakout from rectangle on downside , RSI AND STOCH is oversold , market making double bottom and ready to retest resistance
20 and 50 ema will act as major resistance now
❤️ Please, support my work with follow ,share and like, thank you! ❤️

The Bubble Obituary The Fundamentals
- Many investor favorites in the late 1960s & early 1970s were companies such as IBM, Xerox, and Disney which enjoyed PEs of over 35 in the nifty fifty bubble. In this latest stock market bubble, there were dozens of mid & large cap companies trading at over 10x revenues. Many unprofitable businesses even garnered over 6x Price/Sales ratios at the peak in 2021! The US stock market is extremely overvalued relative to historical valuation averages. Conservative earnings expectations for 2023 would place earnings dropping 10%-20% this year, in-line with mild recessions. The problem with mild forecasts is that the current recession gives no indication that it will be mild. GAAP Earnings for Q4 2022, excluding energy, are down over 8% YoY with companies issuing even gloomier forecasts for 2023. Earnings are likely to fall at least 33% from peak to trough using an average of the last 4 US recessions.
- The subprime auto bubble is popping, with dealerships and lenders heavily exposed to subprime loans beginning to default. American Car Center, a subprime lender and auto dealer, recently closed its doors, highlighting the mounting pressures the industry faces. More defaults and business closures should be expected as interest rates stay high, vehicles fall in price, and car loan deliquinces rise. Subprime auto loan delinquencies are extremely high relative to their historical average even before unemployment has began rising precipitously.
- Layoffs have spread to every sector of the economy, as evidenced by 2022 Q4 conference calls. The decrease in consumer spending globally is leading to lower exports and imports globally. High interest rates are decreasing business activity and profit margins are falling due to inflation & weakening productivity. The business cycle has turned and every sector of the economy is entering cost-cutting mode. These are all reasons for layoffs continuing in increasing volumes throughout 2023.
- The US housing bubble is imploding. Sales volumes have declined over 35% from the peak. Mortgage purchase applications are the lowest they’ve been in over 25 years. Using data going back to 1952 from the University of Michigan, consumer sentiment surveys indicate that this is one of the worst times ever to buy a home. Home price declines are occurring nationwide. High office vacancy rates & high interest rates are leading to large bankruptcies in the commercial property market as well. This is already very acute in the mall segment of the commercial property sector.
- The FED has been raising interest rates within an economic contraction which has historically always magnified economic downturns. The FED typically tries to raise interest rates in the early - middle stages of economic expansion, pause their hikes as the economic cycle matures, and begin cutting rates when the economy begins declining. In this latest hiking cycle, the FED waited until the economy began contracting before quantitative tightening and interest rate hikes even began!
- America has one of the highest Private & Public Debt to GDP ratios in US History. The only other similar levels of debt in American History in the past hundred years were in the late 1920s & late 2000s. The economic contractions that followed were especially severe because of the high levels of malinvestment and debt which were deleveraged in those contractions. The level of malinvestment engendered by the FED’s suppression of interest rates in the 2009-2022 business cycle created one of the largest credit bubbles in history. Over 22% of the Russell 2000 are unprofitable and over 20% of the S&P500 are zombie companies. Many of the IPOs since 2017 (and especially since 2020) were/are unprofitable and are beginning to run into funding issues. This economic contraction is likely to eventually be classified as depression due to the continued declines in business activity and living standards for years.
The Technicals & Correlations
- Healthcare, Industrials, Consumer Staples, and Utilities have all underperformed since December 2022. Inflows and buying from large money seems to have mostly dried up and retail investor inflows, short covering, and call buying are making up a much larger portion of the market than is typical. This led to a bounce back rally in Financials, Technology, Real Estate, and consumer discretionary stocks which also began topping out in late January. In late February 2023, all sectors of the market have topped out, show falling underlying momentum, and are trading at very weak volumes. This is a similar pattern that played out prior to the march 2020 crash, where many Industrials, Staples, Healthcare, and Utility stocks peaked out prior to January 18th, 2020; whereas many overvalued & unprofitable stocks didn’t peak until February 21, 2020.
- Stock markets globally have peaked and are in the process of finishing their topping formations. Topping patterns began showing up as early as November / December 2022. Downside momentum is picking up now that interest rates globally are also beginning to breakout. The positive correlation between bonds and stocks has continued to remain strong since late 2021.
- Commodities peaked in the first half of 2022 as price inflation continued rising and economic activity was still high. Commodities enjoyed a large bounce in Fall 2022 as financial conditions eased due to the bear market rally in stock & bond prices. Commodities have been exceptionally weak thus far in 2023, which is another negative signal for stock markets & business activity globally.
- The bankruptcies of FTX & the Genesis lending desk, as well as increasing regulatory oversight, have continued to pressure crypto. With interest rates moving higher and the economy falling further, the speculative bubble that is crypto will collapse, likely back to being under 100B market cap for the total market with many altcoins going to zero and bitcoin dropping below 10K. Crypto has been a leading indicator for the market ever since their correlation began tightening in late 2020. The confirmed false breakouts and breakdowns all over the crypto sector are a negative forward signal for the stock market.
- Total margin debt outstanding is still at an extremely elevated level. In real terms, margin debts outstanding are at comparable levels prior to the October 2008 crash & March 2020 crash. Insider selling is at the highest point that it has been in the entire bear market.
The US dollar index’s negative correlation to the stock market was strong in 2021 but it became very pronounced in 2022. The US dollar’s rise against almost every other currency around the world since February 2nd is yet another negative leading signal to stocks.
-Alexander Lambert
I study over 30 countries’ markets and economic data releases. I also track the daily movements of over 750 companies and 15 different sector indexes. I have spent a tremendous amount of time on historical & economic research, as well as technical and fundamental analysis. I have been doing this for over 3 years and I generally spend between 65-80 hours a week on my work. Thank you for reading!

Key Resistance to watchPrice is approaching an important Key Level. There is a confluence between the trendline and the KL (Key Level), coupled with the Fibonacci retracement level of 0.5. This is a financial advice, Make sure to make good use of proper money and risk management

Gold 530 pips profit target achievedBased on analysis we saw a nice continuation to downside and price eventually hitting our profit target, check below to learn from the breakdown

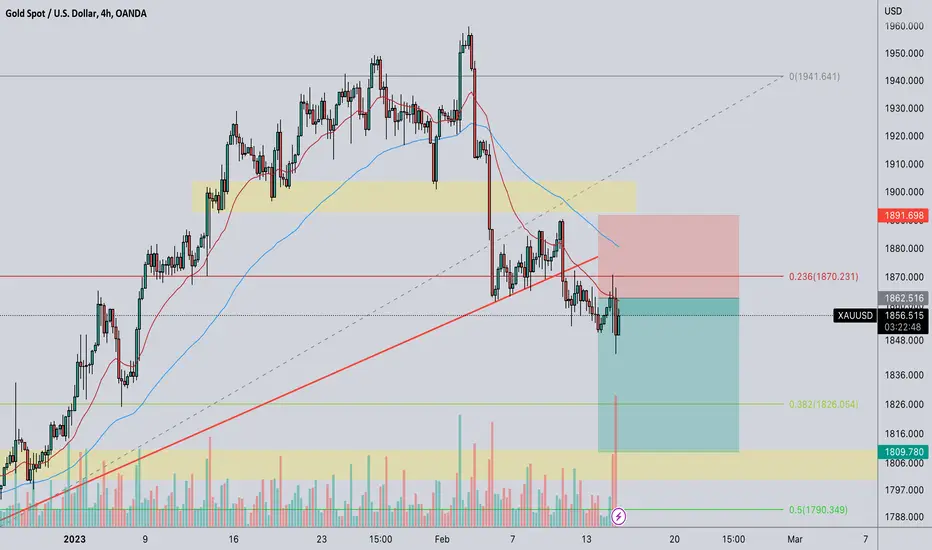
Xau/usd massive sell setup Based on the daily timeframe we saw a nice upward trend and now price is retracing to respect the fib level, when you look at H4 and H1 you will see price action showing high momentum and volatility to downside, so first target should be around 31.8% fib level and if price continue we need to look for 1810 for our final target
Goodluck
Please follow for more breakdown like this
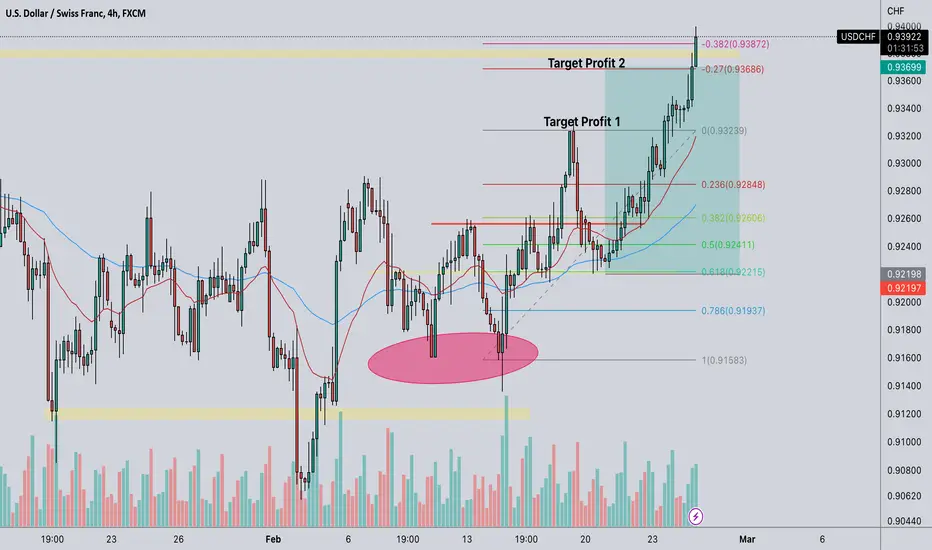
USD/CHF 140 PIPS PROFIT TARGET ACHIEVEDThank you for following, based on this week trade we manage to hit our first and second target in usdchf of 150 pips. to learn more you can check the breakdown below