Bull or bear beat holding +249.2% over a year, in profit in MayAs traders we look to capitalise on all sort of markets, not just parabolic runs. Today we are exploring how to run a long strategy even when the bulls are not in control.
WILL POST LAST 50 POSITIONS BELOW
We are looking for an strategy that:
1. has been beating buy and hold all year
2. Has a drawdown of max 15% in may 2021
3. Is simple to execute and automate
Not all candlestick patterns are created equal, and they do not work on all markets. However they do work in crypto, at least based on experience as they are not tough to identify and speculators tend to react to them.
This is why we focused on candles that are not that difficult to identify and are very clear in meaning.
The strategy (FULL INSTRUCTIONS):
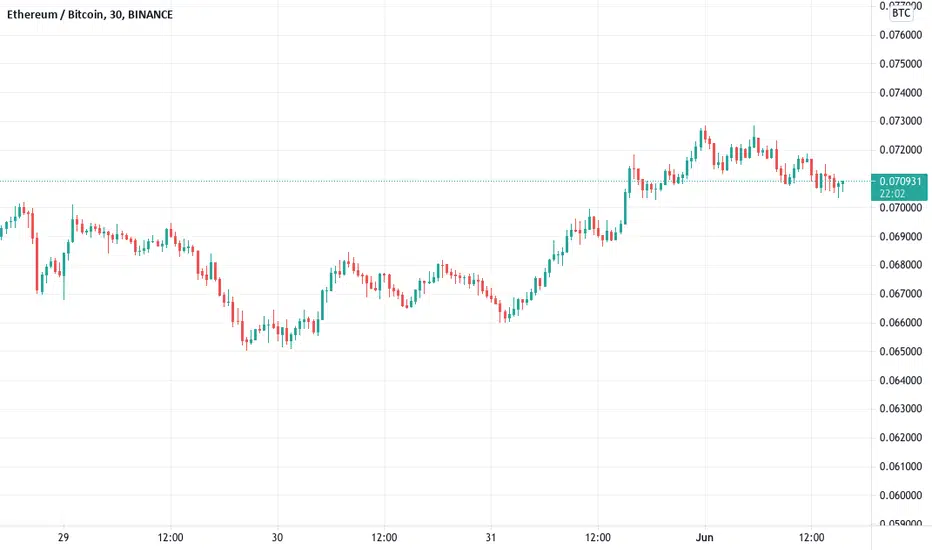
On the 30 min timeframe:
We are going to open a position when the candle is a bullish Engulfing
We are going to close the position when the candle is bearish Marubozu
No stop loss or take profit, these are the only rules we follow, but we follow them a 100% of the time.
The results:
The strategy brought in 249.17%, beating holding. If you started trading this a year ago with 1 Bitcoin, you would be 2.4917 BTC in profit at the moment. What's even better the max drawdown throughout the year was 22.7% and it was actually in February.
During May we were only 11% down at a certain point.
This provides a Sortino Ratio of 5.44 which is a stellar mark for these volatile markets.
The positions:
31/05/2021 04:30
31/05/2021 14:00
10 hours
OP 0.06681
CP 0.068884
+3.1%
29/05/2021 21:30
30/05/2021 19:30
22 hours
OP 0.065407
CP 0.067746
+3.58%
29/05/2021 00:30
29/05/2021 18:00
18 hours
OP 0.068427
CP 0.066952
-2.16%
28/05/2021 07:30
28/05/2021 14:30
7 hours
OP 0.069574
CP 0.069572
-0.00287%
25/05/2021 18:00
27/05/2021 19:30
2 days
OP 0.068144
CP 0.071024
+4.23%
24/05/2021 00:30
25/05/2021 03:30
1 day
OP 0.061435
CP 0.067043
+9.13%
22/05/2021 22:30
23/05/2021 12:30
14 hours
OP 0.062197
CP 0.0581
-6.59%
22/05/2021 11:00
22/05/2021 17:30
7 hours
OP 0.064251
CP 0.06059
-5.7%
19/05/2021 22:00
20/05/2021 21:00
23 hours
OP 0.066705
CP 0.068997
+3.44%
17/05/2021 23:00
19/05/2021 07:00
1 day
OP 0.075193
CP 0.074787
-0.54%
17/05/2021 06:30
17/05/2021 09:30
3 hours
OP 0.076593
CP 0.077412
+1.07%
14/05/2021 13:00
15/05/2021 14:30
1 day
OP 0.079504
CP 0.078525
-1.23%
13/05/2021 16:30
13/05/2021 23:30
7 hours
OP 0.076788
CP 0.074242
-3.32%
12/05/2021 10:30
13/05/2021 15:30
1 day
OP 0.075732
CP 0.075619
-0.149%
11/05/2021 06:30
12/05/2021 10:00
1 day
OP 0.071125
CP 0.075353
+5.94%
09/05/2021 16:00
10/05/2021 11:00
19 hours
OP 0.06759
CP 0.069748
+3.19%
07/05/2021 13:30
09/05/2021 00:30
1 day
OP 0.061147
CP 0.065733
+7.5%
05/05/2021 01:30
06/05/2021 23:30
2 days
OP 0.061121
CP 0.061832
+1.16%
03/05/2021 00:30
04/05/2021 22:00
2 days
OP 0.05225
CP 0.061328
+17.4%
01/05/2021 22:30
02/05/2021 05:30
7 hours
OP 0.051064
CP 0.051111
+0.092%
30/04/2021 19:00
01/05/2021 15:00
20 hours
OP 0.048829
CP 0.049703
+1.79%
30/04/2021 09:30
30/04/2021 16:00
7 hours
OP 0.051113
CP 0.047849
-6.39%
29/04/2021 08:30
30/04/2021 02:30
18 hours
OP 0.050351
CP 0.051114
+1.52%
28/04/2021 10:00
29/04/2021 00:30
15 hours
OP 0.04799
CP 0.049829
+3.83%
27/04/2021 00:00
27/04/2021 19:30
20 hours
OP 0.046896
CP 0.047795
+1.92%
26/04/2021 10:00
26/04/2021 13:00
3 hours
OP 0.046466
CP 0.046378
-0.189%
24/04/2021 21:00
25/04/2021 13:30
17 hours
OP 0.045035
CP 0.046231
+2.66%
22/04/2021 20:00
24/04/2021 17:00
2 days
OP 0.04791
CP 0.044796
-6.5%
19/04/2021 12:00
22/04/2021 18:00
3 days
OP 0.039343
CP 0.04728
+20.2%
16/04/2021 10:30
17/04/2021 19:00
1 day
OP 0.03943
CP 0.039117
-0.794%
15/04/2021 18:00
16/04/2021 05:00
11 hours
OP 0.039286
CP 0.039291
+0.0127%
13/04/2021 17:30
15/04/2021 17:00
2 days
OP 0.0363
CP 0.039141
+7.83%
13/04/2021 14:30
13/04/2021 17:00
3 hours
OP 0.03575
CP 0.035968
+0.61%
12/04/2021 11:00
12/04/2021 12:30
2 hours
OP 0.035761
CP 0.035598
-0.456%
11/04/2021 03:30
12/04/2021 09:30
1 day
OP 0.035639
CP 0.035866
+0.637%
10/04/2021 21:00
10/04/2021 23:30
3 hours
OP 0.035761
CP 0.035688
-0.204%
08/04/2021 22:30
09/04/2021 13:30
15 hours
OP 0.035729
CP 0.035448
-0.786%
08/04/2021 02:00
08/04/2021 18:30
17 hours
OP 0.035231
CP 0.035636
NA
+1.15%
05/04/2021 05:30
06/04/2021 19:30
2 days
OP 0.035409
CP 0.036274
+2.44%
02/04/2021 13:00
04/04/2021 03:00
2 days
OP 0.033704
CP 0.035098
+4.14%
01/04/2021 13:30
02/04/2021 04:00
15 hours
OP 0.032793
CP 0.033349
+1.7%
30/03/2021 06:30
31/03/2021 22:00
2 days
OP 0.03138
CP 0.032743
+4.34%
27/03/2021 09:00
30/03/2021 02:30
3 days
OP 0.030822
CP 0.031326
+1.64%
26/03/2021 02:00
27/03/2021 04:00
1 day
OP 0.03114
CP 0.030919
-0.71%
25/03/2021 16:00
25/03/2021 20:00
4 hours
OP 0.031273
CP 0.030754
-1.66%
23/03/2021 17:30
23/03/2021 20:30
3 hours
OP 0.030826
CP 0.03091
+0.272%
20/03/2021 15:30
23/03/2021 00:30
2 days
OP 0.031261
CP 0.030839
-1.35%
20/03/2021 00:00
20/03/2021 05:30
6 hours
OP 0.031174
CP 0.031295
+0.388%
18/03/2021 18:00
19/03/2021 03:30
10 hours
OP 0.030665
CP 0.03087
+0.669%
17/03/2021 07:30
17/03/2021 18:00
11 hours
OP 0.031816
CP 0.032216
+1.26%
Marubozu
Can Fin Home is ready for Bull runHi All,
Can fin homes looks bullish on the charts.
There is a big bullish candle called marubozu candle which is signaling strength in the stock. Buy the stock at current levels and hold for big long term gains. The levels have been suggested in the charts. Keep stop loss on weekly closing basis.
**Ideas are my own** Invest as per your risk taking appetite**

[LONG] The Power of the Bullish Engulfing Candle on the DailyAs you can see, daily candles are a solid indicator of price movements and market sentiment. In each of these instances, bears were able to push the price down to form either a double bottom or golden-zone retrace on the fibs. From here, buyers stepped into the market and made a statement of intent with massive buying pressure – as indicated in these daily bullish engulfing candles.
These candles can be used to signify a change in the trend direction and signal to other traders that there is strength in the market.
The most recent daily bullish engulfing candle on 26th March painted a bullish marubozu, meaning price closed on that candle at the highest point of the day. This is an even stronger signal to traders that bulls have reclaimed control of the trend in the short-mid term.
This, coupled with the daily hidden bullish divergence on BTC/USD, has me thinking we will see a $70K Bitcoin in the not-so-distant future.
DYOR – not financial advice.

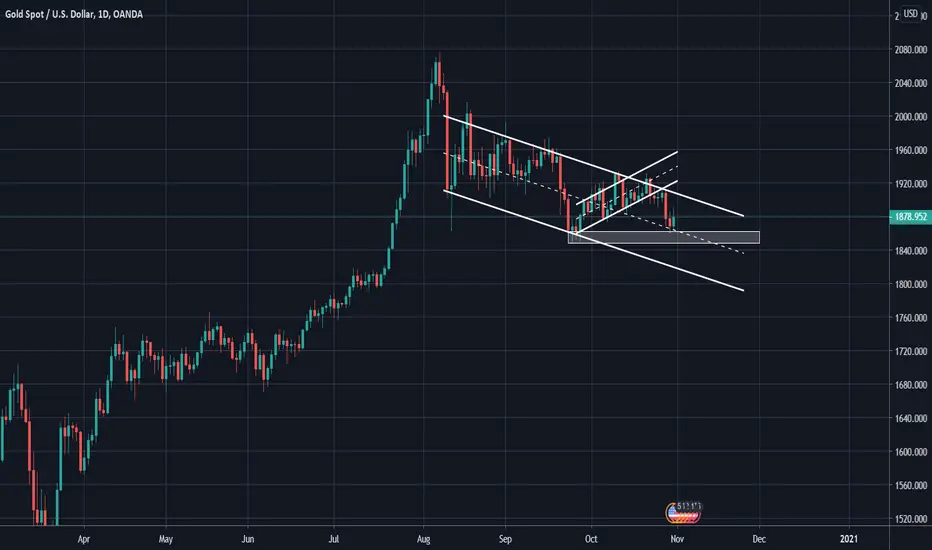
MULTI-TIMEFRAME ANALYSIS - XAUUSDXAUUSD, Gold, recently tested its support zone on the 1D timeframe. It seems to have been rejected by rejected though.
1D Analysis
The Friday candle closed as a bullish candle after testing the support zone with the previous days candle. The pair can be seen inside a descending parallel channel, bullish flag. Within that bullish flag the pair was also within a smaller bearish flag that it recently broke out of which initiated the sell after its re-test. The pair might be heading to re-test the resistance of the bullish flag if it doesn't gain enough selling pressure to re-test the support zone and eventually break it.
4H Analysis
The pair closed its last 4H candle as a bearish open marubozu which indicates lack of selling pressure towards the close of the candle. The two 4H candles preceding the bearish open marubozu had re-tested the support turned resistance zone before getting rejected. We can expect the pair to head towards the support turned resistance zone once again if it doesn't gain enough selling pressure to continue the downwards move. If it however does gain enough pressure then we can expect the pair to head towards its support zone by breaking the trend line support.
1H Analysis
The pair can be seen within an ascending triangle which it attempted to break to the upside but got rejected by the 4H support turned resistance zone. After dropping back inside the ascending triangle the pair dropped into an ascending parallel channel, and seems to have tried to retest its resistance but was not successful. If the pair manages to break the channel to the upside it might result in it breaking the resistance of the ascending triangle, if not we might see the pair head to test the support of the channel which also turns out to be the support of the ascending triangle. A break below the channel might result in the pair heading towards the 4H support zone.
Conclusion
Monitor the pair on the 1H timeframe to see exactly what the pair does and how it coincides with the 4H and 1D in order to make an accurate trading decision.
If you liked this analysis make sure to give us a thumbs up, leave us a comment and make sure to follow us for future ideas 👍❤
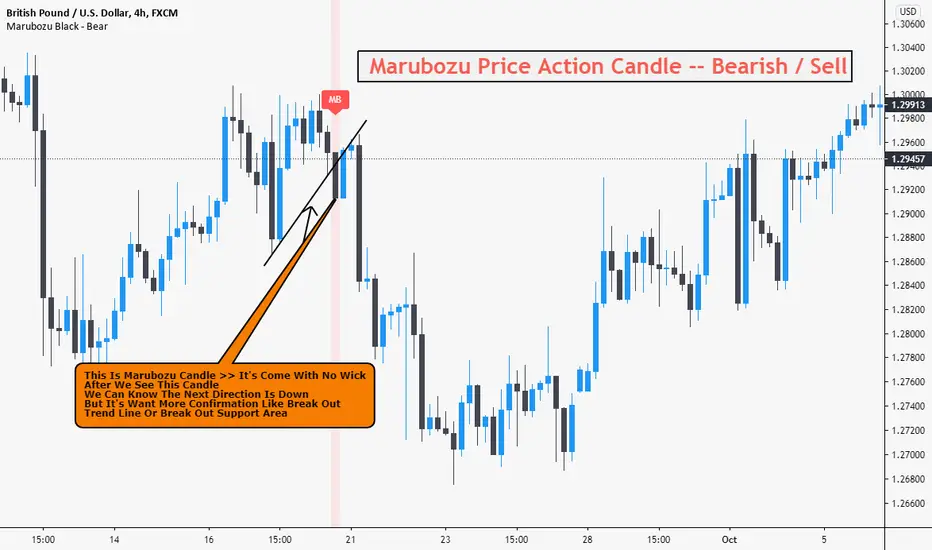
#Lesson #5 Marubozu Price Action Candle -- Bearish / Sell Hello Trader's ♥
We Have Today Marubozu Price Action Candle -- Bearish / Sell
---------------------------------------------------------------------------
It's Come To Convert The Direction From Up To Down
After We See This Candle We Can Sell Direct ----
-- This Is Marubozu Candle >> It's Come With No Wick
After We See This Candle
We Can Know The Next Direction Is Down
But It's Want More Confirmation Like Break Out
Trend Line Or Break Out Support Area
--------------------------------------------
Best Frame : 4 Hour's - Daily - Weekly
Best Pairs : All Markets And All Pairs
And You Can Add Marubozu Candle Free Script To Your Chart Just Open Indicator Library And Choose Candles Price Action Patterns And Choose Marubozu Bearish ----
For Any Questions Ask Us On Comments And Wait For New Education Lessons
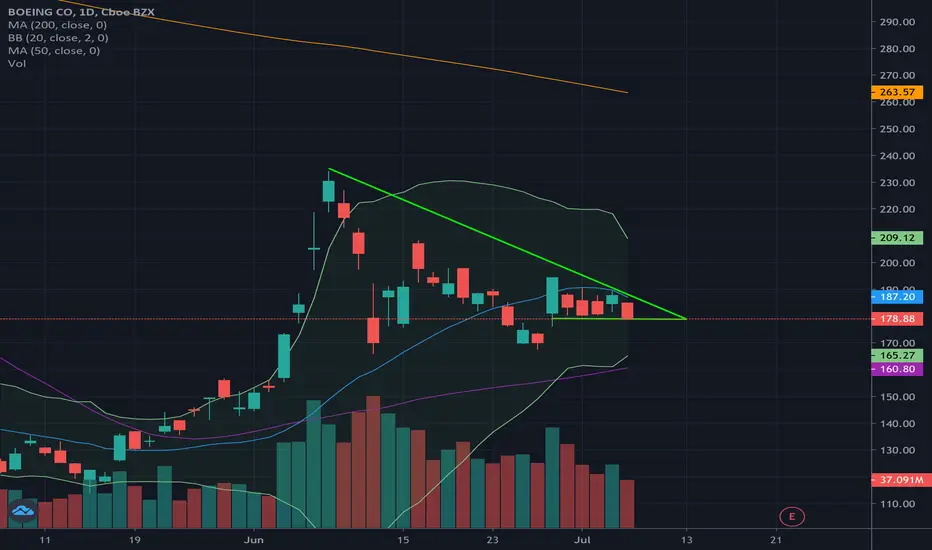
BAThe Boeing Company (BA) has been forming a descending triangle with today's close resting right on a support that has been tested multiple times in the past week. With Coronavirus fears escalating again, the desire to travel and fly is falling. A bearish marubozu candle on the 1D chart may indicate a continuation of the downtrend and possibly break that support.
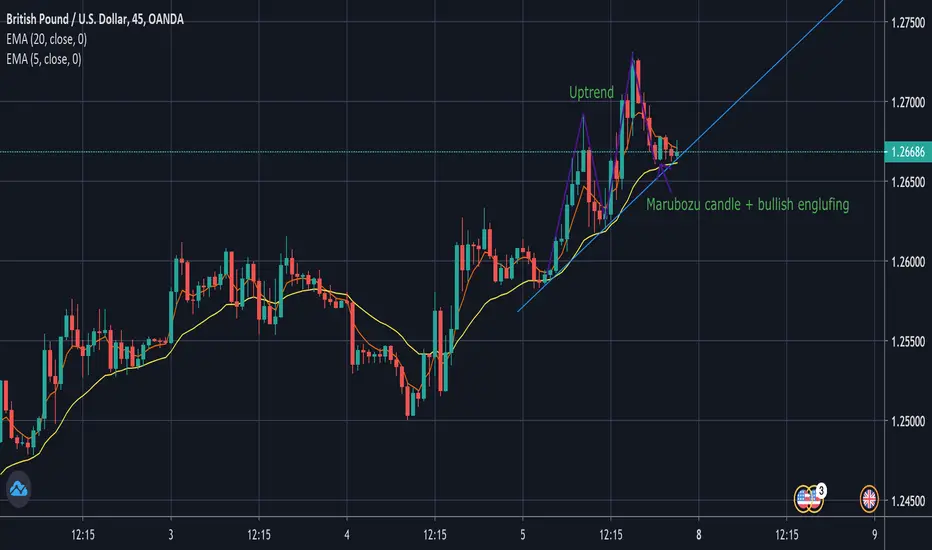
Trend continuation for GBPUSDIn my opinion, I think the market on the GBPUSD will continue its uptrend. This is an uptrend as shown by the trendlines and the crossover of the 2 EMAs. In addition to the uptrend, there is a slanted support line which has been tested 3 times and has seen neither a breakthrough or fake-out. This suggests the support line is respected by the market and will likely not experience a breakthrough. Furthermore, there is a green marubozu and bullish engulfing candlestick pattern which both suggest the market will go up and continue its trend.
Any feedback on this analysis would be greatly appreciated!
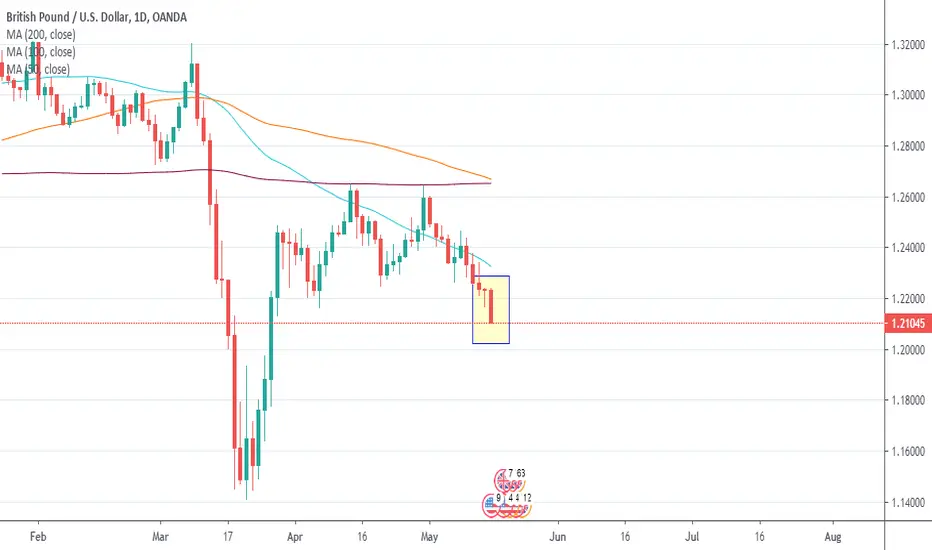
Red Marubozu on GBPUSDOn the daily chart I see that the price is below all the moving averages
Also the price closed last week with a great Marubozu which confirm the bearish bias.
I am looking for a short positions on this pair for this week.
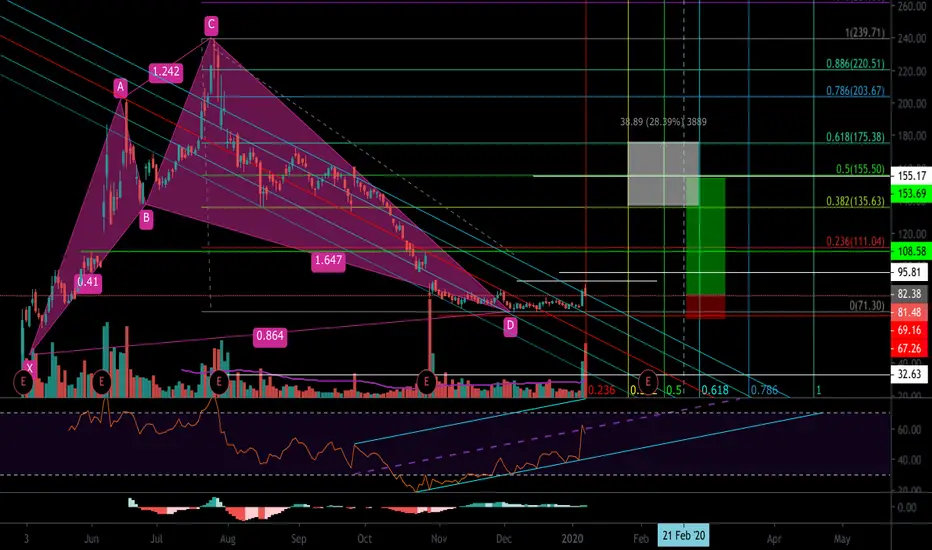
BYND Bullish CypherThe price action managed to stay above the .886 and we got our first bullish marubozu candle in the PRZ. My target is the .50 to .618 because the price may reverse there if the cypher turns into a bearish 5-0
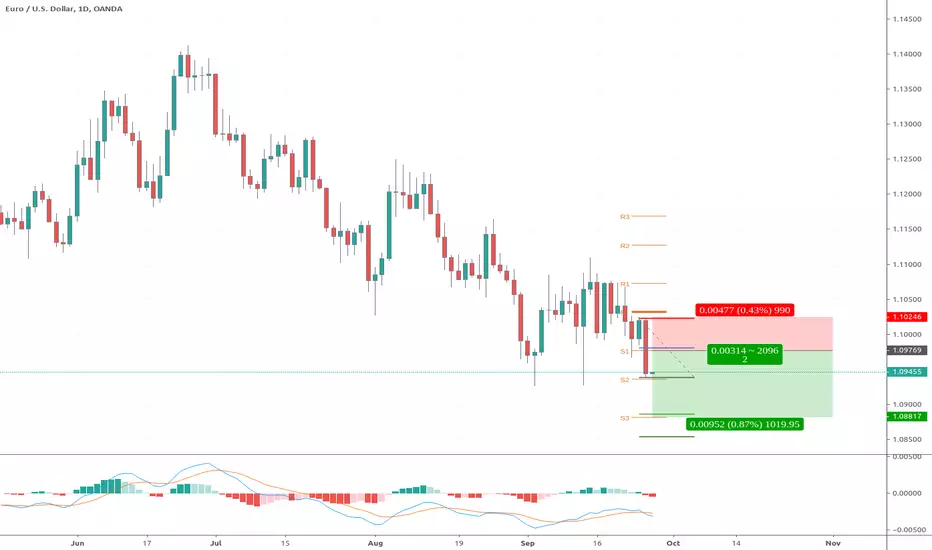
EURUSD Short continuationDate Pair Direction Trade Trend Level Signal Entry
2019-09-25 EURUSD Short With trend Down Dynamic Marubozu retrace
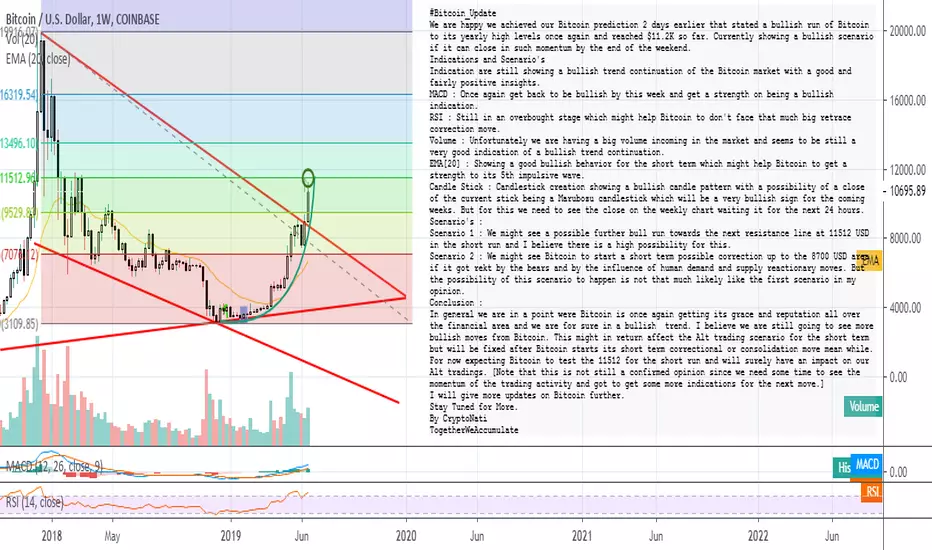
#BITCOIN : The Rise And Rise Of Bitcoin 3.[We Trust BTC!]] #Bitcoin_Update
We are happy we achieved our Bitcoin prediction 2 days earlier that stated a bullish run of Bitcoin to its yearly high levels once again and reached $11.2K so far. Currently showing a bullish scenario if it can close in such momentum by the end of the weekend.
Indications and Scenario's
Indication are still showing a bullish trend continuation of the Bitcoin market with a good and fairly positive insights.
MACD : Once again get back to be bullish by this week and get a strength on being a bullish indication.
RSI : Still in an overbought stage which might help Bitcoin to don't face that much big retrace correction move.
Volume : Unfortunately we are having a big volume incoming in the market and seems to be still a very good indication of a bullish trend continuation.
EMA : Showing a good bullish behavior for the short term which might help Bitcoin to get a strength to its 5th impulsive wave.
Candle Stick : Candlestick creation showing a bullish candle pattern with a possibility of a close of the current stick being a Marubozu candlestick which will be a very bullish sign for the coming weeks. But for this we need to see the close on the weekly chart waiting it for the next 24 hours.
Scenario's :
Scenario 1 : We might see a possible further bull run towards the next resistance line at 11512 USD in the short run and I believe there is a high possibility for this.
Scenario 2 : We might see Bitcoin to start a short term possible correction up to the 8700 USD area if it got rekt by the bears and by the influence of human demand and supply reactionary moves. But the possibility of this scenario to happen is not that much likely like the first scenario in my opinion.
Conclusion :
In general we are in a point were Bitcoin is once again getting its grace and reputation all over the financial area and we are for sure in a bullish trend. I believe we are still going to see more bullish moves from Bitcoin. This might in return affect the Alt trading scenario for the short term but will be fixed after Bitcoin starts its short term correctional or consolidation move mean while. For now expecting Bitcoin to test the 11512 for the short run and will surely have an impact on our Alt tradings.
I will give more updates on Bitcoin further.
Stay Tuned for More.
By CryptoNati
TogetherWeAccumulate
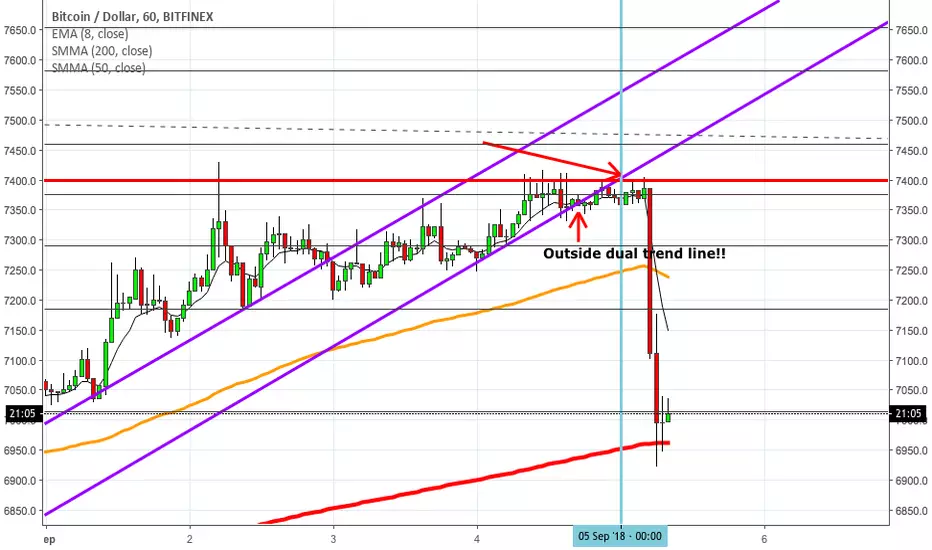
Mama Bear had too much Red Bull last night...I thought it was all a dream.. I was so drunk on selling, I had a Bitcoin hangover when I woke up. HAHA! Bitcoin takes a major dive under $7000. While many people anticipated Bitcoin going up to the moon from here, like 99%... The 1% of the population was selling Bitcoin. I hope it clicks about the 99% and the Top 1%. Doing my hefty candlestick analysis and market psychology on Bitcoin beginning Sept.1 has just begun. In order for the bull to take over, he must close over the monthly candle strong. Otherwise we are heading south. Check out earlier ideas to see how I was doing my analysis. Pure candlestick first, then I add technicals. A toast to Bitcoin for heading down so we can all save up our coins and be rich in the future. Bitcoin for $2500 or better yet $1100 (Alex from Jeopardy)
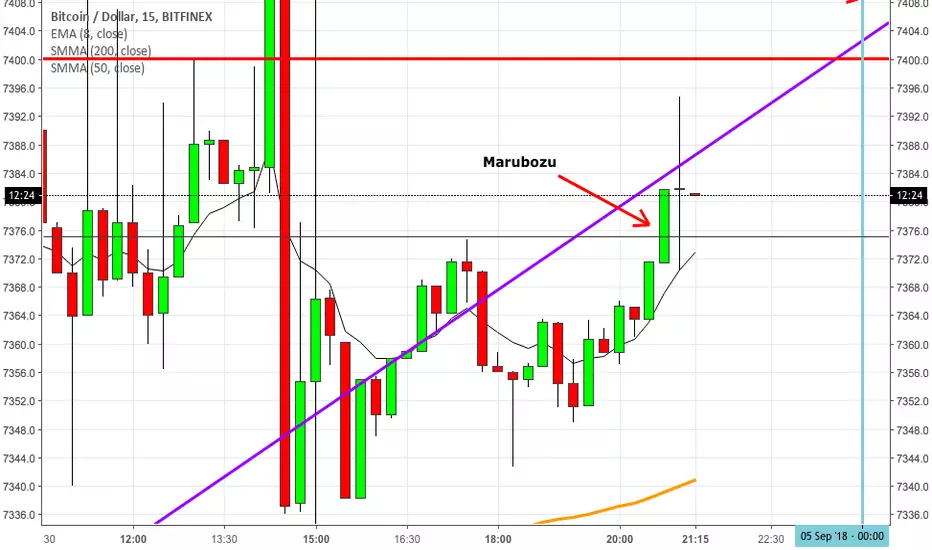
Bullish Marubozu CandlestickThis is called a Bullish "Marubozu" Candlestick. This candle is considered a weak indicator. Depending on what comes after this candle , this could be a bullish continuation or bearish reversal. This candle usually have no wicks on either end. The color of this candle is either Green or White. Check your charts and search for them everywhere and see what comes after this type of candle.
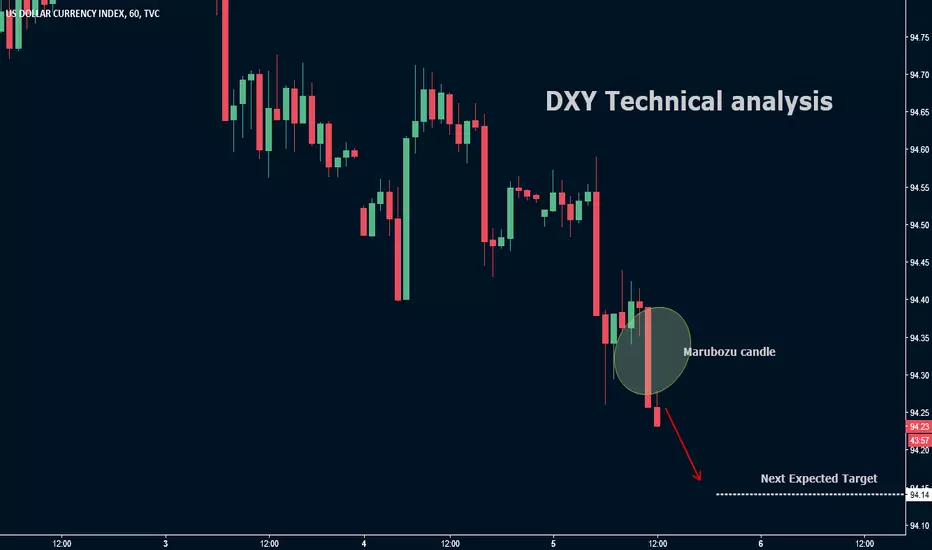
DXY Technical analysisThe 1-hour chart of Dollar index indicates that the index is currently in downtrend.
It is consistently forming lower lows and it has formed a Marubozu candle during the last hour.
So we expect the selling accelerate from here and reach the price zone of 94.14 where some profit booking could be expected.
2nd 1day candle closes above wedge final cnfirmation of breakoutGood to see on the 1 day chart that we have closed a second 1 day candle above the wedge giving us final confirmation of the breakout. What we are looking at here though is the 4 hour chart not the one day. That confirmation on the one day just solidifies that breakout and greatly increases our probability of hitting the $10335 price target. As of now, at the same time the 1 day candle closed above the wedge(and the green descending trendline), the 4 hour candle has closed a candle back above the ever important 50 MA(buy/sell line). As I've stated in the past, we want 3-5 consecutive 4 hour candle closes above the buy sell line before we can confidently say we are back in a buyers market...but I'm confident we will get that in the coming days. I also find it funny so far that the angle of the dotted purple line from the breakout is naturally creating a bottom trendline on the price action almsot as if the candles are using the dotted purple line as a stairway up to the target price of $10335. The angle is the exact angle of the back of the descending wedge we just broke out of, so it will be interesting to see whether or not it continues to follow that symmetry. Sacred geometry amazes me on a regular basis., I would not be surprised to see the price contionue to follow that angle for awhile. Lastly one thing to nnote the recent 1 day candle closed as a red maribozu candle which isn't really indicitve of a reversal sao I anticipate the bull train continuing...we may consolidate a bit for a few days and possibly even form a bull flag on the day chart, or perhaps one on the 4 hr or both...we will have to wait and see.

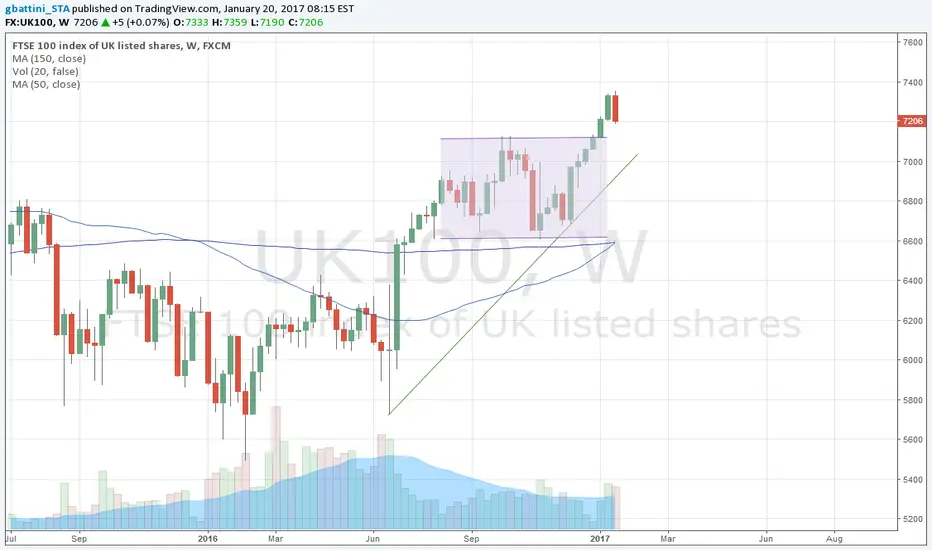
FTSE 100 - Short term sellSince the vote on Brexit, the path taken by the index is fairly obivous. The impulsion started at the end of June then is followed a period of consolidation from beginning of August until the end of 2016.
The new year started with a serie of new highs when the index reached 7341
The daily graph shows some sign of a reversal with a recent cross of the MACD, a momentum about to go into negative territry and a clear downtrend on the RSI. These indications open the way for a short term downtrend.
This feeling is confirmed by the weekly chart, showing a nearly perfect Marubozu, sign of a reversal in investors' mind and displaying an obvious sellers' dominance.
- Short term, close long or open short to get the opportunity of the index going down until its trend (or 50) near the 7,000 mark
- Mid to Long term, the uptrend still prevails.
- A break below the 7,000 points would confirm the short term short position and initiate a short position.
- On the contrary, a rebound would be a good entry point for a long position
PRGX Global, Inc. tests its resistancePRGX Global, Inc. finished the previous week with bullish engulfing and tested its resistance level at $4,6 where bulls succeeded at rejecting that price several times. Yesterday PRGX formed marubozu pattern and now looking upward for further advance.
We would project the price go up to at least $6 by means of measuring the previous bullish move at the beginning of 2016.
For more ideas visit mercurius.wordpress.com
