Xumm Wallet Set to Integrate Mastercard Debit FeaturesXRPL Labs' Wietse Wind hints at Xumm Wallet's Mastercard integration, boosting digital asset transactions and security.
In a significant development for cryptocurrency wallet users, Wietse Wind, the founder of XRPL Labs and the creator of Xumm Wallet, has announced plans to integrate Mastercard debit card functionality into the Xumm wallet. This update revealed through tweets, demonstrates XRPL Labs’ commitment to enhancing the user experience and expanding the wallet’s capabilities.
Xumm Wallet Integrates Mastercard for Flexibility
Wind’s revelation came in response to an XRP enthusiast’s query about possibly using a debit card with Xumm. He indicated the integration would involve “Debit Mastercard, self custody, card authorization with custom on ledger limits on your account using a Hook.” This update aligns with XRPL Labs’ ongoing efforts to incorporate more traditional banking features into the digital currency, providing users with enhanced flexibility and control over their funds.
The integration of Mastercard with Xumm wallet is expected to streamline transacting with digital assets. Users will be able to leverage the global acceptance of Mastercard, enabling them to transact seamlessly across various platforms and services. The integration promises to bridge the gap between traditional financial services and the burgeoning world of digital currencies.
Alongside the Mastercard integration, Wind also touched upon the new functionalities for the Xumm-Tangem NFC hardware wallet cards. These cards, not intended for use at terminals and ATMs, offer a physical means of securing cryptocurrency assets. Wind clarified that the Tangem cards are primarily for hardware self-custody, unlike the proposed debit card functionality.
The Tangem NFC hardware wallet cards, as mentioned by Wind, will allow users to pre-fund their wallet card with a specific amount in XRP in addition to the account reserve. This feature enhances the security and convenience of users who manage their digital assets.
Xumm Integration Balances Fees with Innovation
The announcement was met with queries and concerns from the XRP community, notably regarding the potential for additional transaction fees. John Mcclain, an XRP user, expressed concern over the possibility of an extra 1% fee, drawing parallels to existing custody solutions like the U.S. exchange Uphold, which already imposes significant fees for debit transactions.
Price Momentum
MA is trading near the top of its 52-week range and above its 200-day simple moving average.
What does this mean?
Investors have been pushing the share price higher, and the stock still appears to have upward momentum. This is a positive sign for the stock's future value.
Mastercard
Mastercard (NYSE: MA) Embraces AI 🤖 to Combat FraudInternational payment system Mastercard has partnered with Feedzai, a company that leverages artificial intelligence (AI) to combat financial fraud.
Feedzai's technology will integrate directly with Mastercard's CipherTrace Armada platform, monitoring 6,000+ cryptocurrency exchanges to detect suspicious transactions in real time.
The companies aim to combat both fraud and money laundering activities. The move marks a major push from Mastercard into crypto — specifically, efforts to clean the space up of fraud and scams.
The move marks a push from Mastercard into the market for legitimizing crypto as a mainstream financial asset that can be subjected to the same rules and compliance frameworks as traditional assets.
Banks and other large financial institutions have shown increased interest in experimenting with crypto in their products and services. But the next step, deploying commercially available crypto products as part of their core offerings, has proven more elusive.
Banks have been wary of digital assets’ lack of comprehensive regulations and applications in fraud and scams.
Last year, the amount of theft and scams led to a global increase of 79% in crypto-related losses from the previous year, according to data from blockchain analysis firm Chainalysis. Illicit addresses received $14 billion in 2022 year-over-year, almost twice what they received in 2020.
Price Momentum
MA is trading near the top of its 52-week range and above its 200-day simple moving average.
What does this mean?
Investors have been pushing the share price higher, and the stock still appears to have upward momentum. This is a positive sign for the stock's future value.
Mastercard Suffers A Fall Following Earnings - But Up 7%Mastercard's stock experienced a 5% drop following its latest earnings report, despite surpassing expected earnings.
Analysts had predicted earnings of $3.21 per share for Q3, but the actual figure was $3.39. This outperformance, however, did not translate into positive market sentiment, as the stock price fell after the market opened on October 28th. This decline reflects the complex dynamics between company performance and investor expectations.
The stock found support at $359 after a 14% drop from its September 2023 peak, where it failed to break the $420 mark.
Over the last decade, Mastercard's stock has grown by 428%, but since April 2021, its growth has slowed, with the stock oscillating between $276 and $420. Despite these fluctuations, the overall trend remains bullish.
Currently, Mastercard's stock is up 7% for the year, showcasing resilience amid market volatility. The focus now is on whether the stock will break out of its current range and resume its long-term upward trajectory.
MA Mastercard Incorporated Options Ahead of EarningsIf you haven`t bought MA in the Buy Area here:
Then analyzing the options chain and the chart patterns of MA Mastercard Incorporated prior to the earnings report this week,
I would consider purchasing the 380usd strike price Puts with
an expiration date of 2024-1-19,
for a premium of approximately $14.65.
If these options prove to be profitable prior to the earnings release, I would sell at least half of them.
Looking forward to read your opinion about it.

Mastercard Inc. leading the market on NYSE stocks todayMastercard Inc. is a leading technology company in the payments industry that provides payment processing solutions to businesses and consumers worldwide. Mastercard is one of the largest payment processors in the world by market cap and the number of payments processed.
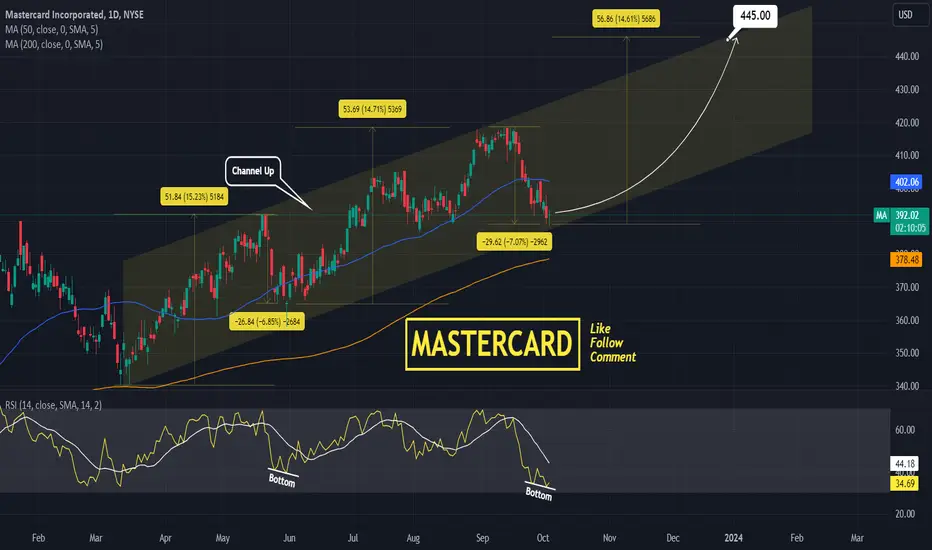
MASTERCARD gives a $445 end of year targetMastercard is trading inside a Channel Up and today almost hit the bottom.
As long as the MA200 (1d) isn't broken, the long term trend stays technically bullish.
Trading Plan:
1. Buy on the current market price.
Targets:
1. 445 (+14% rise a minimum on the bullish legs prior).
Tips:
1. The RSI (1d) prints the exact same bottom pattern as on the May 31st Low.
Please like, follow and comment!!
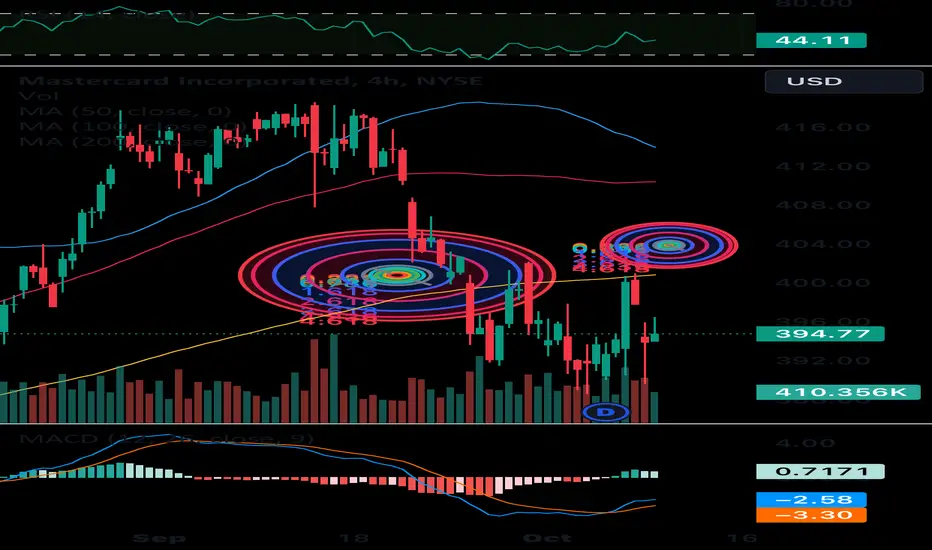
MA, DECISIVE Head-Shoulder-Formation, Likely To Complete Next!Hello,
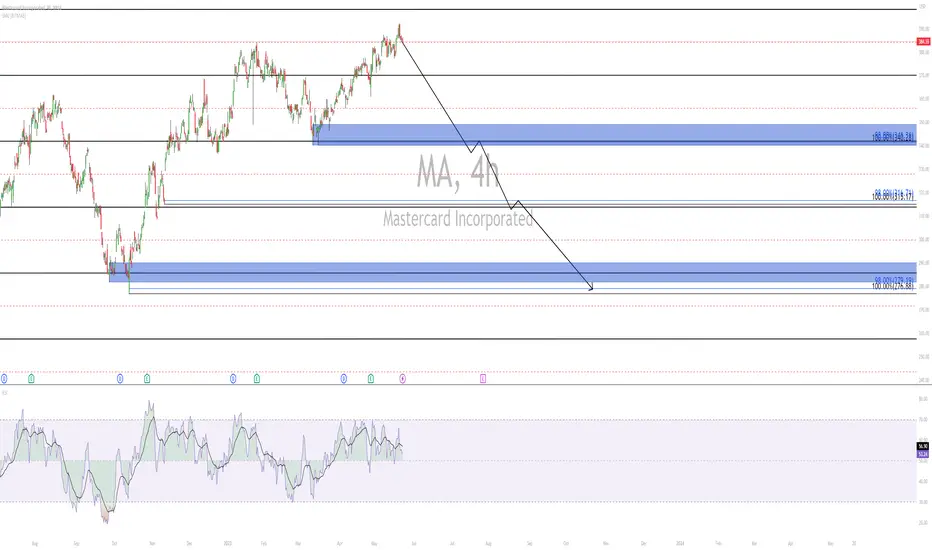
Welcome to this analysis about MA, we are looking at the 4-hour timeframe perspectives. The world is constantly changing more and more so also the payment processing world. In times of emerging central-bank-digital-currencies besides the already existing cryptocurrency market, classical payment providers need to find a solution to hold on with the trend. When the central-bank-digital-currencies should be implemented as expected it will be highly likely that apps will launch with which the payments can be processed, this can also potentially decrease the usage of plastic card payments, in this case, classical payment providers such as credit cards need to look how they can arrange to hold on with these new forms of payments. On the technical side now I discovered how MA is building an important formation that has a higher possibility to confirm bearishly to the downside, therefore I detected all important levels and upcoming determinations.
As when looking at my chart we can watch there how the stock has formed this massive head-and-shoulder-formation in the structure with the left shoulder, the head already fully completed and now with the right shoulder about to complete with the last movements. The bearish volatility with which the right shoulder has formed is important here as this kind of heavy downside volatility indicates a continuation to the downside which additionally adds to the bearish head-and-shoulder-formation-confirmation scenario. When the stock now finally closes below the neckline in blue this will complete the whole formation bearishly and will be the origin for further bearish continuations to the downside as well as activation of the target-zone within the 328 level marked in my chart in blue. Once this target-zone has been reached the situation needs to be elevated anew and if the stock manages to stabilize in this structure or continue bearishly to the downside which should not be kept by side depending on how the bearish developments establish.
In this manner, thank you for watching my analysis about USDCHF, great when you support it with a like and follow or comment for more market insight!
"The high destiny of the market is to explicate, rather than to speculate."
Information provided is only educational and should not be used to take action in the markets.

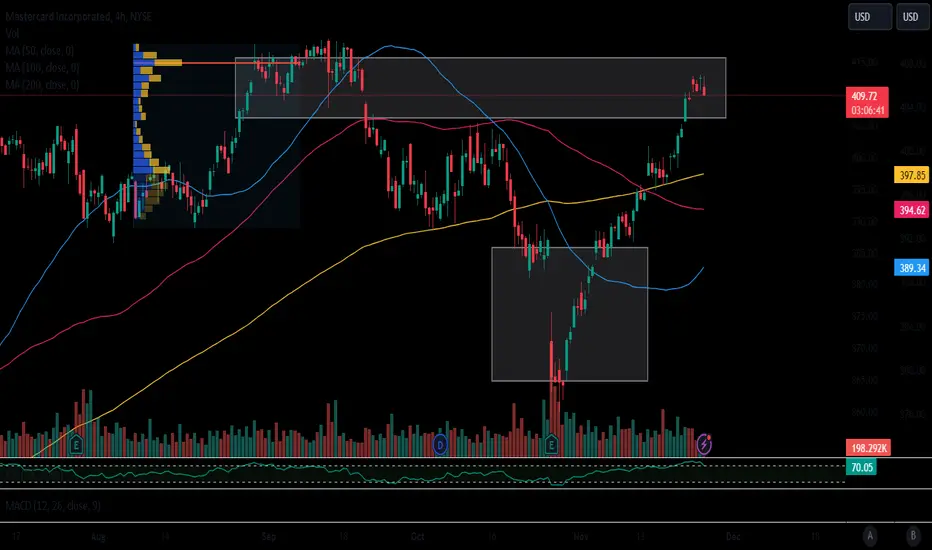
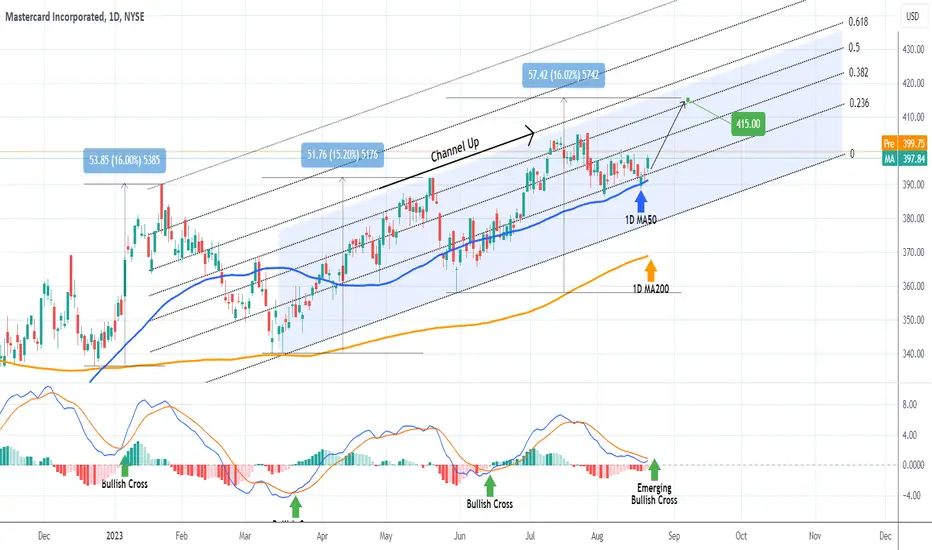
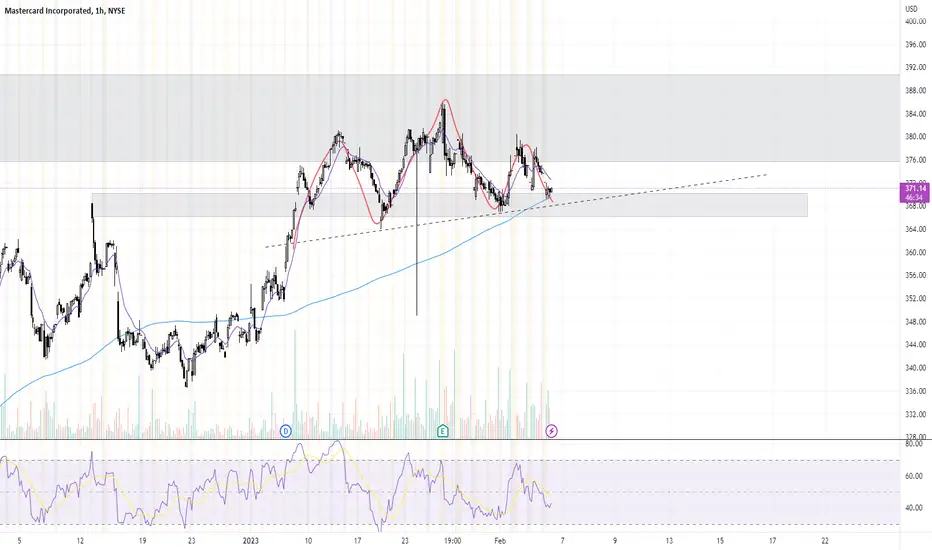
MASTERCARD On a buy signalIt's been too long since we last looked into a Mastercard Inc (MA) trade, with last time though (see chart below) providing a good pull-back buy opportunity:
This time the price is on a 1D MA50 (blue trend-line) rebound, in fact a Double Bottom rebound if we count the August 03 Low. With the 1D MACD about to give the ultimate buy confirmation on the Bullish Cross (you can buy after it is formed), we are bullish, targeting 415 (completes a +16.00% rise).
The long-term pattern is a Channel Up since the March 16 Low. Any closing above it, brings the upper Fibonacci levels in focus as potential targets.
-------------------------------------------------------------------------------
** Please LIKE 👍, FOLLOW ✅, SHARE 🙌 and COMMENT ✍ if you enjoy this idea! Also share your ideas and charts in the comments section below! **
-------------------------------------------------------------------------------
💸💸💸💸💸💸
👇 👇 👇 👇 👇 👇
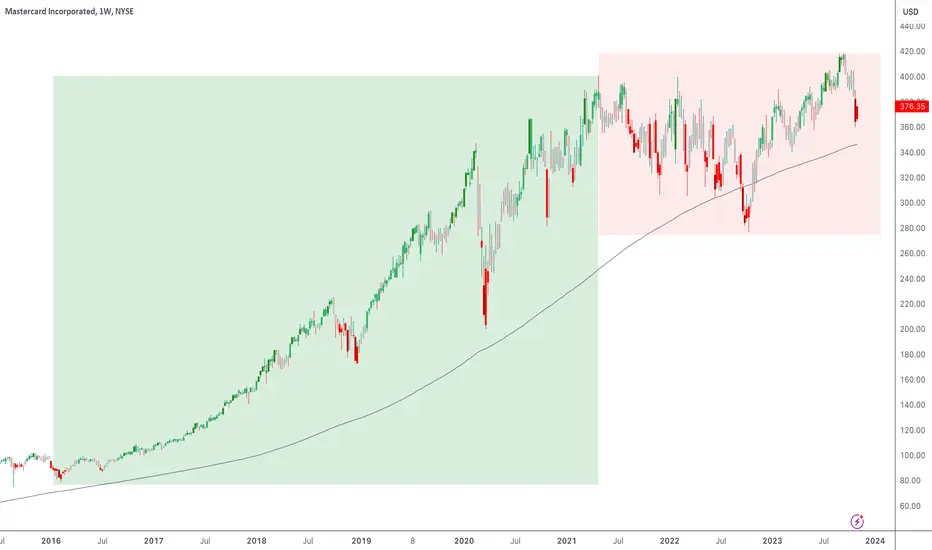
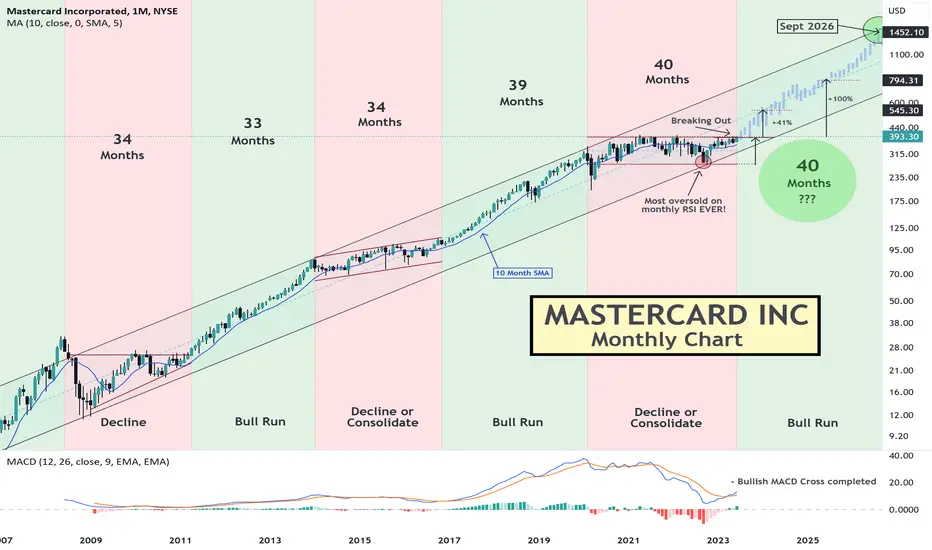
Mastercard a long term opportunityMastercard Inc NYSE:MA
- Historically cycles are between 34 - 40 months
- Now on month 40 of a decline/consolidation cycle
- New cycle into bull phase highly probable
- Above 10 month, 200 week & 200 day SMA
- Recently had lowest oversold RSI level ever!
- Monthly MACD Cross
In addition to the above points, a number of bullish parameters are lining up on the chart.
On the daily and the weekly we breaking out of a parallel channel. We are testing the upper resistance of the parallel channel for the 5th time and appear to be breaking through. Parallel channels have one of thee best records in terms of trading pattern success rates.
The RSI was at its most oversold level ever in Sept 2022 and this may have acted as a spring to help propel price with enough momentum to breach through the overhead resistance.
In summary, the cycles suggest we are about to move into a bull market with the aid of a price spring from significantly oversold levels. We are breaking out of a parallel channel and have the 10 month, 200 week and 200 day SMA's under price as support and they are all sloping upwards.
The parallel channel target provides +41% return (see chart). I have also shown were a 100% return would fall on the chart. If we were to reach the top of the channel within the typical 40 month cycle by Sept 2026 we could see a 200% return in what is a very well entrenched and established stock/company.
NYSE:MA is highly established entity as the 20th largest company in the world by market cap at $372bln. A 2x in market cap would make it a $1 trillion company (how likely this is I don't know). Mastercard pay a very small $0.57 dividend each quarter per share ($2.83 annualized). Its less than a percent in dividend yield but its something else to factor in.
KEY DATE: Earnings report on 27th July 2022 (no negative earnings report since 2020).
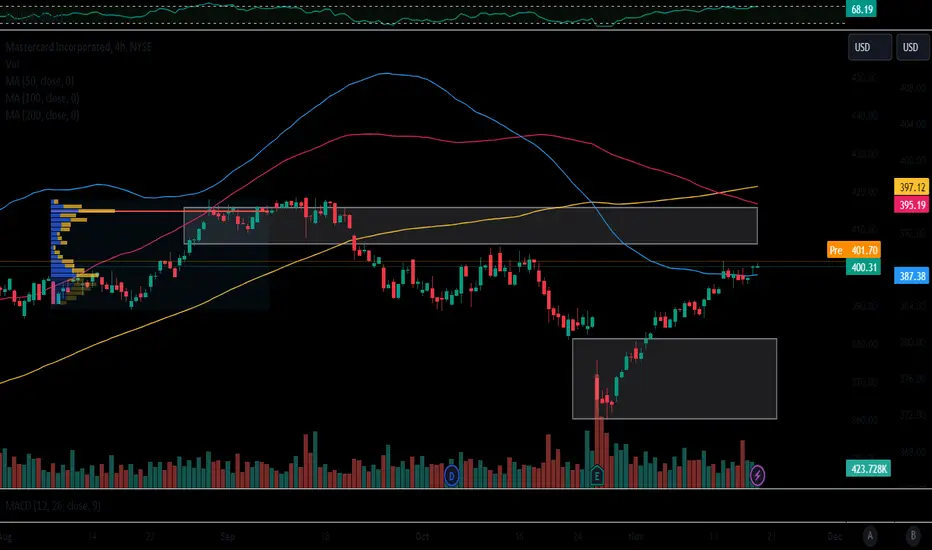
Mastercard (MA) | ATH Monthly & Weekly Candle Close Confirmed!Hi,
The second technical confirmation after the June close (the first one was a previous idea Walmart) came from Mastercard (MA), buy the strength. Almost the same setup as Walmart has.
Mastercard is one of the largest payment processors in the world, having processed close to over $8 trillion in transactions in 2022. Mastercard operates in over 200 countries and processes transactions in over 150 currencies.
$380 to $400 the hardest fight in Mastercard history. Haven't been such a price level or price action at where the price of MA has been stuck so long. Actually, the fight is not fully over but the price action and the market sentiment are quite promising. The fight is not completely over because it would be ideal if we have also a monthly candle close above $400. Atm we have a weekly candle close above it so at least we have there something and it is already a good sign.
Now, the real technical reason why I want to share it is that MA got the highest monthly candle close and it occurred slightly above the strongest price level in that area. Plus, we have also the highest weekly candle close, and it's above $400.
I, personally, like this close, general price action looks bullish, and as said, recent market sentiment is also favorable.
* Considering technical analysis then the optimal buying zone should stay from current prices to $370
* First target $500
Good luck!

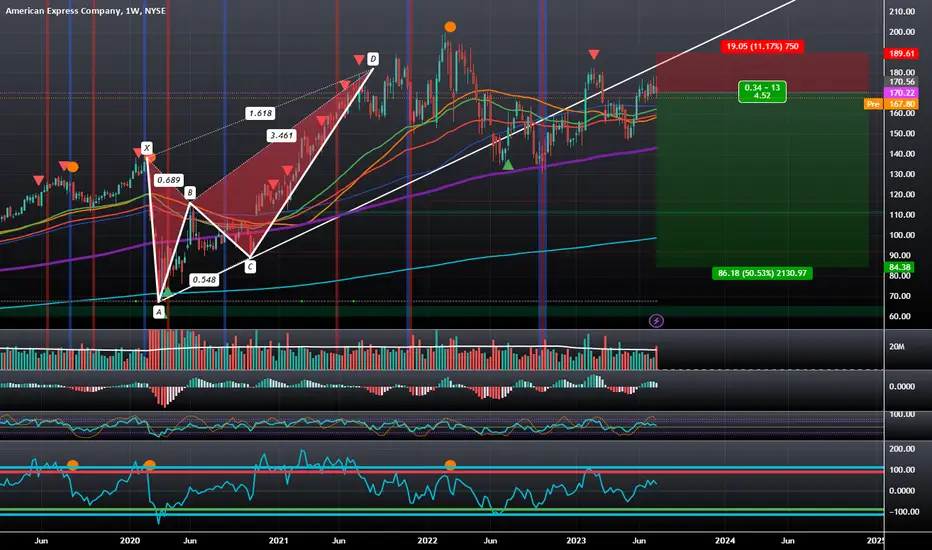
AXP: Confirming Break Below Lead-In Trend at Bearish Crab PCZAmerican Express has broken below the Lead-In trend line and looks to be confirming a lower high below the breakdown zone, all at the PCZ of a Bearish Crab on the Weekly Timeframe.
If we get the desired performance from this we should see AXP go down about 30-60% from the current levels.
Mastercard Incorporated WCA - Rectangle PatternCompany: Mastercard Incorporated
Ticker: MA
Exchange: NYSE
Sector: Financials
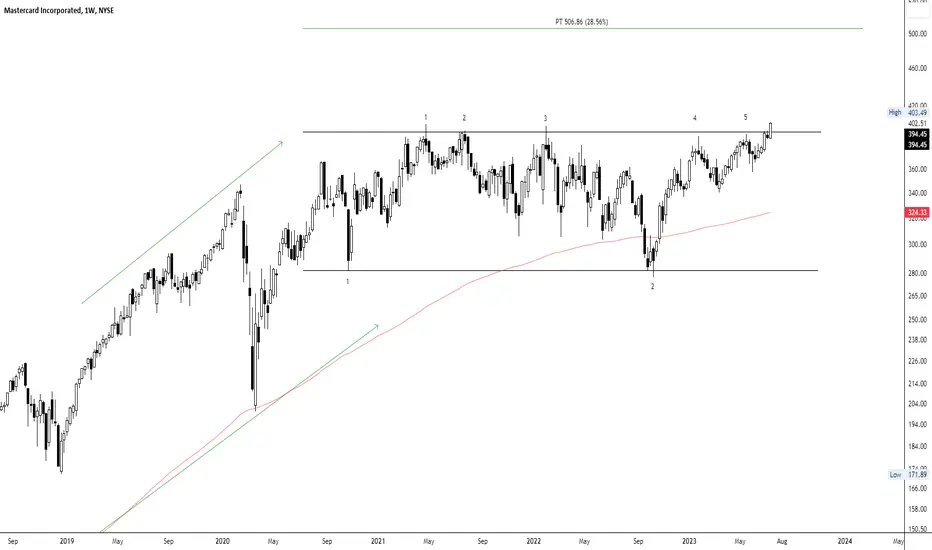
Introduction:
Our focus today is on Mastercard Incorporated (MA), a heavyweight in the Financial sector, listed on the NYSE. The weekly chart is revealing a Rectangle pattern, which indicates a potential bullish continuation.
Rectangle Pattern:
The Rectangle pattern typically appears during periods of market consolidation and can suggest a continuation/reversal of the trend, bullish or bearish, depending on the breakout direction. It is defined by a trading range where the price oscillates between a clear support and resistance level.
Analysis:
Previously, Mastercard was clearly in an uptrend, which was interrupted by a consolidation phase forming a Rectangle. This pattern, lasting for 1092 days, is interpreted as a bullish continuation. There are five touch points on the rectangle's upper boundary and two on the lower one.
Currently, the price is above the 200 EMA, which supports our idea to look for bullish opportunities. The latest candle movement shows the price breaking above the rectangle's upper boundary, signaling a potential long entry point.
Assuming a valid breakout, the price target is set at 506.86, suggesting a potential gain of approximately 28.56%.
Conclusion:
Mastercard's weekly chart presents a promising setup with a bullish Rectangle breakout, indicating a potential continuation of the uptrend. This setup could offer an excellent long trading opportunity.
As always, this analysis should be used in conjunction with your overall market research and risk management strategy, and not as direct trading advice.
If you found this analysis helpful, please consider liking, sharing, and following for more insights. Wishing you profitable trading!
Best regards,
Karim Subhieh
Disclaimer: This analysis is not financial advice and is intended for educational purposes only. Always conduct your own research and consult with a financial advisor before making investment decisions.
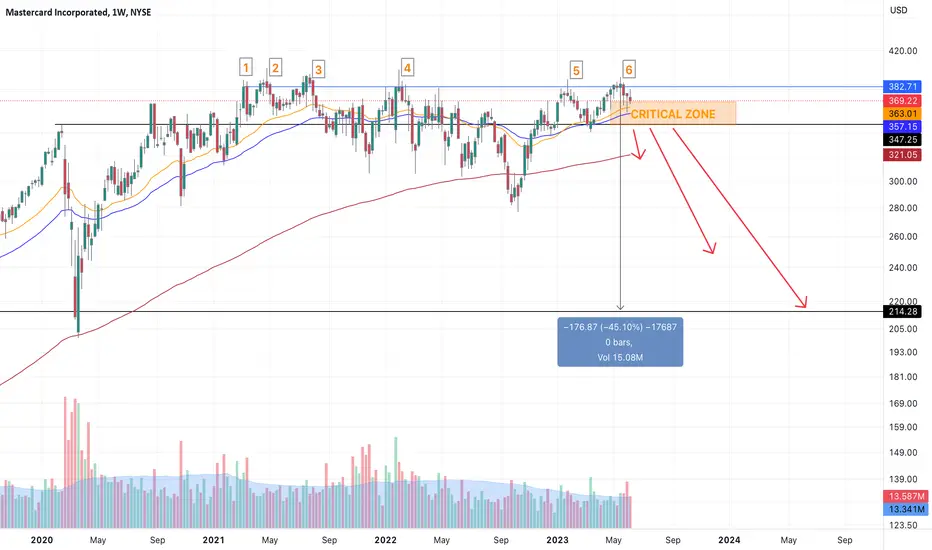
MA is seems to be weak.MA is showing weakness on 1W chart.
There is a big sell zone near 382$ where buyers have tried to win sellers, but all 6 attempts (mentioned on chart) were losing.
I expect two signals of weakness that will give confirmation of closing long position/ opening short position.
First signal is closing 1W candle under ema50 (about 357$ at mom). (This signal will be very strong, because it will be multiplied it strength with closing 1D candle under ema200, that is a confirmation for closing long position).
Second signal is closing 1W under critical level 347$ - that will be confirmation of opening short position.
Main targets are shown on chart and now are
320$, 250$, 215$.
You need to be very patient and wait until confirmation of next bullish market on this stock, big bounce (about +20%) I expect on 215$ (-45% from high 2023). Big bullish trend will be later, when chart will build again a structure: Price>ema30>ema50>ema200.
MA are you rdy for short ?🧨🧨👌The master card company is the leader of the financial fraudsters
What we are seeing in the Mastercard trend is an upward trend, because when more money is printed and economies go towards destruction, at first glance, we can see that the shares of banking companies will grow, but let me listen to my friends. It has and should be prepared for the fact that MasterCard shares will fall badly. Although this company wants to resist, you cannot fight with numbers. This number you see is just a bubble that will burst soon.
The future targets of MasterCard shares are $341.31, the next target is $316.71, and the third target is $279.19, which should be seen and will be seen.
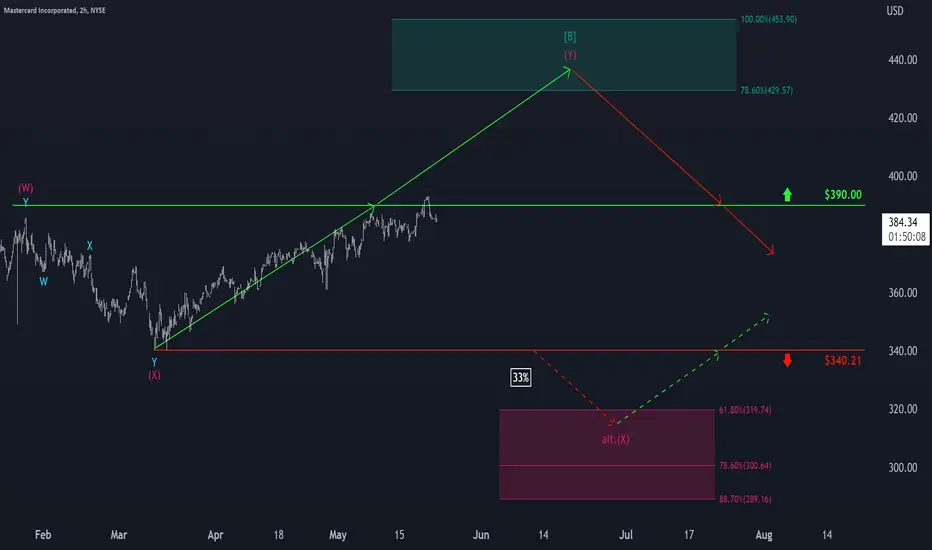
Mastercard: Master the Hurdle! 🚧Mastercard should activate more upwards momentum to make it above the resistance at $390 – a feat in which it has succeeded already, albeit temporarily. Once above this mark, the share should vault into the green zone between $429.57 and $453.90 to complete wave B in green before returning below $390 again. However, we must keep in mind our alternative scenario with a probability of 33%: Mastercard might drop below the support at $340.21 to develop a new low first before heading further upwards. We would then expect this new low in the form of wave alt.(X) in magenta in the magenta-colored zone between $319.74 and $289.16.
V Visa Options Ahead of EarningsIf you haven`t sold V Visa here, for a better reentry:
Then analyzing the options chain of V Visa prior to the earnings report this week,
I would consider buying the 230usd strike price Puts with
an expiration date of 2023-6-16
for a premium of approximately $5.65.
If these options prove to be profitable prior to the earnings release, I would sell at least half of them.
I am interested to hear your thoughts on this strategy.

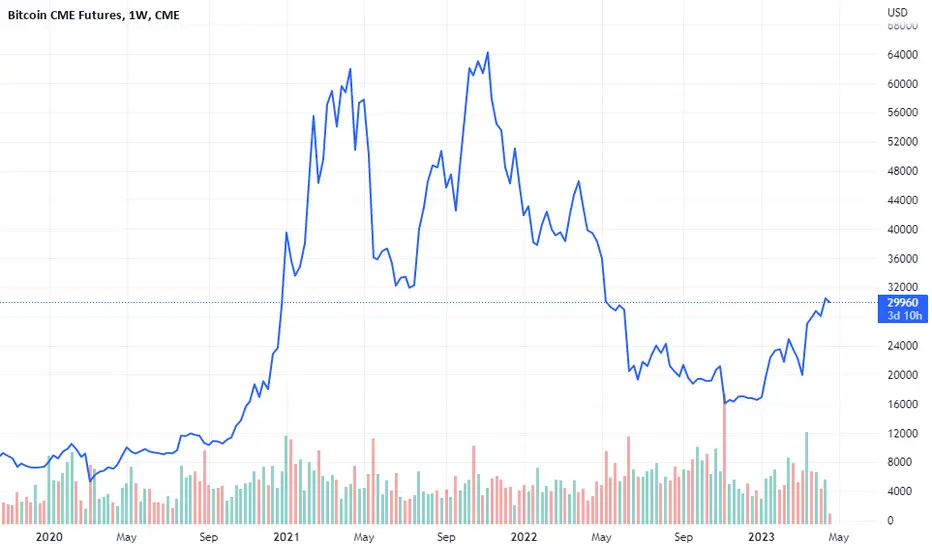
Digital Assets Outlook 2023Digital assets have had a strong early 2023
Digital asset prices, led by Bitcoin, have had a strong 2023 so far. Bitcoin is up by over 70% this year and Ether is up by over 50%1. Together, these two assets still account for over 63% of the total market cap of the digital assets space. While the US Federal Reserve (Fed) is still raising interest rates, the market seems to expect that the recent bank failures (Silvergate Bank, Signature Bank, Silicon Valley Bank, Credit Suisse) will lead to central bank easing. Lower interest rates would benefit long-maturity assets, such as digital assets. Moreover, several traders have been caught off-guard and short-sellers expecting more downside in digital assets have had to liquidate positions leading to higher prices.
We believe we could be on the cusp of the fourth major bull market in crypto, although the exact timing is uncertain. Our belief is that the next bull market will be enabled by advancements in speed and scalability of the blockchain networks, more intuitive user interfaces, and innovations in blockchain wallets, as well as developments in digital identity, which will pave the way for Web3 applications. The critical determinant, of course, will be the user applications that will take the market by storm and we will keep monitoring potential candidates on a continuous basis.
Despite dismal price action last year, digital assets are supported by a healthy and vibrant software developer community. The number of monthly active developers actually rose last year by 5%2, which is significant, and confirms our view that developers remain actively engaged in their respective blockchain ecosystems.
Layer 2 networks finally coming into their own, promising to solve the scalability issue
The main impediment of current Bitcoin and Ethereum networks has been their inability to handle a large volume of transactions. It is estimated that, without a layer 2 solution, Bitcoin can only handle approximately 7-10 transactions per second while Ethereum can only handle approximately 15-30 transactions per second. While it is on Ethereum’s road map to be able to ultimately handle 50,000-100,000 transactions per second, this is not a reality at the moment. As a contrast, Visa is said to handle at least 1,700 transactions per second although there are some estimates that Visa could handle up to 24,000 transactions per second and Visa itself is claiming this number to be as high as 65,000 transactions per second3.
One way to solve the scalability issue of blockchains is to use a layer 2 network, which is built on top of a layer 1 blockchain. Layer 2 networks move transactions off-chain, roll them up and bundle multiple transactions into a single transaction, which can then be secured on the layer 1 blockchain benefiting from underlying blockchain’s security and robustness. This bundling enables faster throughput, faster settlement, and lower prices. For Bitcoin, the most well-known layer 2 solution is the Lightning Network, while for Ethereum there are several options available, including optimistic rollups, zero-knowledge rollups (ZK rollups) and sidechains. It is also worth mentioning that the Ethereum network is expected to go through so called ‘sharding’ later this year, which is expected to split the network into separate ‘shards’ thereby increasing the capacity of the network and reducing the transaction (gas) fees in the process.
Digital USD tokens emerging as a major use case
Stablecoins, digital tokens issued on public blockchains and pegged to an underlying asset, such as a currency or a physical asset, were initially used in trading and interexchange settlement but have become increasingly popular in payments and remittances. Because stablecoins are global and accessible to anyone, they offer an attractive way to cheaply and securely transmit money around the world 24/7 and settle transactions (almost) instantaneously. The world’s largest stablecoin, Tether’s USDT, is particularly popular in Asia, while in the West Circle’s USDC is widely used. Stablecoins are designed to offer stability while an asset like Bitcoin is more volatile.
To give an idea of the magnitude of transaction volumes, last year, Visa settled HKEX:12 trillion worth of payments, mainly related to consumer spending, while stablecoins settled HKEX:8 trillion worth of on-chain transactions, higher than the $2.2 trillion settled by Mastercard or HKEX:1 trillion settled by American Express4. This year, it is possible that the combined amount of stablecoin transactions exceeds the payments settled by Visa. These stablecoin transaction volumes, of course, are not related to consumer spending but rather to payments, trading and decentralised finance, and do not take into account trading volumes on centralised exchanges.
Competition for instant payments heating up
The market for instant settlement of payments seems to be in flux at the moment. Crypto regulation in both Europe and the US are focusing on stablecoins and are expected to set stringent reserve requirements for stablecoin issuers and also forbid interest being paid to stablecoin holders. We view transparency requirements into reserve assets of stablecoin issuers important but also believe that attention should be paid into issuers’ risk management, cybersecurity, and blockchain code testing quality.
In the US, the Federal Reserve is planning to launch an instant payment system called FedNow in July 2023. The network will not be based on blockchain but will be able to settle payments in seconds and can support transactions between consumers, merchants, and banks. Some believe that the closure of Silvergate’s SEN network and Signature Bank’s SigNet network in mid-March 2023, both offering instant settlement service where clients were able to move assets between fiat currencies and crypto exchanges at any time, could have had something to do with the launch of FedNow. Around the world, central bank digital currencies (CBDCs) are also being actively developed. They offer a digital form of a government-issued currency that is not pegged to any physical commodity and these digital currencies will continue to be based on the fractional reserve banking system.
In Europe, the European Commission adopted a legislative proposal in late October 2022 that mandates all banks to offer instant euro payments to any individual with a bank account in the eurozone. At the moment, the EU banking sector, on average, lags behind other major international markets in instant payments, although single-country solutions have been adopted and variations between countries are large. In some European countries, instant payments cover 70% of banks but, in others, only 1% of payments are settled instantly. The European banking sector has stated that they need up to two years to make banks instant-payment ready5.
Europe has its own version of an instant settlement network. BCB Group, regulated in the UK and Switzerland, offers BLINC network that links crypto companies to the banking system and enables business accounts to trade in fiat and digital assets 24/7. The company already offers fiat-to-crypto rails in sterling, euros, Swiss francs, and yen in Europe and plans to add USD fiat-to-crypto rails by early Q2 2023. BCB’s goal is to plug the gaps left by the SEN network. Unlike SEN, BLINC is multicurrency-based and is not tied to any single credit institution. It was designed as a payment institution to provide on-ramps to banks in Europe, the UK and Switzerland. The company emphasises that its funds are always 1:1 backed and are unleveraged and un-rehyphothecated6.
Sources
1 Source: Coingecko.com
2 Source: Electric Capital, 2022 Developer Report
3 Source: Visa Fact Sheet, 2022
4 Source: CoinMetrics
5 Source: Euromoney
6 Source: BCB Group, Coindesk
MA - MASTERCARD (7M/3D)✨ LONG-TERM DOWNTREND ✨
SLO @ 383.30
SSO @ 346.50
TP1 @ 290.00 (shave 50%)
TP2 @ 227.10 (shave 50%)
TP3 @ 199.99 (shave 50%)
TP4 @ 130.00 (close trade)
BLO @ 100.00

Weakness in Mastercard detected. MADivergence and a highly likely start of a new cycle on the daily appears to be on the cards here. Is this a new Wave A on its descent down?
We are not in the business of getting every prediction right, no one ever does and that is not the aim of the game. The Fibonacci targets are highlighted in purple with invalidation in red. Confirmation level, where relevant, is a pink dotted, finite line. Fibonacci goals, it is prudent to suggest, are nothing more than mere fractally evident and therefore statistically likely levels that the market will go to. Having said that, the market will always do what it wants and always has a mind of its own. Therefore, none of this is financial advice, so do your own research and rely only on your own analysis. Trading is a true one man sport. Good luck out there and stay safe.

MA H&S, awaiting confirmationClear Head and Shoulder, waiting for validation of breakdown below support(s).
Mastercard continues to be mixed and volatile. Mastercard - 30d expiry - We look to Sell a break of 335.88 (stop at 345.02)
Trading has been mixed and volatile.
A break of the recent low at 336.02 should result in a further move lower.
Although the bulls are in control, the stalling positive momentum indicates a turnaround is possible. Short term bias has turned negative.
A higher correction is expected.
Our profit targets will be 314.04 and 310.04
Resistance: 350.00 / 360.00 / 369.26
Support: 336.00 / 330.00 / 320.00
Disclaimer – Saxo Bank Group.
Please be reminded – you alone are responsible for your trading – both gains and losses. There is a very high degree of risk involved in trading. The technical analysis , like any and all indicators, strategies, columns, articles and other features accessible on/though this site (including those from Signal Centre) are for informational purposes only and should not be construed as investment advice by you. Such technical analysis are believed to be obtained from sources believed to be reliable, but not warrant their respective completeness or accuracy, or warrant any results from the use of the information. Your use of the technical analysis , as would also your use of any and all mentioned indicators, strategies, columns, articles and all other features, is entirely at your own risk and it is your sole responsibility to evaluate the accuracy, completeness and usefulness (including suitability) of the information. You should assess the risk of any trade with your financial adviser and make your own independent decision(s) regarding any tradable products which may be the subject matter of the technical analysis or any of the said indicators, strategies, columns, articles and all other features.
Please also be reminded that if despite the above, any of the said technical analysis (or any of the said indicators, strategies, columns, articles and other features accessible on/through this site) is found to be advisory or a recommendation; and not merely informational in nature, the same is in any event provided with the intention of being for general circulation and availability only. As such it is not intended to and does not form part of any offer or recommendation directed at you specifically, or have any regard to the investment objectives, financial situation or needs of yourself or any other specific person. Before committing to a trade or investment therefore, please seek advice from a financial or other professional adviser regarding the suitability of the product for you and (where available) read the relevant product offer/description documents, including the risk disclosures. If you do not wish to seek such financial advice, please still exercise your mind and consider carefully whether the product is suitable for you because you alone remain responsible for your trading – both gains and losses.

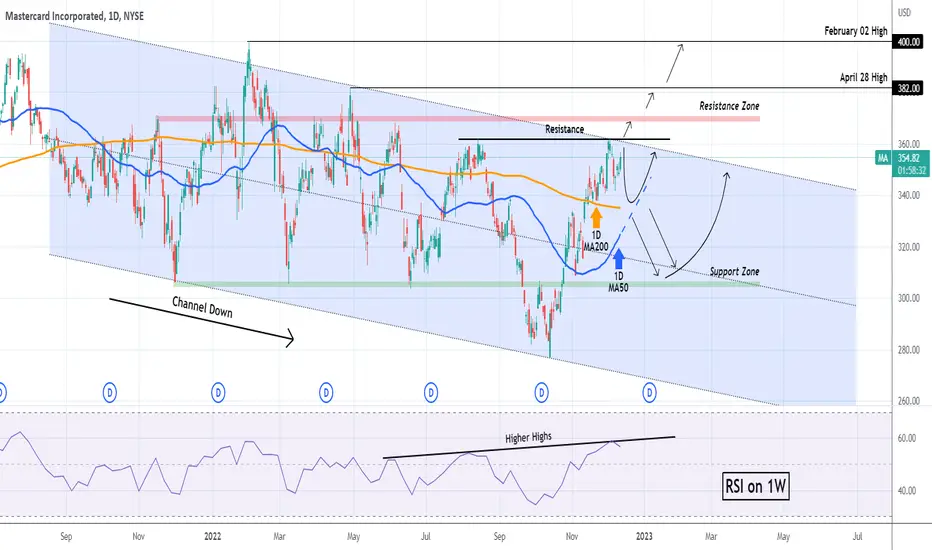
MASTERCARD About to break into long-term bullish territoryMastercard Inc (MA) is rebounding again back towards the top of its +1 year Channel Down pattern after the December 02 rejection on the 262.000 Resistance, which happened to be also at the top (Lower Highs trend-line) of the Channel.
If the price breaks above, that alone would be a major bullish break-out signal for the long-term but ideally we would like to see a cross above the (red) Resistance Zone for confirmation. Beyond that, the upside targets are the 382.00 April 28 High and 400.00 February 02 High.
If on the other hand the 1D MA50 (blue trend-line) breaks first, we expect a pull-back to the (green) Support Zone (around 305.00) before the uptrend is resumed.
-------------------------------------------------------------------------------
** Please LIKE 👍, SUBSCRIBE ✅, SHARE 🙌 and COMMENT ✍ if you enjoy this idea! Also share your ideas and charts in the comments section below! This is best way to keep it relevant, support me, keep the content here free and allow the idea to reach as many people as possible. **
-------------------------------------------------------------------------------
You may also TELL ME 🙋♀️🙋♂️ in the comments section which symbol you want me to analyze next and on which time-frame. The one with the most posts will be published tomorrow! 👏🎁
-------------------------------------------------------------------------------
💸💸💸💸💸💸
👇 👇 👇 👇 👇 👇
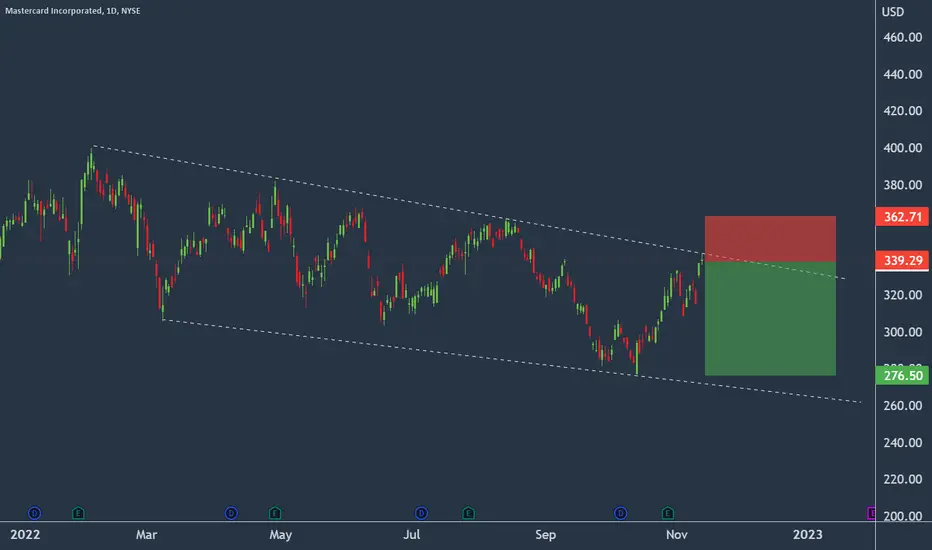
MA: End of bearmarket rally?!Mastercard
Intraday - We look to Sell a break of 338.10 (stop at 362.71)
The primary trend remains bearish. Trading within the Wedge formation. A move higher faces tough resistance and we remain cautious on upside potential. Further downside is expected. A clear break of 338.10 and we would look for further gains to 276.50.
Our profit targets will be 276.50 and 260.00
Resistance: 343.00 / 380.00 / 420.00
Support: 280.00 / 230.00 / 160.00
Please be advised that the information presented on TradingView is provided to Vantage (‘Vantage Global Limited’, ‘we’) by a third-party provider (‘Signal Centre’) . Please be reminded that you are solely responsible for the trading decisions on your account. There is a very high degree of risk involved in trading. Any information and/or content is intended entirely for research, educational and informational purposes only and does not constitute investment or consultation advice or investment strategy. The information is not tailored to the investment needs of any specific person and therefore does not involve a consideration of any of the investment objectives, financial situation or needs of any viewer that may receive it. Kindly also note that past performance is not a reliable indicator of future results. Actual results may differ materially from those anticipated in forward-looking or past performance statements. We assume no liability as to the accuracy or completeness of any of the information and/or content provided herein and the Company cannot be held responsible for any omission, mistake nor for any loss or damage including without limitation to any loss of profit which may arise from reliance on any information supplied by Signal Centre.