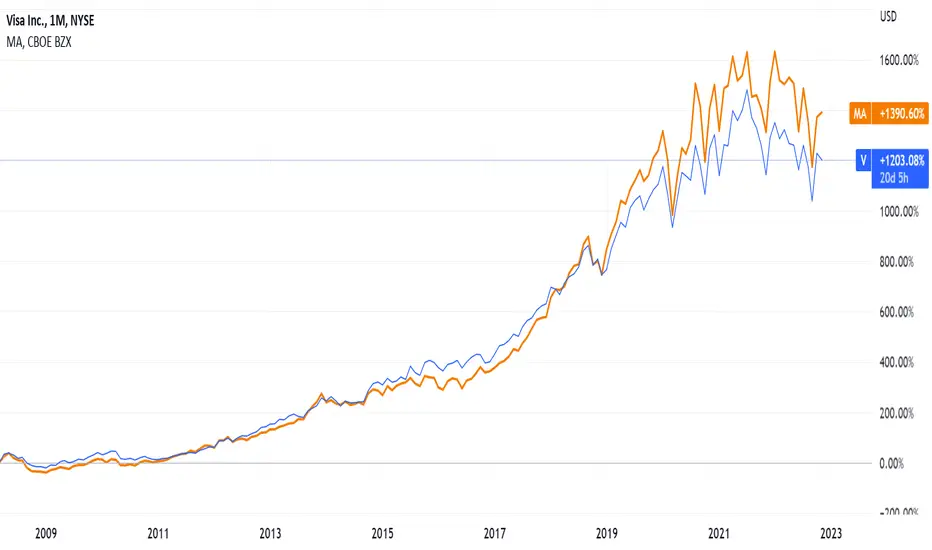
An easy way to lower the risk profile of your stock portfolioThe correlation between Visa and Mastercard creates an interesting investment trick.
I began this analysis not even looking for the correlation between these two companies' stock prices. But rather I was looking for some chart patterns using a stock screener. At the top of the list, these two companies emerged. As usual, I was going to go through the stock charts of all the companies in the list briefly to determine if they hold any chart pattern merit.
However, as I scanned over Visa, and then Mastercard, I noticed they looked extremely similar. Weird. I then opened up Tradingview and put these stocks in. Side by side they look the same.
These two companies have very similar price movements. No surprise, they are very similar companies. They are direct competitors. They are both big players in the global credit services market. Transacting trillions of dollars in total payments volumes per year. They’re both tech companies that connect the consumer and the merchant digitally for transactions. They have been seen as rivals for over a decade now. Neither Visa nor Mastercard are involved in extending credit or issuing cards. They work in a co-branded relationship with the card provider. That's why you will see their logos on your credit card but won’t see a full absolute Mastercard/Visa credit card.
Visa is generally larger in terms of the transaction, purchase volume and cards in circulation. However, Mastercard growth has been picking up and may see a catch-up.
Now let’s get back to the price movement analysis. I have split this up into three time periods and then done a Pearson Correlation Test. The first period is the matched IPO date to the current date. The next is the last 5 years and then the last 2 years.
The reason for the three time periods is simple. I want to do a full IPO to current date analysis to get the full picture and long-term perspective. A 5-year analysis because if you look at the charts above, that’s when the volatility in the stocks picks up. The last 2 years, because if you look again at the charts above, some crazy price movements have been occurring in the last two years that do not follow the past 14-year trend.
The closer to +1, the closer the correlation.
March 2008 - Nov 2022: 0.83
Nov 2017 - Nov 2022: 0.92
Nov 2020 - Nov 2022: 0.90
As you can see from the above stats both of these stocks have a close relationship with each other. A higher correlation in recent years. Of course, correlation doesn’t mean causation. However, the fact that these two companies are very similar and direct competitors means that one could form a reasonable conclusion. Not that one stock is affecting the other price. But rather than investors see these two companies as very similar. Such that when they exit one, they exit the other. Unless there is a big reason not to. But as you can see from the stats above. The stocks have a close correlation over the last 14 years such that even if one says that, let, for example, Visa is going to grow faster than Mastercard, the chances are - Mastercard wouldn’t be far behind.
Henceforth, this leads to an interesting investment tip:
Let’s say you want to diversify your portfolio by gaining some exposure to the credit services industry. Since Visa and Mastercard are the two leading companies, you chose them. However, you only have enough money to invest in one. But you also want to lower the risk profile of your portfolio. Is there a way both can be done?
The answer is yes, since Visa and Mastercard have such a close correlation and are very big established companies they will most likely follow each other in price movement. Also, since they are two different companies, you will be diversifying your investment and will be lowering your risk. So, you divide that last portion of your portfolio into two smaller portions and buy Visa and Mastercard 50:50. This will mean you get the exposure you are after, the returns as well since they have a close correlation, and the risk is lowered since they are two separate companies. Quite a cool trick is not it?
I created three different portfolios. Each beginning with $10,000. I invested the full out in two of them into Visa and Mastercard. The last portfolio had a 50:50 split. I then calculated the standard daily deviation and the annualized standard deviation. Here are the results:
Visa 100%:
Start value: $10,000
End value: $137,295.57
Annualized STD: 29.60%
Mastercard 100%:
Start value: $10,000
End value: $151,466.00
Annualized STD: 32.30%
Visa 50% Mastercard 50%:
Start value: $10,000
End value: $144,380.79
Annualized STD: 29.50%
As you can see from the above stats, once the two stocks have been combined the standard deviation drops by 8.67% and the standard deviation is lower than the two stocks individually. This means the risk is lower. However, yes, the final value isn’t as high as the Mastercard 100% the returns are higher than the sole Visa 100% portfolio by 5.10%. So, in other words, the risk has been lowered than if you had individual portfolios and the returns are higher as well. Of course, the returns aren’t as high as they are in the Mastercard 100% portfolio, but the risk is lower while still ensuring higher returns. This means the Visa 50% Mastercard 50% portfolio provides an effective way to reduce risk while increasing returns.
However, one thing to note is the maximum drawdown was the lowest in the Mastercard 100% portfolio. The second lowest is Visa 50% Mastercard 50%. Highest in Visa 50%. So, ensure that if you are going to follow this strategy, there is more research to be done and it is best worked in a long-term investment strategy possibly combined with dollar cost averaging.
To conclude, if you want to see a higher return while lowering the risk profile of your portfolio. It pays to diversify with similar correlating assets.
Mastercard
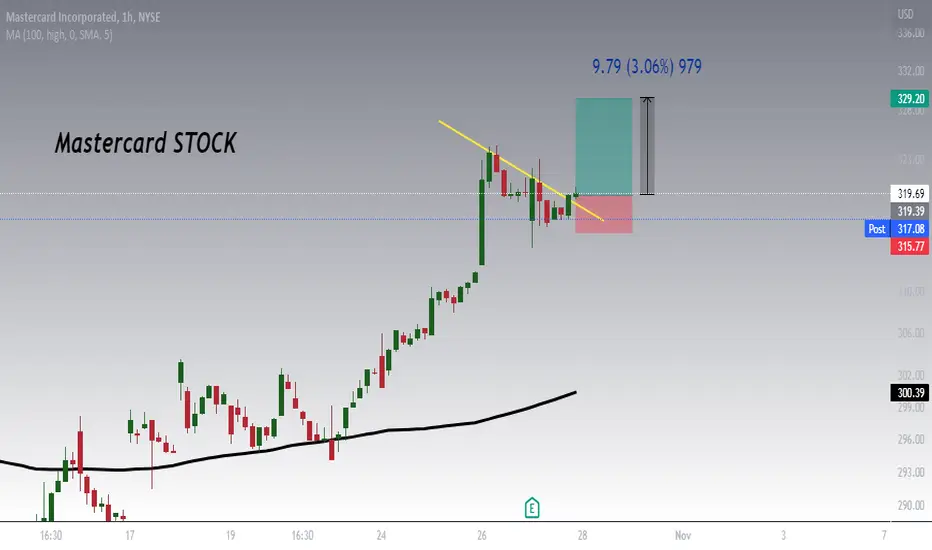
mastercard to 329.20$Hello ladies and gentlemen, according to my chart analysis and the earnings of mastercard , there is a high probability of an increase towards over 329.20$
MANot financial advice. The essence of investing & trading is the intelligent and patient preying on the greed, fear, impatience, addiction and ignorance of the majority. It's definitionally Darwinian.

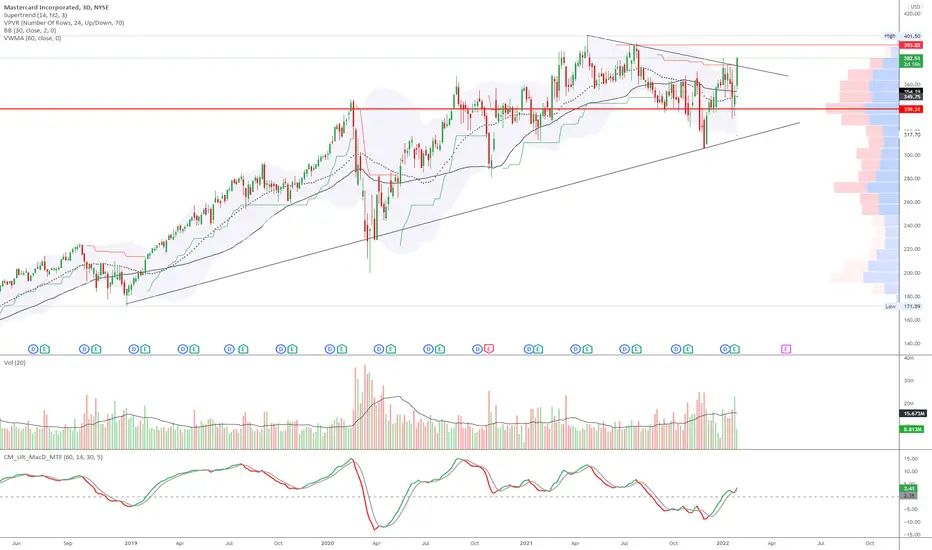
Mastercard flailing in the waves.Another bearish pattern here.
We are not in the business of getting every prediction right, no one ever does and that is not the aim of the game. The Fibonacci targets are highlighted in purple with invalidation in red. Confirmation level, where relevant, is a pink dotted, finite line. Fibonacci goals, it is prudent to suggest, are nothing more than mere fractally evident and therefore statistically likely levels that the market will go to. Having said that, the market will always do what it wants and always has a mind of its own. Therefore, none of this is financial advice, so do your own research and rely only on your own analysis. Trading is a true one man sport. Good luck out there and stay safe.

An Masterbuy!Mastercard - Intraday - We look to Buy at 309.31 (stop at 301.98)
Support is located at 310.00 and should stem dips to this area.
Weekly pivot is at 304.71.
Weekly pivot is at 303.19.
Dips continue to attract buyers.
The primary trend remains bullish.
The RSI is trending lower.
We look for a temporary move lower.
Our profit targets will be 329.69 and 336.69
Resistance: 330.00 / 335.00 / 340.00
Support: 320.00 / 315.00 / 310.00
Weekly chart for context
Disclaimer – Saxo Bank Group. Please be reminded – you alone are responsible for your trading – both gains and losses.
There is a very high degree of risk involved in trading. The technical analysis , like any and all indicators, strategies, columns, articles and other features accessible on/though this site (including those from Signal Centre) are for informational purposes only and should not be construed as investment advice by you. Such technical analysis are believed to be obtained from sources believed to be reliable, but not warrant their respective completeness or accuracy, or warrant any results from the use of the information. Your use of the technical analysis , as would also your use of any and all mentioned indicators, strategies, columns, articles and all other features, is entirely at your own risk and it is your sole responsibility to evaluate the accuracy, completeness and usefulness (including suitability) of the information. You should assess the risk of any trade with your financial adviser and make your own independent decision(s) regarding any tradable products which may be the subject matter of the technical analysis or any of the said indicators, strategies, columns, articles and all other features.
Please also be reminded that if despite the above, any of the said technical analysis (or any of the said indicators, strategies, columns, articles and other features accessible on/through this site) is found to be advisory or a recommendation; and not merely informational in nature, the same is in any event provided with the intention of being for general circulation and availability only. As such it is not intended to and does not form part of any offer or recommendation directed at you specifically, or have any regard to the investment objectives, financial situation or needs of yourself or any other specific person. Before committing to a trade or investment therefore, please seek advice from a financial or other professional adviser regarding the suitability of the product for you and (where available) read the relevant product offer/description documents, including the risk disclosures. If you do not wish to seek such financial advice, please still exercise your mind and consider carefully whether the product is suitable for you because you alone remain responsible for your trading – both gains and losses.
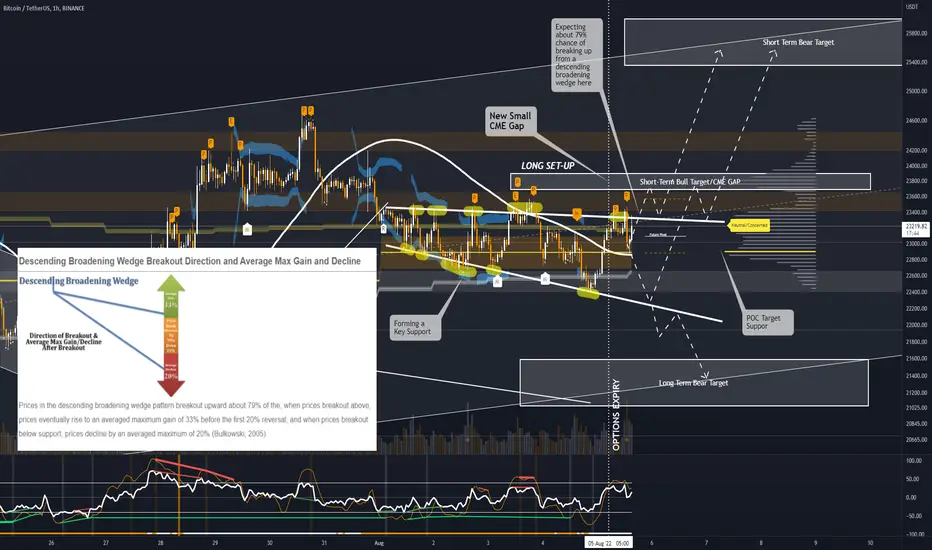
🤖 #BTCLIVE - 05.08 - #IDEA 🤖🤖 #BTCLIVE - 05.08 - #IDEA 🤖
70:30 Long-Term
Bullish:Bearish
Technical Analysis:
Current Status:
Confirmed a descending broadening wedge - since the 1st August with the latest to failed breakouts. These are particularly bullish patterns - based on historical data showing a 79% frequency of breaking up from them. In the same data set it is claiming a 33%, although suggest you ignore that. With options expiration there is expected volatility which could see the breakout happen today although based on the most recent rejection we have seen some good support come at the POC line and 20 DEMA was lying in wait just below too. If it breaks out again things are turning v.bullish although breakout is not confirmed yet.
Bullish Scenario
Breaking and retesting $23.4k will see a short term target of approx. $24k and a bigger term target of $25.5k
Bearish Scenario
A Break down and retest of $22.7k will likely start the descent to $21.5k at the lower range of the longer term - breaking down on that will spell major bloodshed.
Key News:
- Pornhub no longer uses VISA/Mastercard likely to fall back on Crypto
- Coinbase has received a class action lawsuit alleging the #crypto exchange made false claims regarding its business activities
- Options Expiration
- Elon Musk said to expect a recession
Metrics:
Exchange
+ Exchange Reserve - As the exchange reserve continues to fall, it indicates lower selling pressure.
- Exchange Netflow Total - Net deposits on exchanges are high compared to the 7-day average. Higher deposits can be interpreted as higher selling pressure.
Miners
/ Miners' Position Index (MPI) - Miners' are selling holdings in a moderate range compared to its one-year average.
+ Puell Multiple - Miner's revenue is decreasing significantly compared to the cost they put in. This could indicate that price is undervalued along with the increasing miner's motive to hold their coins.
On-Chain
+ aSOPR More investors are selling at a loss. In the middle of a bear market, it can indicate a market bottom.
+ Binary CDD - Long term holders' movement in the last 7days were lower than the average. They have a motive to hold their coins.
+ Net Unrealized Profit and Loss (NUPL) - Investors are in a Fear phase where they are currently with unrealized profits that are slightly more than losses.
+ Transfer Volume - The total number of coins transferred has increased by 315.00% compared to yesterday.
+ Active Addresses - The total number of active wallets used to send and receive coins has increased by 21.00% compared to yesterday.
+ Transactions - The total number of transactions has increased by 72.00% compared to yesterday.
Sentiment
+ Coinbase Premium - US investors' buying pressure is relatively strong in Coinbase.
- Korea Premium - Korean retail investors' buying pressure is relatively strong.
- Fund Premium - Investors in funds and trusts including Grayscale have relatively weak buying sentiment.
Derivatives
+ Funding Rate - Long position traders are dominant and are willing to pay to short traders.
- Taker Buy Sell Ratio - Selling sentiment is dominent in the derivatives market. More sell orders are filled by takers.
/ Open Interest - As OI decreases, it indicates investors are closing futures positions and possibility of trend reversals. In turn, this might trigger the possibility of long/short-squeeze caused by sudden price movement or vice versa.
+ Liquidation - 15624591.41 of short positions were liquidated in the last 24 hours.
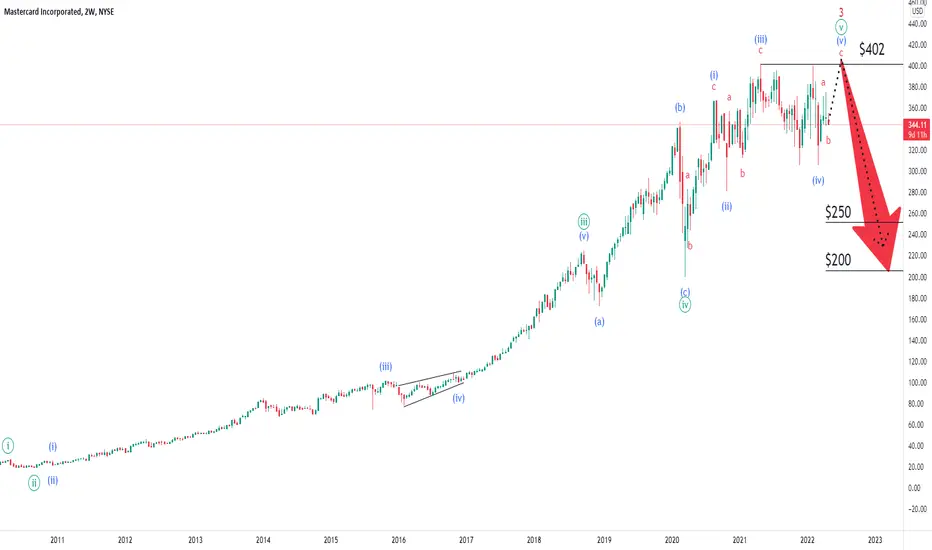
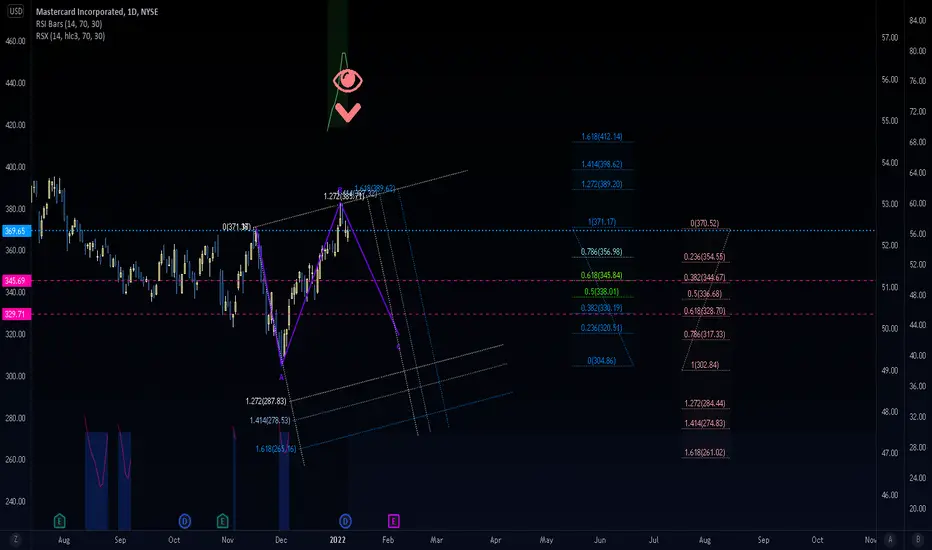
Mastercard - Time to Prepare for Deep Correction up to 50%?Is there much left to squeeze out of the never ending bull run on Mastercard ?
Fundamental indicators: for the long time Visa and Mastercard were undefeated corporate giants with unbelievable circa 40% profit margins and growing exponentially since 2008 crisis. Let's look at some factors, if any, that may break this trend
Recession - warning macro signals suggest that world economies are slowing down and recession is possible within a year, this may be reflected in the forecast of the company
Eastern Europe conflict - ban on use of Visa and Mastercard in Russia will certainly have an impact on earnings
P/E - is quite high at 39x and possible correction may let some steam out of the overpriced stock
Technically:
Following the correction of 2020 which took a form of Running Flat (ABC, 3-3-5) it is very visible that the price is moving very choppy which usually suggests that there is not much energy left in the bull run and Ending Diagonal is developing
The Ending Diagonal takes structure of 3-3-3-3-3 and the current proposed idea indicates that waves 1-4 have completed and wave C of 5 is about to begin to update the high of $402
What's next - given that the last correction was nearly 540 days, the next one will be even longer once the Diagonal is completed. The shape and depth will be clear during the development but it's likely for the price to test levels of 250 (0.382x Fibonacci retracement) or even $200 which is 0.5x.
It will be clear what scenario is developing following the upcoming earnings report.
Please share your thoughts in the comments and like this idea if you would like to see more stocks analysed using Elliott Waves.
Thanks

Mastercard Long term nice investmentHow to make a good investment?
1) Invest in something solid (Mastercad is an example with the market cap 317B)
2) the trend that always grows
3) find a minimum point (in this case on the average 200 at 1w)
4) pattern: ascending triangle
5) Buy and let it go (HOLD)
Russia has imposed sanctions against Visa and Mastercard !Russia has imposed sanctions against Visa and Mastercard . Starting from March 10, Visa and Mastercard payment systems stop servicing cards issued by Russian banks. In Russia, the cards will continue to work without restrictions, including business cards. Russia is switching to its own payment system Mir.
Cards issued by foreign banks will no longer work in Russia: they will not be allowed to pay for purchases in stores and make transfers to cards of Russian banks.

Stock Market EffectWeekly Time-frame
Still bearish in weekly Time-frame, we are bouncing in 0.618 and 0.786 fib lines support and resistance. We need to hold the area of support at $37,285 or lest we can expect more to the downside.
Awesome Oscillator (AO) is still Bearish Saucer. If we break the support we can see a drop to $28,667. once the stock market start dropping the Bitcoin can have crash up to 80% which it can reach up to $10k.
1D Time-frame
We are still in the bouncing area we had a long wick yesterday i hope all have taken profit. AO is bearish, Greed and Fear is 21. This is bullish for our trade. As long as we are above the support there is still chance to pump to the upside.
4H Time-frame
We are currently in a retracement again preparing for a massive move to the upside with long wicks to the upside during bearish market is normal if we break the resistance then we can make it as the new support. AO is bullish, don't give up yet. our trend opened lower high and lower low though but still we are in a Bullish Awesome Oscillator. A mirror from the previous trade which would most likely to happen ride the uptrend.
We will discuss more on the possibility on our Live. Stay tune and check with us!
Want more insights before US market open? Hit Like, Share, and Subscribe for more daily trading tutorial & cryptocurrency news
Trade Scholar, the best cryptocurrency educational community online!
Find the content above difficult to understand?
Feeling lost about how to trade?
Want to learn how to do your Own Price Prediction?
We endeavour to share you our investment knowledge & experience in order to help you starting your path to financial freedom. Follow, Subscribe & Join our Community to trade together!
Disclaimer: Above Technical Analysis is pure educational information, not Investment Advice. The information provided on this post does not constitute investment advice, financial advice, trading advice, or any other sort of advice and you should not treat any of the website's content as such. Do conduct your own due diligence and consult your financial advisor before making any investment decisions.

MA Mastercard exposure to Russia and UkraineVisa and Mastercard restricted transactions in Russia as aggressive penalties on the country over the invasion of Ukraine.
Mastercard has about 4% of its net revenues from Russia, while Ukraine-related business accounted for about 2% of Mastercard`s 2021 net revenues.
My price target for MA is the $312 support while the buy area for a potential wick down is $292 - $305.
Looking forward to read your opinion about it.

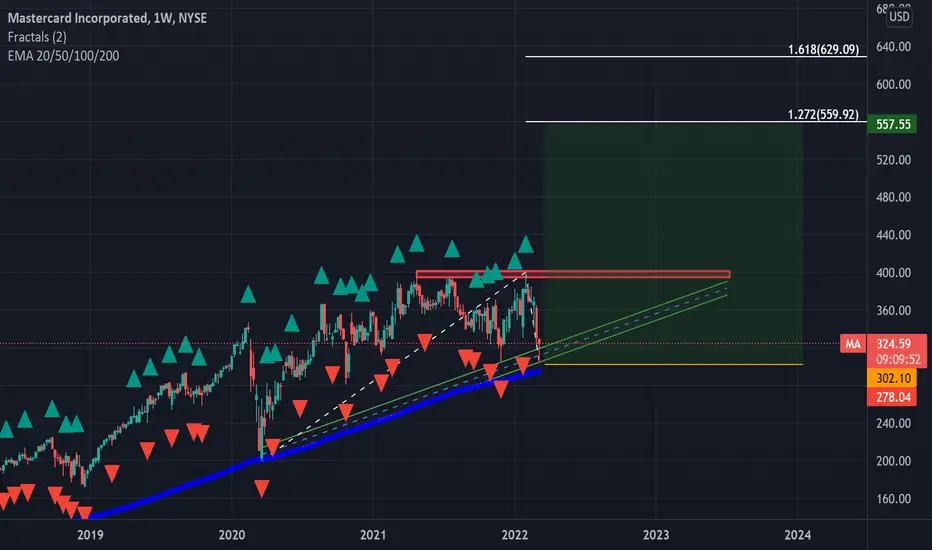
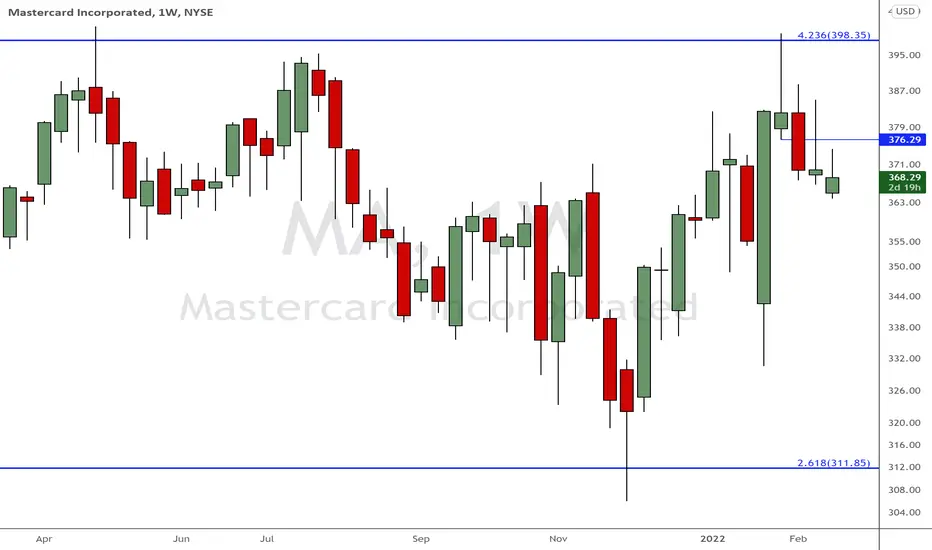
MA weekly... definition of a downtrend ? after a nice weekly shooting star at a Fibonacci extension level, NYSE:MA is marking lower lows and lower highs...
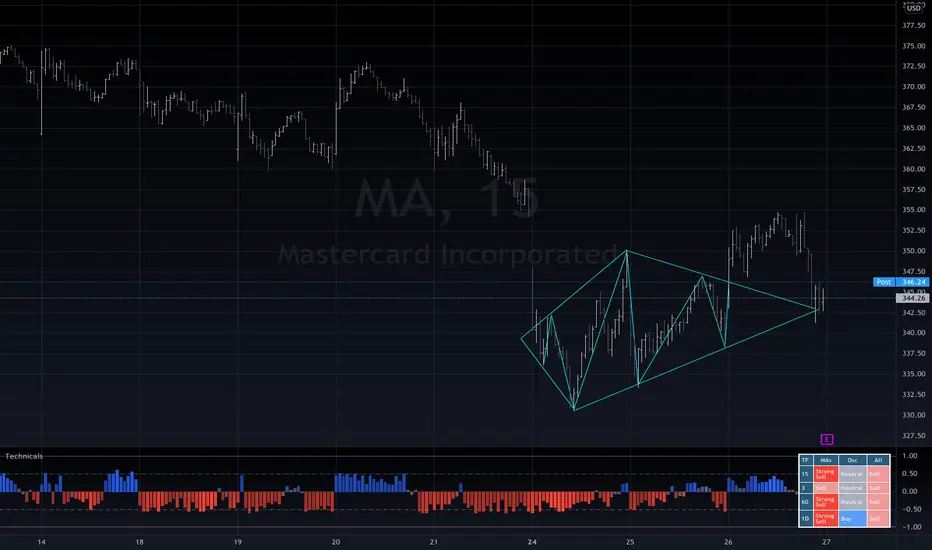
Conclusions on the current context on MAToday, we will look at Master Card, a key name in the information & technology sector, with a market cap of 375B. As a comparative thing, VISA has a market cap of 484B
So, what are the main technical elements we can observe here?
1) The price has been inside a massive daily correction of 275 days, and a few weeks ago, we observed the breakout of it.
2) Now, we can observe a clear "throwback" (name to define the retest movement after a breakout on a bullish trend) that has been developing on the last 15 days
One of the fundamental aspects of the way we trade is understanding the current context and comparing it with historical data (that's why I love using the logarithmic chart)
As you can see, this is not the first time we have observed a correction of this size, and this has been a common behavior since 2007.
What's my conclusion on this?
Take all those corrections I have shown you in the Log chart, and check this concept "Drawing the corrections in the same way I'm doing it on the main chart of this post" after we have the breakout and the throwback, on average, trading on a new high its a great level to get exposure to a possible bullish movement. Of course, this is not working in all of them, but I can see an edge that I need to polish a little more before defining my final setup. (For this basic test I conducted, I placed stop losses below the throwback)
What if this keeps falling? Then you don't trade
What happens if you trade this and it's a stop loss? That's always a chance, to be precise, 50% of the time that happens to me, so make sure you control your risk (The general concept is 1% risk per setup) and only trade if your risk to reward ratio is equal to or higher than 1.8
Thanks for reading; I hope this was useful, and feel free to share your view and chart in the comments! Thanks.

MA - Wants to test ATH
Nice volume last few days.
Staying about VWMA for now.
needs to build above 394 for breakout to new ATH.
Good ER and guidance.
Mastercard might tumble. MAShort term outlook.
Bearish outlook for gains at 345, then 329.
Completing a flat. More to come.
We are not in the business of getting every prediction right, no one ever does and that is not the aim of the game. The Fibonacci targets are highlighted in purple with invalidation in red. Fibonacci goals, it is prudent to suggest, are nothing more than mere fractally evident and therefore statistically likely levels that the market will go to. Having said that, the market will always do what it wants and always has a mind of its own. Therefore, none of this is financial advice, so do your own research and rely only on your own analysis. Trading is a true one man sport. Good luck out there and stay safe!
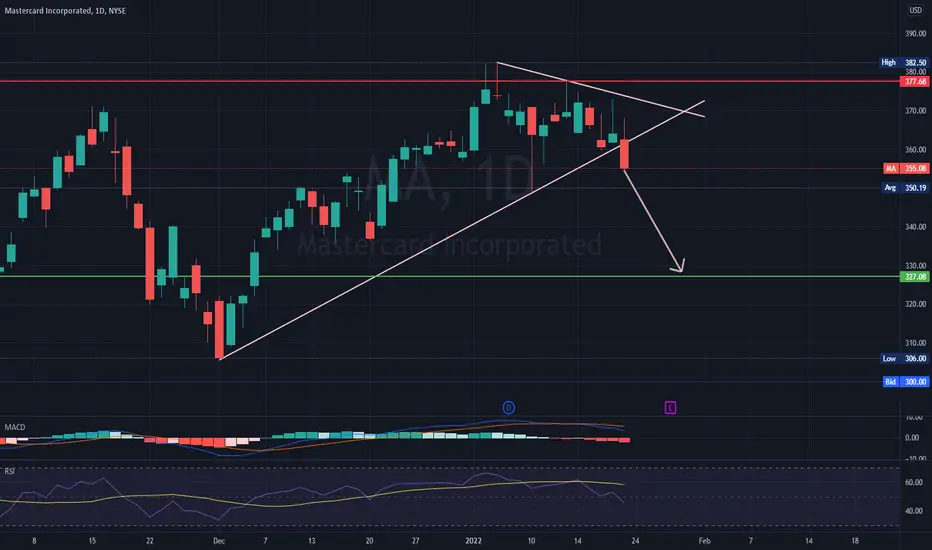
Mastercard Inc. (MA) bearish scenario:The technical figure Triangle can be found in the US company Mastercard Inc. (MA) at daily chart. Mastercard Inc. is an American multinational financial services corporation. Throughout the world, its principal business is to process payments between the banks of merchants and the card-issuing banks or credit unions of the purchasers who use the "Mastercard" brand debit, credit and prepaid cards to make purchases. The Triangle has broken through the support line on 22/01/2022, if the price holds below this level you can have a possible bearish price movement with a forecast for the next 12 days towards 327.08 USD. Your stop loss order according to experts should be placed at 377.68 USD if you decide to enter this position.
Britain's payments regulator on Tuesday last week fined five payments companies including Mastercard a total of 33 million pounds ($45.01 million) for cartel behavior involving prepaid cards issued to vulnerable people on welfare benefits. Mastercard received the largest fine of 31.56 million pounds ($43.04 million). The other companies fined were allpay, Advanced Payment Solution, Prepaid Financial Services, and Solution.
Risk Disclosure: Trading Foreign Exchange (Forex) and Contracts of Difference (CFD's) carries a high level of risk. By registering and signing up, any client affirms their understanding of their own personal accountability for all transactions performed within their account and recognizes the risks associated with trading on such markets and on such sites. Furthermore, one understands that the company carries zero influence over transactions, markets, and trading signals, therefore, cannot be held liable nor guarantee any profits or losses.
BKKT Retracement Completed. New Price TargetsAfter a run to 50.80, now BKKT did a complete retracement and gives you the opportunity to ride it once again!
Cryptocurrency exchange Bakkt has a partnership with Mastercard to offer crypto debit and credit cards.
Thanks to Mastercard and Bakkt, businesses and banks will be able to issue their own branded crypto debit and credit cards to consumers who want them.
Bakkt also announced a separate deal with Fiserv .
Gavin Michael: “We want to provide consumer choice. We want to be able to provide the availability to use crypto currency in an everyday transaction,”
Bakkt also partnered with Google to allow its users to purchase goods and services using cryptocurrencies through the Google Pay wallet.
My short term price targets are: 11.60, 16.80 and even 27.60usd.
Looking forward to read your opinion about it.

BKKT 15K calls expiring today + Dark Pool Prints More than 15K calls on BKKT are expiring today. and those are the calls from the last month only.
The strike price varies from 14 to 75usd.
The price of the stock is now 9.08usd.
Yesterday we saw a volume of 32mil.
Besides the 32mil, Dark Pool Prints were 33Mil.
Dark pools are private exchanges not accessible by the investing public. Dark pools facilitate block trading by institutional investors who did not wish to impact the markets with their large orders and obtain adverse prices for their trades.
I expect strong intraday volatility.
i know it seems a little bit exaggerated, but i wouldn`t be surprised the see BKKT trading at 14-15usd.
don`t forget that on Nov 21 BKKT was trading at $50.80.
Looking forward to see how this trading day will end!
What is your opinion about this trade?

BKKT vision is to connect the digital economyBakkt taps into the $1.6+ trillion of digital assets across cryptocurrencies, rewards and loyalty points, gaming assets, gift cards and beyond.
BKKT allows consumers to aggregate digital assets, access liquidity and trade, transfer and pay however they want.
Cryptocurrency exchange Bakkt announced a partnership with Mastercard to offer crypto debit and credit cards.
Thanks to Mastercard and Bakkt, businesses and banks will be able to issue their own branded crypto debit and credit cards to consumers who want them.
How big do you think this can be?
Bakkt's also announced a separate deal with Fiserv .
Gavin Michael: “We want to provide consumer choice. We want to be able to provide the availability to use crypto currency in an everyday transaction,”
Is this the start of crypto adoption or what?
Bakkt also partnered with Google to allow its users to purchase goods and services using cryptocurrencies through the Google Pay wallet.
Buying BAKKT in this area looks like a great opportunity in my opinion!
My price targets are: 17usd short term, 26usd mid term, an 35usd by the end of 2022.
BKKT depends much on the adoption. in the most favorable scenario, we can see a spike to $60 anytime now.

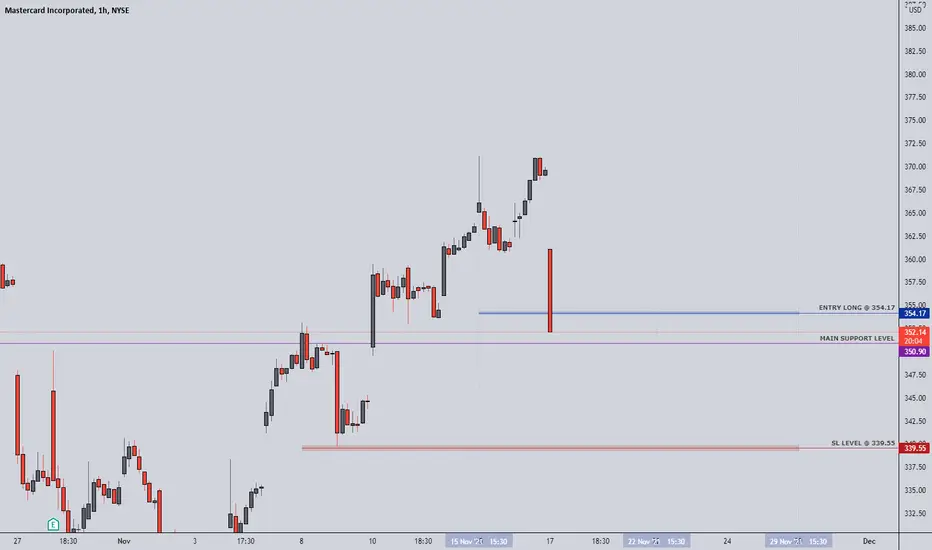
MA - STOCKS - 17. NOV. 2021Welcome to our Weekly V2-Trade Setup ( MA ) !
-
4 HOUR
Strong selloff.
DAILY
Buying into the pullback..
WEEKLY
Expecting new highs after this small consolidation.
-
STOCK SETUP
BUY MA
ENTRY LEVEL @ 354.17
SL @ 339.55
TP @ Open
Max Risk: 0.5% - 1%!
(Remember to add a few pips to all levels - different Brokers!)
Leave us a comment or like to keep our content for free and alive.
Have a great week everyone!
ALAN
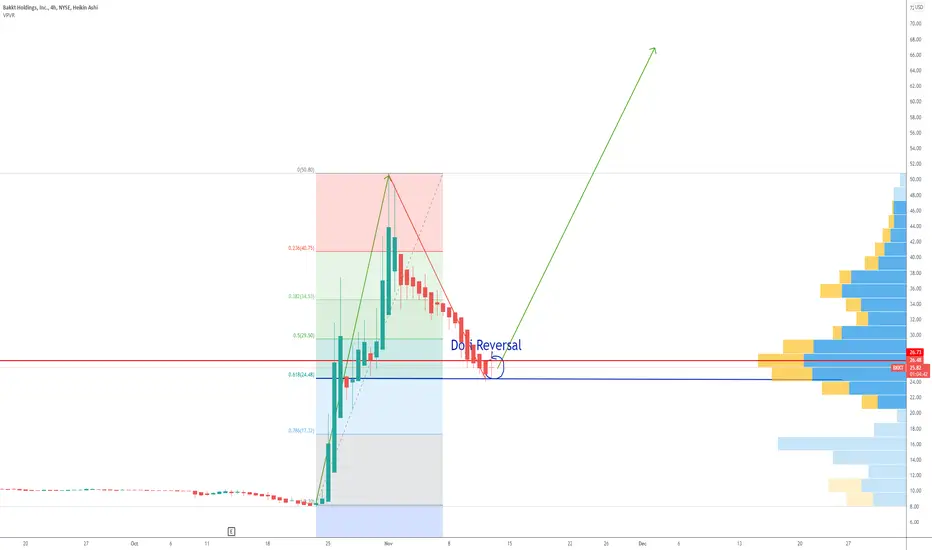
BKKT Short Float 84.72% ! Ready for an Epik Gamma Squeeze ???BKKT perfectly touched the institutional support level of the Fibonnaci 0.618 retracement and now we see a doji trend reversal candle!
According to Finviz, the Short Float is 84.72%! I haven`t seen such a level since the GME gammasqueeze play!
About BKKT:
Cryptocurrency exchange Bakkt announced a partnership with Mastercard to offer crypto debit and credit cards.
Thanks to Mastercard and Bakkt, businesses and banks will be able to issue their own branded crypto debit and credit cards to consumers who want them.
How big do you think this can be?
Bakkt's also announced a separate deal with Fiserv .
Gavin Michael: “We want to provide consumer choice. We want to be able to provide the availability to use crypto currency in an everyday transaction,”
Is this the start of crypto adoption or what?
Bakkt also partnered with Google to allow its users to purchase goods and services using cryptocurrencies through the Google Pay wallet.
My price target is 66usd!
What is yours?