Polygon (MATIC) - November 26Hello?
Traders, welcome.
If you "Follow", you can always get new information quickly.
Please also click "Boost".
Have a good day.
-------------------------------------
(MATICBTC 1W chart)
It is showing a tendency to decline from the high point range of 0.0000 5049 to 0.0000 5393.
If there is a sharp downtrend when it drops below 0.0000 5049, there is a possibility that it will touch the next support range, 0.0000 2954 ~ 0.0000 3337.
However, we must not forget that it has an upward force until it falls below 0.0000 2954.
--------------------------------------
(MATICUSDT 1W chart)
The 0.6164-0.8191 interval is the one that determines the trend.
Therefore, it is important to be able to climb with support in this section.
If it fails to get support, if it falls below 0.5590, it is likely to take a plunge, so be careful.
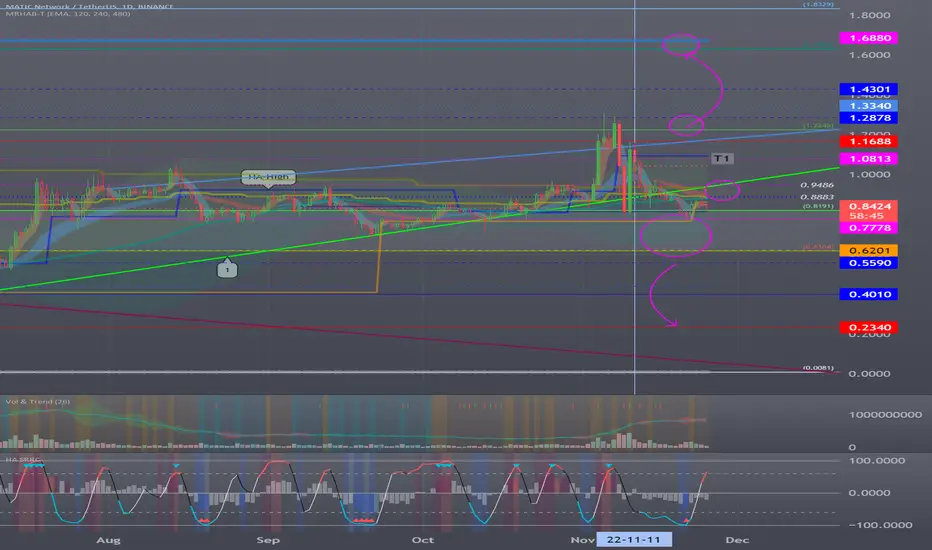
(1D chart)
The question is whether the price can sustain itself by moving up to or above the 0.8883-0.9486 range.
If not, you should check for support in the 0.6164-0.8191 interval.
A rise to the 0.8883-0.9486 zone is expected to lead to a move towards the 1.0813 area.
-------------------------------------------------- -------------------------------------------
** All descriptions are for reference only and do not guarantee profit or loss in investment.
** If you share this chart, you can use the indicators normally.
** The MRHAB-T indicator includes indicators that indicate points of support and resistance.
** SR_R_C indicators are displayed as StochRSI (line), RSI (columns), and CCI (bgcolor).
** The CCI indicator is displayed in the overbought section (CCI > +100) and oversold section (CCI < -100).
(Short-term Stop Loss can be said to be a point where profit or loss can be preserved or additional entry can be made by split trading. This is a short-term investment perspective.)
---------------------------------
Maticusd
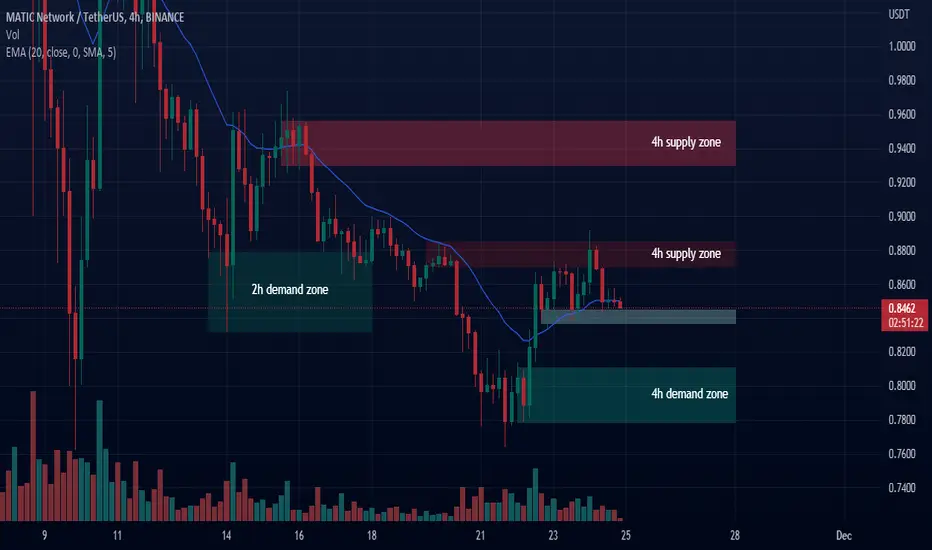
MATIC technical analysisPrice is ranging between the support around $0.84 and the 4h supply around $0.88. We shall wait for the breakout for confirmation but overall price will either break below the support and reach the 4h demand around $0.81, or it will break above the supply and reach the next supply at $0.83.
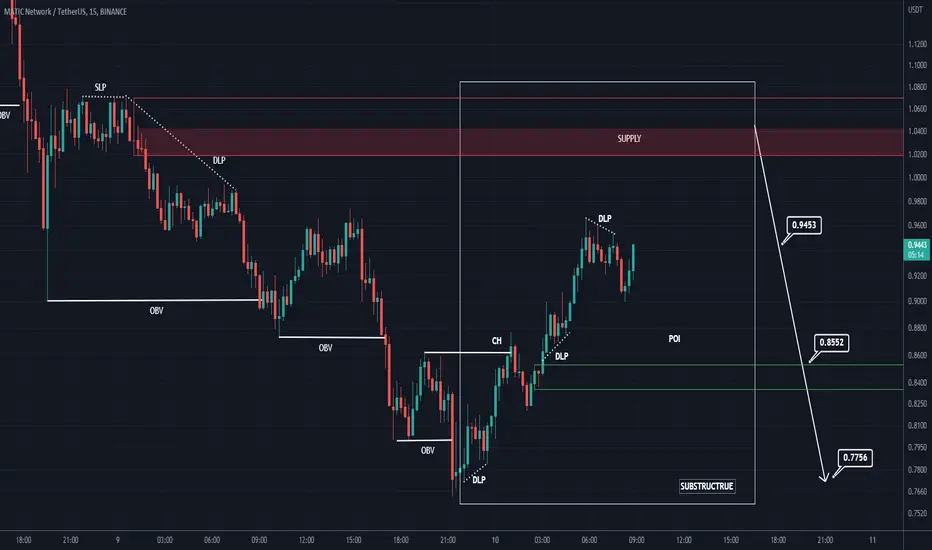
#MATIC/USDT Trade Setup 54% Potential Pump. RR 1:9Welcome to this quick trade setup, everyone!
Recent trades posted:-
1. BTC /USDT (Running in Profit)
2. ETH/USDT (Running in Profit)
3. CHZ/USDT (In Accumulation)
4. CHR/USDT (Running in Profit)
5. MATIC/USDT (In Accumulation)
Entry:- $0.8075 TO $0.8611
(6.22% is the accumulation range from CMP so plan your entry accordingly)
Stop Loss:- $0.7576
Recommended Leverage:- 3x- 5x
Target:- Open (Possibly 35% to 54%)
RR 1:9 (Highly Lucrative)
This is not financial advice. Always DYOR.
These are my trades.
Do not cry in the comments if you can't afford the Stop Loss or go for 125x gambling.
I am ready to take the SL if it gets hit.
Trade only if you can afford the SL.
Do the maths before you enter the trades and manage your risks properly.
Fund preservation is our foremost priority.
If you like me to post more please share this idea with your friends and communities and hit the like button.
I have been with you in the bullish days and the bearish days.
We are going to have an amazing bull run for sure.
Cheers!
Thank you
#PEACE

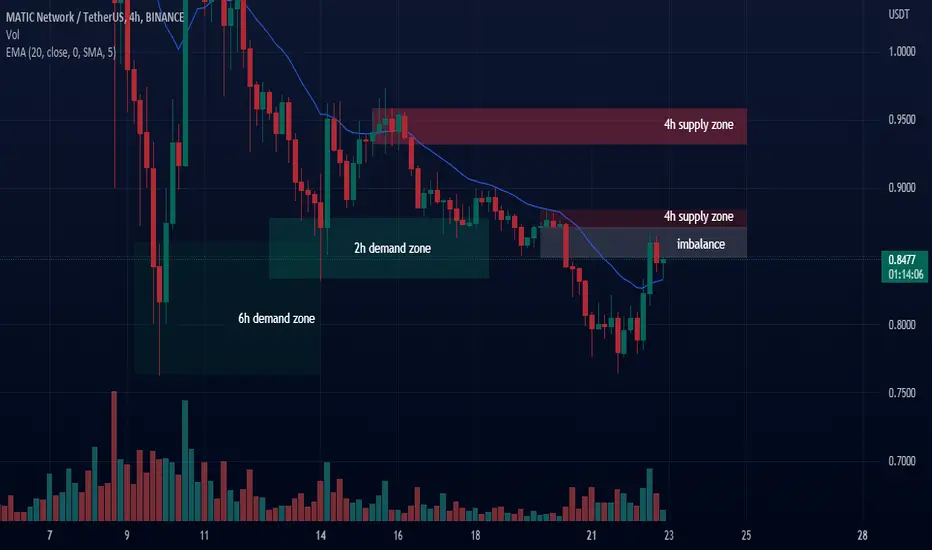
MATIC technical analysisPrice filled the imbalance around $0.86 and it is currently moving down from there. I still expect price to tap into the 4h supply around $0.87 before potentially moving down again.
MATIC ready to break down due to unforeseen technicalsThis is a very tough analysis to do as there was an anomaly of an event which shifted the technical analysis dynamics.
I guess right now the price is sideways with bearish signals for further downside.
Once we have price below the 200MA and below the support around $0.7600 it's likely for the price to continue down to $0.2550.
With the crypto-winter, lack of confidence with exchanges, regulations and finances - I wouldn't be surprised to see further downside for Altcoins like MATIC.
Bearish bias.

MATICUSD ❕ fall in a liquidity zoneThe chart of trading volumes points to buying after the fall of the price in the liquidity zone.
TD Sequential has formed a reversal signal upwards (1H TF)
I believe that MATIC will try to fix itself above the liquidity zone, and after that it will start bouncing.

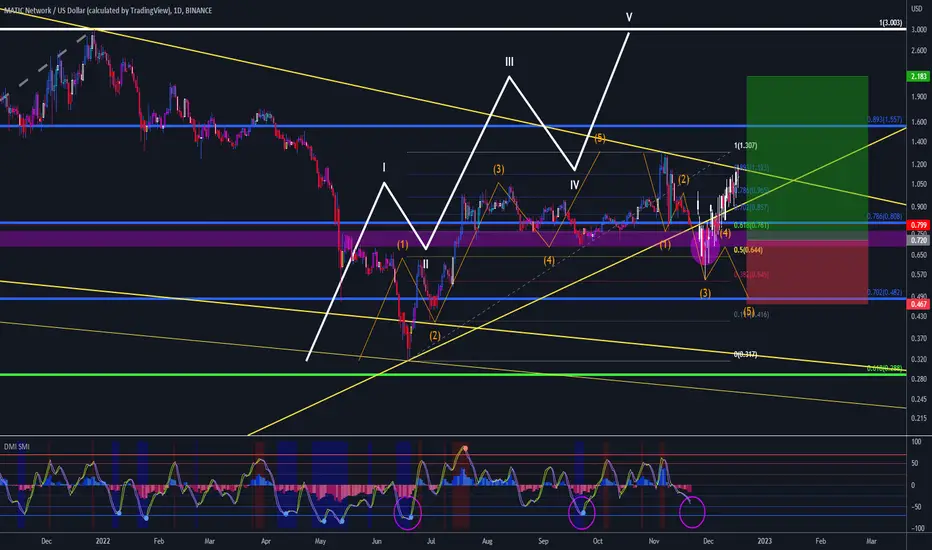
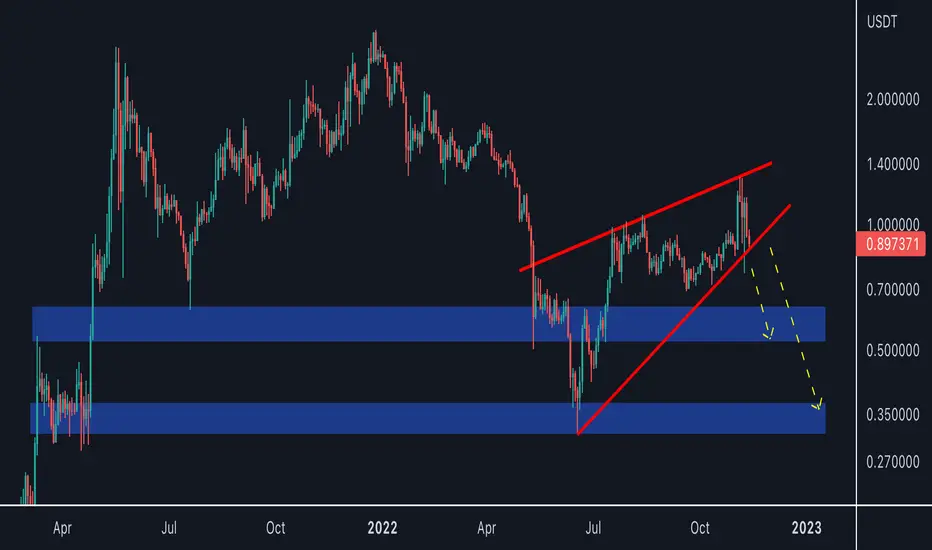
Next entry for Polygon (MATIC)I believe that price could temporarily break out of the triangle and make a bear trap at the 0.5 ~ 0.382 Fibonacci retracement.
The MATIC token is one of those that appreciated above average considering this bear market.
The DMI SMI indicator also signals this possible opportune moment to buy
MATIC maintained its bearish momentum last week!MATIC maintained its bearish momentum last week and has returned to the $0.85 support zone after reacting to the $0.90 resistance. Support has been associated with a positive reaction several times and has prevented the price from falling further. But note that selling pressure is high in the market, and the possibility of breaking this support level is very high. Therefore, if the support area of $0.80 is broken, the price drop can continue at least to $0.66-0.70.
This range is the floor of the last upward wave and also the ceiling of the last downward wave in the past of the price and is related to the daily time frame. Therefore, it is considered an important supply and demand area. For this reason, it can have a positive reaction. But note that if selling pressure increases and this support is broken, with a pullback to this area, we can expect a heavier fall for MATIC to the $0.53 range. If you look at the weekly MATIC chart, you can see that if the daily supply and demand range is broken, the potential for forming a double ceiling pattern and confirming this pattern is very likely. In this case, the price reduction can even continue until close to the $0.50 range. Therefore, maintaining the $0.70 support area is very important for MATIC investors.
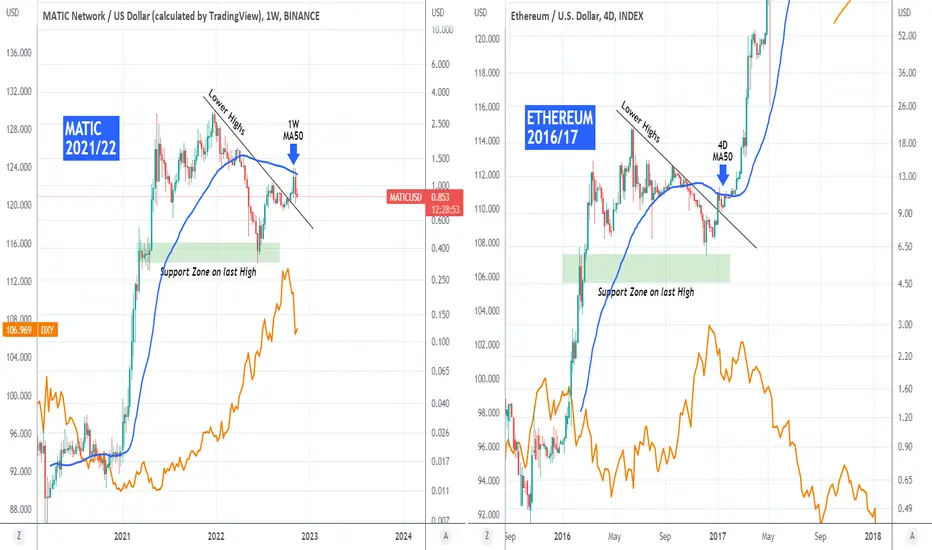
MATICUSD going Ethereum 2016/17 styleThe MATIC Network (MATICUSD) has been rejected last week on the 1W MA50 (blue trend-line). In an interesting turn of events, its price action since the COVID March 2020 crash, is similar to Ethereum's (ETHUSD) price action from October 2015 to January 2017, which also got rejected on its MA50 (for better illustration we used the 4D time-frame, even though 1W fares well too). Both made the MA50 rejection after the broke above their correction Lower Highs trend-line.
What made a big difference for ETH in its January 2017 break-out and rally was the bearish reversal on the U.S. Dollar (DXY). MATIC made its October 2022 bullish break-out as the DXY has pulled-back significantly. If the fractal continues to be repeated, expect a strong rally on MATIC in 2023.
-------------------------------------------------------------------------------
** Please LIKE 👍, SUBSCRIBE ✅, SHARE 🙌 and COMMENT ✍ if you enjoy this idea! Also share your ideas and charts in the comments section below! This is best way to keep it relevant, support me, keep the content here free and allow the idea to reach as many people as possible. **
-------------------------------------------------------------------------------
You may also TELL ME 🙋♀️🙋♂️ in the comments section which symbol you want me to analyze next and on which time-frame. The one with the most posts will be published tomorrow! 👏🎁
-------------------------------------------------------------------------------
👇 👇 👇 👇 👇 👇
💸💸💸💸💸💸
👇 👇 👇 👇 👇 👇
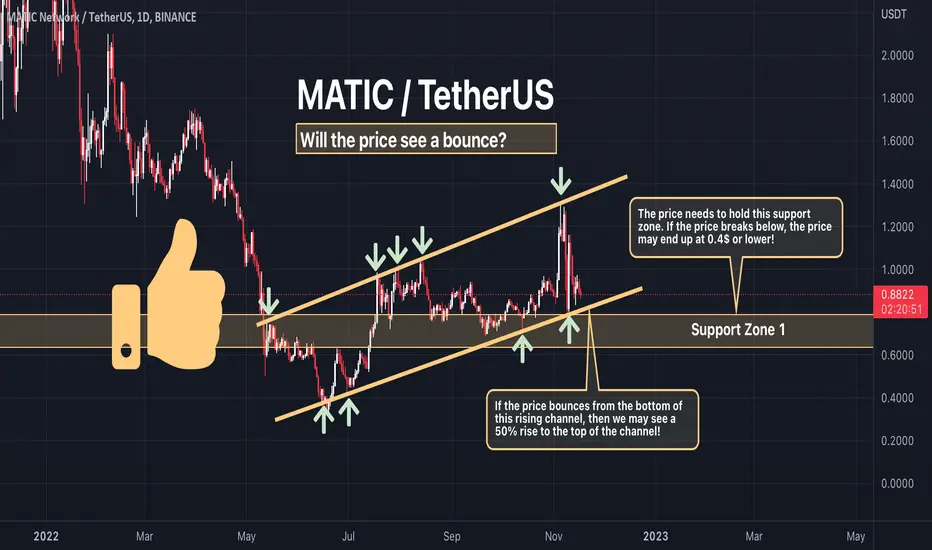
MATIC - Will the price see a bounce?Here's a quick look at the Matic daily chart . As we can see, the price is currently oscillating within the bigger rising channel and is approaching the bottom. If the price bounces from the bottom of the rising channel , we may see a 50% rise to the top of the channel! But if the price breaks below the channel and doesn't manage to hold the support zone , then we may get down to 0.4$ or even lower! It all depends on the movement of BTC - If BTC goes south then MATIC is very likely to follow.
-------------------------------------------
What are triangles when it comes to trading?
Key points:
"1. In technical analysis , a triangle is a continuation pattern on a chart that forms a triangle-like shape.
2. Triangles are similar to wedges and pennants and can be either a continuation pattern if validated or a powerful reversal pattern, in the event of failure.
3. three potential triangle variations can develop as price action carves out a holding pattern, namely ascending, descending, and symmetrical triangles."
-------------------------------------------
If you like the content, then make sure to comment and like the post :D
Follow me for daily profitable trading setups
BTC dictates the market. If BTC falls, then Alts will fall as well. Trade safe!
MATIC/USDT LONG IDEA 🚀🚀 Hi guys , BINANCE:MATICUSDT has been rejected from this support zone ( 0.87-0.89) many times as you see in the chart
* It's a spot swing trade
Entry 1 : 0.888
Entry 2: 0.78
SL : 0.71
Tp1: 0.98
Tp2: 1.1
Tp3: 1.25
Please like my idea and follow me for more strong signals, thank you

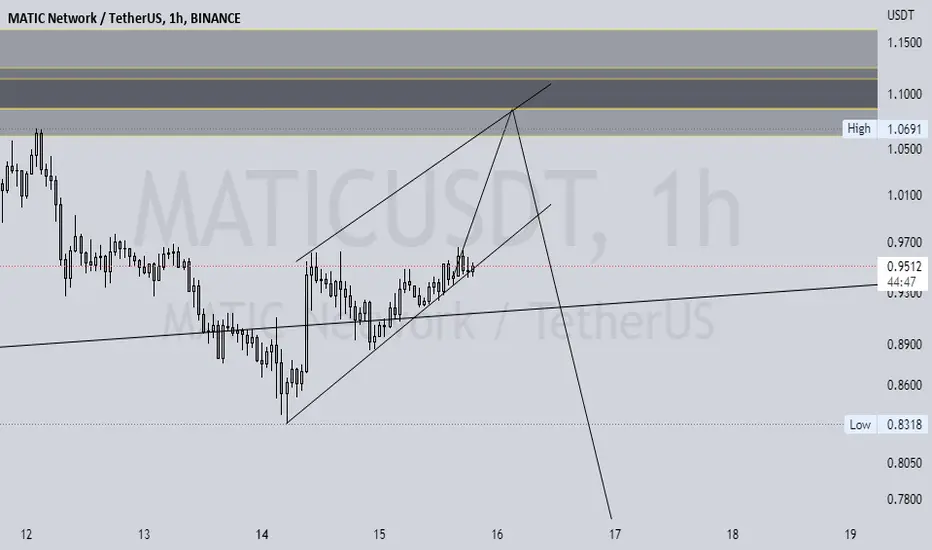
MATICUSDT: Correction Wave 1HrHello friend. I see MATICUSDT move uptrend to determined zone and so continued to downtrend again.
Matic can test previous supportsMATIC / USDT
Price is setting on weak trendline of rising wedge which is a bearish pattern
Incase of breakdown price will target the previous support
Keep an eye

MATIC WAVESI checked the Mitec currency and I think it is going down instead of up.
We have a large contractionary inverse triangle that will soon cause the price to decline
MATICUSD Four Hour ChartA megaphone like structure on the four hour chart
This is a bullish pattern and could lead price towards continuation upwards and of this megaphone
Hopefully a big breakout up comes
Polygon (MATIC) - November 13Hello?
Welcome, traders.
By "following", you can always get new information quickly.
Please also click "Boost".
Have a good day.
-------------------------------------
(MATICBTC 1W chart)
Maintaining the price in the range of 0.0000 5049 to 0.0000 5393 or higher is expected to lead to a move to renew ATH.
When it falls below 0.0000 5049,
1st support: 0.0000 3910 ~ 0.0000 4415
2nd support: 0.0000 2954 ~ 0.0000 3337
You need to make sure it is supported by
As long as it does not fall below the range of 0.0000 2954 ~ 0.0000 3337, I think that a fall below 0.0000 5049 as a mid- to long-term investment would be a good buy range.
-------------------------------------
(MATICUSDT 1W Chart)
The key is whether the price can be sustained above 1.2246.
To do that, you need to make sure you can move up along the uptrend line.
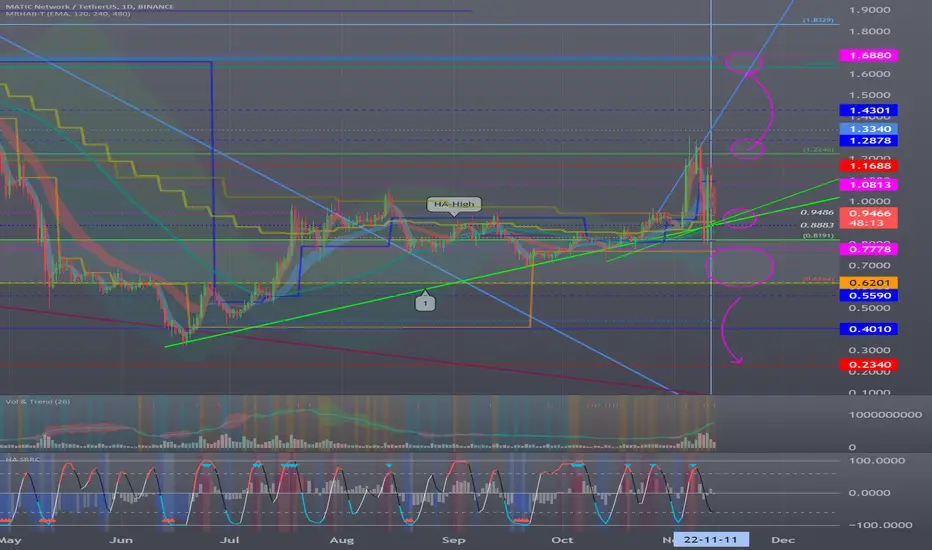
(1D chart)
Since the M-Signal line of the 1W chart and the M-Signal line of the 1M chart pass in the 0.8883-0.9486 section, it is important to be supported and rise in this section.
If not, you should check to see if the HA-Low indicator is supported in the 0.6201-0.7778 zone.
As seen in the MATICBTC chart, MATIC is a strong uptrend coin.
Therefore, if it falls to the 0.6164-0.8191 range, those who want to invest in the mid- to long-term will have a good buying opportunity.
This opportunity can cause great losses for some people, so a strategy is needed to reduce the loss and increase the number of coins corresponding to the profit with an appropriate response.
A drop below 0.5590 is likely to result in a sharp move, i.e. large volatility.
Therefore, it is possible to temporarily touch around 0.2340 and move up, so be careful.
------------------------------------------------------------ -------------------------------------------
** All descriptions are for reference only and do not guarantee a profit or loss in investment.
** If you share this chart, you can use the indicators normally.
** The MRHAB-T indicator contains indicators that indicate support and resistance points.
** HA SRRC indicators are expressed as StochRSI(line), RSI(columns), CCI(bgcolor).
** CCI indicator is expressed as overbought range (CCI > +100) and oversold range (CCI < -100).
(Short-term Stop Loss can be said to be a point where profit and loss can be preserved or additional entry can be made through split trading. It is a short-term investment perspective.)
---------------------------------
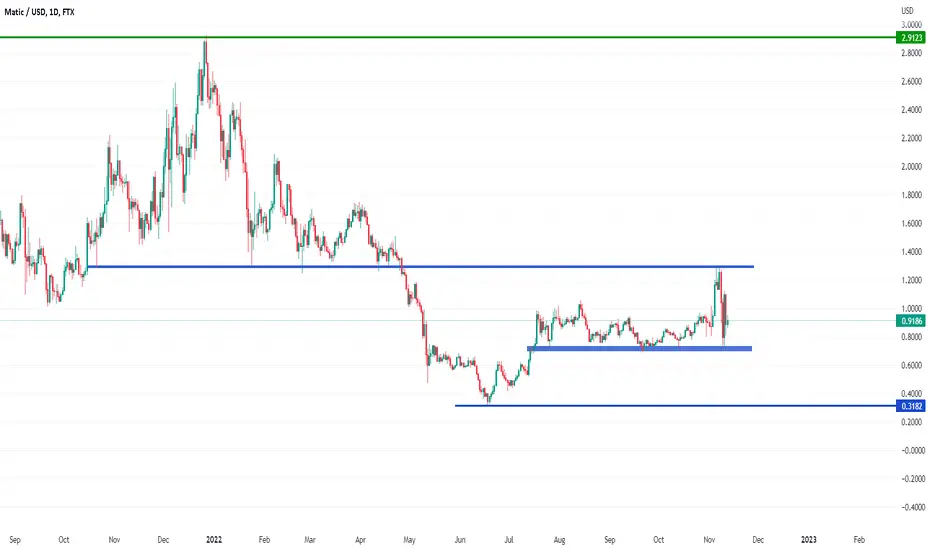
Matic (polygon) Again so much hype even in bear market .
I cant believe it will go up more from the previous top 1.1 ish
Further my target 0.5 ish then again lower low .
GOOD LUCK

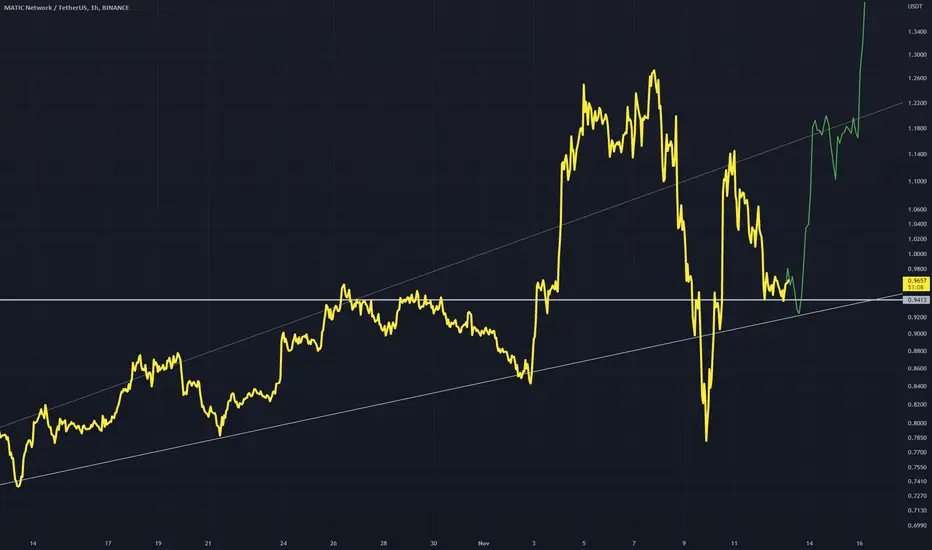
MATICUSD Profit to be made in range as well as break-outs.Polygon (MATICUSD) has been trading within a Channel Up since the June 18 bottom and on November 05 formed its latest Higher High. Since then, it has been highly volatile following the explosive mix of the FTX (bearish) and CPI (bullish) news. This should keep the price volatile and sideways mostly within the bottom (Higher Lows trend-line) of the Channel and the (dashed) Lower Highs trend-line, a sequence that took place from the previous August 14 High until October 17.
A break above the dashed Lower Highs would be bullish towards the 0.382 Fibonacci retracement level while further break, bullish towards the top (Higher Highs) of the Channel Up. Similarly, a break below the Channel Down would be bearish, targeting the previous dashed line.
-------------------------------------------------------------------------------
** Please LIKE 👍, SUBSCRIBE ✅, SHARE 🙌 and COMMENT ✍ if you enjoy this idea! Also share your ideas and charts in the comments section below! This is best way to keep it relevant, support me, keep the content here free and allow the idea to reach as many people as possible. **
-------------------------------------------------------------------------------
You may also TELL ME 🙋♀️🙋♂️ in the comments section which symbol you want me to analyze next and on which time-frame. The one with the most posts will be published tomorrow! 👏🎁
-------------------------------------------------------------------------------
👇 👇 👇 👇 👇 👇
💸💸💸💸💸💸
👇 👇 👇 👇 👇 👇

MATICUSD ❕ strong assetThe MATIC shows itself confidently in the current market.
The asset continues to trade above the liquidity zone.
Price is testing 50EMA as support (4H TF)
I expect growth when the price fixes above the support level.

MATIC SHORT SETUPHello, dear traders. how are you ? Today we have a setup to SELL/SHORT the MATIC symbol.
For risk management, please don't forget stop loss and capital management
When we reach the first target, save some profit and then change the stop to entry
Comment if you have any questions
Thank You
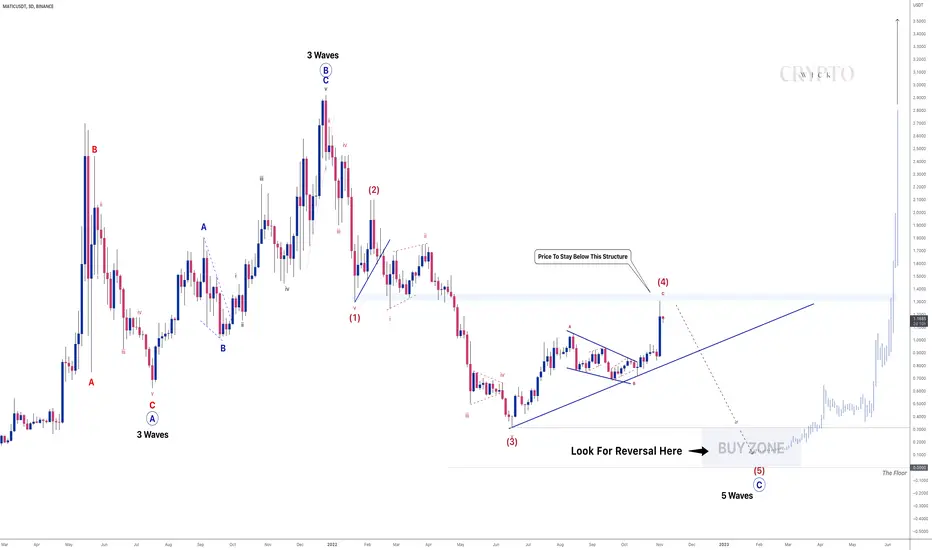
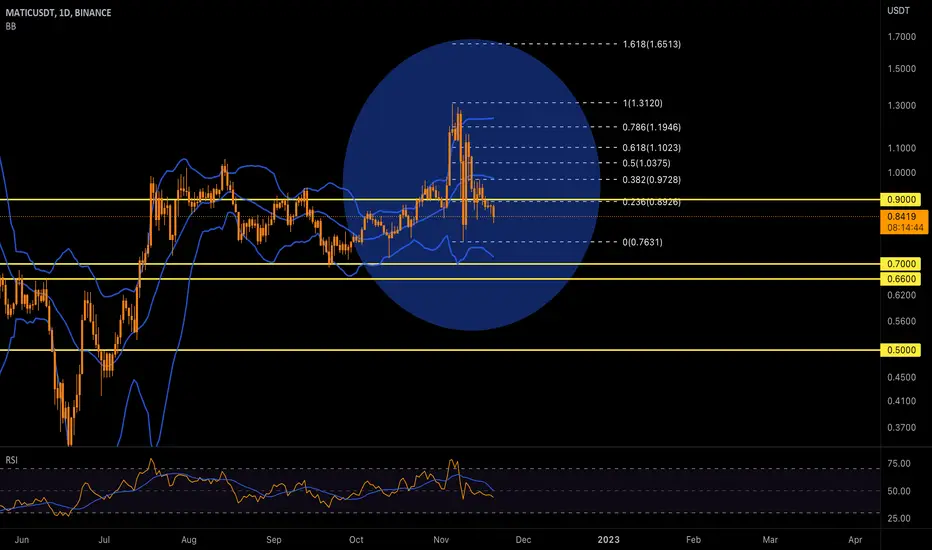
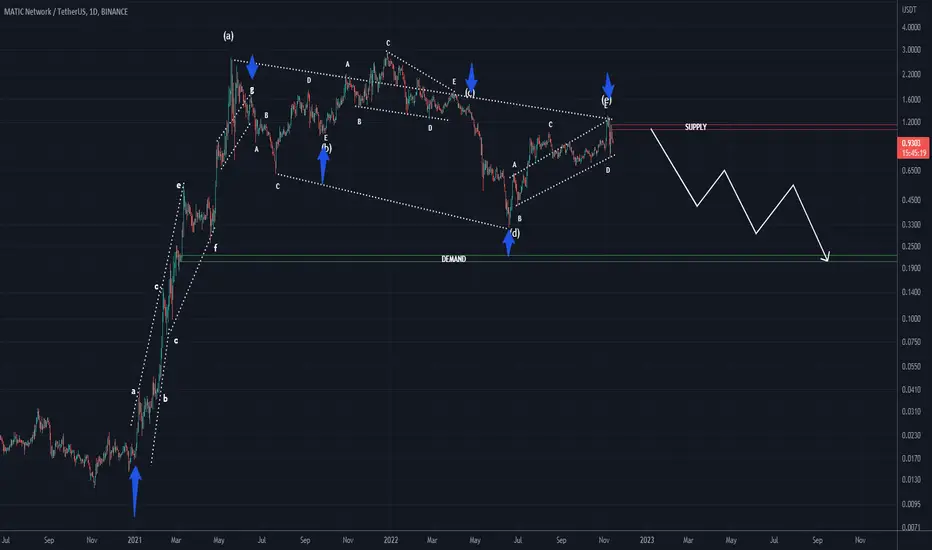
MATIC - Great R:R Trade! 🔥MATIC gave us a complex wave 4 and now we're at the extremes of wave 4. We have an invalidation level in place and we're almost at that level.
Taking a short entry anywhere near the blue structure will give us a great risk to reward. There's only limited space for it to move up but there's 75% raw gain to be made on the short. We're expecting wave 5 to go below wave 3 so once we pass that, we'll be looking for reversal patterns to get in on the longs.
Trade Idea:
- On lower timeframe, watch for rejection of the blue structure. This can be done via trendline breaks or BOS etc.
- Enter with stops above the blue structure
- Target the recent lows as first targets. Taper off position as we move lower
Check out @TradingElements_ idea for the weekly timeframe
Goodluck and as always, trade safe!