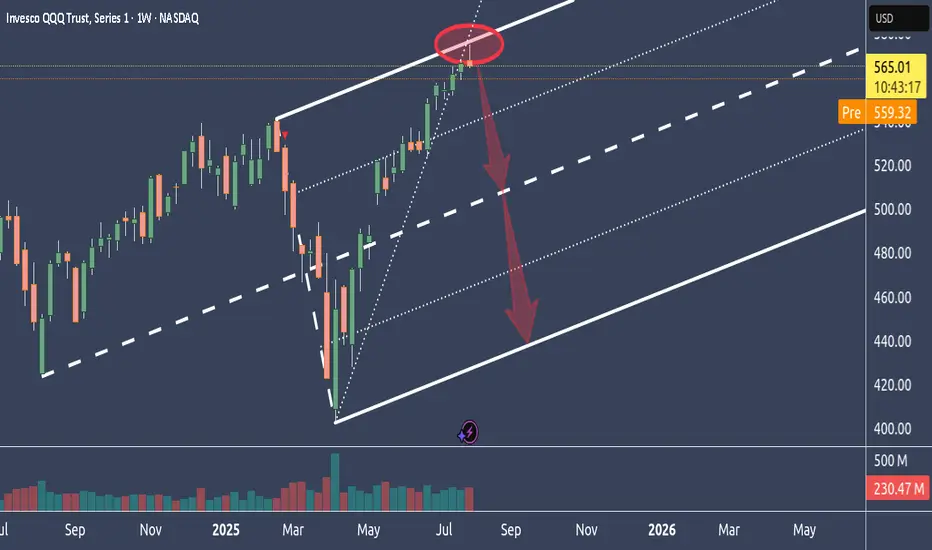
Why NQ is probably tanking big timeIn this weekly chart, we see QQQ, which represents the Nasdaq.
As we can see, it had a hell of a run up.
Too far too fast IMO, and it reached the stretch level at the Upper Medianline Parallel.
The natural move is now to let go, take a breath and trade down to center again, which is the Centerline.
After all the most major and most important earnings results are over, and Funds have pumped up their gains through manipulative Options plays, it's time to reap what they have planted and book the gains.
It's all in line with, all moves are at the point, and everything is showing in a simple chart.
Unless price is opening and closing outside of the U-MLH, it's time to load the Boat and sail to the South.
Medianline
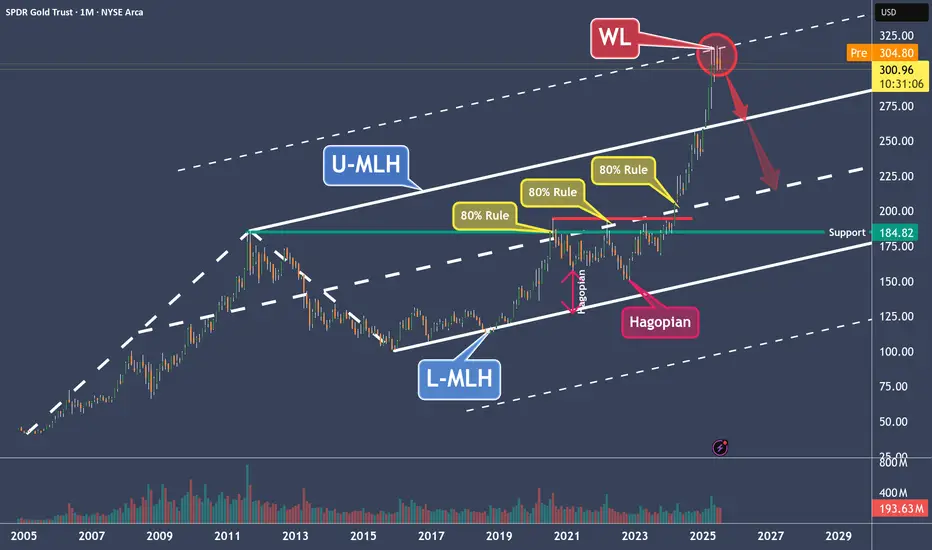
GLD – Why Gold Is a Clear Short to MePrice moved from the Lower Median Line (L-MLH) up to the Centerline, fulfilling the 80% rule.
Then we had two Hagopians, which sent price right back to the Centerline.
After the breakout above the Centerline, the next target was the Upper Median Line Parallel (U-MLH), which was reached rather quickly.
Finally, price broke above the U-MLH and was pulled up toward the Warning Line (WL).
Is this the end of the happy story?
I think so—because Gold has now reached its 2nd standard deviation, and there’s probably no more gas left in the tank.
The Trade:
- A logical target is the U-MLH.
- A secondary target is the Centerline.
At the very least, if you're long, this might be a good time to take some profits—because no tree grows to the moon.
For further details, I will follow-up with a Video explanation - See my Signature.
XMRUSD - Monero And It's Warning-LinesToday we’re analyzing Monero, with a focus on a new aspect of Median Lines — the Warning Lines, or WL for short.
Warning Lines are simply extensions of the distance between the Center Line (CL) and one of the Median Line’s outer boundaries, either the Upper Median Line Parallel (U-MLH) or the Lower Median Line Parallel (L-MLH).
So why are they important for us in our trading?
As you can see, WL1 and WL2 mark important price levels. WL2 is where price reversed, while WL1 acts as resistance.
Just like with the standard lines, our full trading rule set applies to Warning Lines too. This includes scenarios like a Hagopian, a breakout or "Zoom Through," and the Test and Re-Test.
Now, looking at the current analysis:
The price was rejected at WL1 after falling from WL2. This shows strong resistance at WL1, and now the price is heading toward the U-MLH.
If the price breaks below the U-MLH and starts opening and closing within the Fork again, there’s a strong chance it will move back toward the Center Line in the near future.
That could be your signal to take more profits, close the position, or possibly even short Monero.
Personally, I find it difficult to short crypto due to the high risk of manipulation by whales in the market. I prefer not to get caught in a short position if the price suddenly gaps to the upside. So I probably look to take a new position or add to an existing one, since it is a fair level where price found it's center.
That’s it for today.
Did you learn something new?
Great. See you next time, and trade safe.

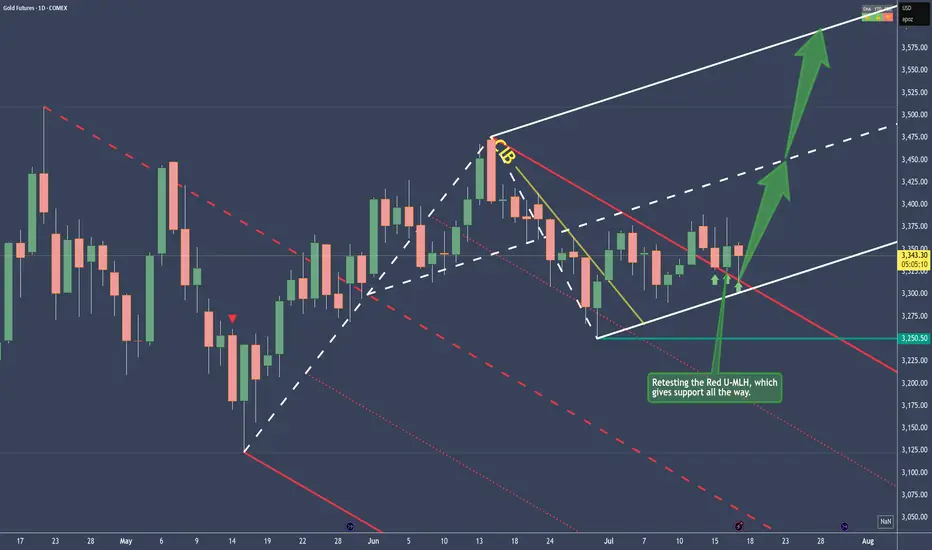
Gold - Bullish and here's whyPrice traveled within the Red Fork, until it broke the CIB Line, which is indicating a Change In Behavior.
From there on, sideways action, until the break of the Red U-MLH happened.
After the close above the Red U-MLH, price has tested it the 3rd time now. At the time of writing, the Bar looks like a PinBar. So it has good sepparation from the bottom, or a long Down-Wick. That's indicates good strenght.
To me this looks like a good long trade, but as everytime, play it save and don't let greed eat your brain ;-)
XRPUSD - Target reached. Reversal on the plateSo, that was a nice long trade.
Now price is stretched at the Upper Medianline Parallel (U-MLH).
As of the time of writing, I already see price pulling back into the Fork. A open and close within the Fork would indicate a potential push to the south.
Target would be the Centerline, as it is the level where natural Meanreversion is.
Observation Hat ON! §8-)

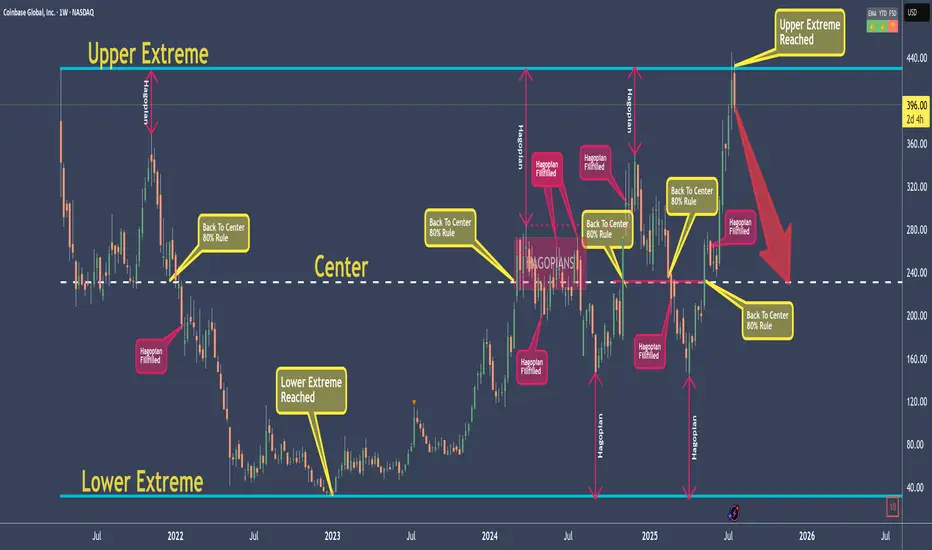
COINBASE - My rules say: Down with high probabilityI don't elaborate too much here, because I want to give you a chance to learn something!
As for the Trade, my rules say that it is a good Short.
The Short is not valid anymore, if price open and close above the Upper Extreme!
So, what are the rules?
Well, that's exactly what you will learn today ;-)
Go to my previous post which I will link, and you find everything you need to jump on the Steam-Train if you like.
As my old Mentors always said: "Larn To Earn"
Happy Profits Guys & Gals §8-)
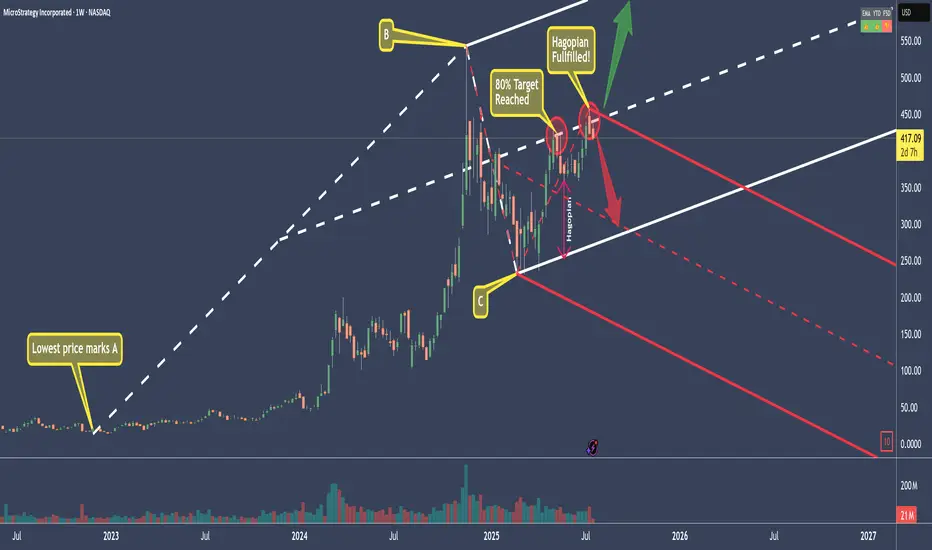
MSTR - Microstrategy Short...for now.The White Fork is created by choosing point A, which must be the lowest price before the swing.
B and C are the natural high and low of the swing we want to measure.
What this gives us is a Pitchfork that projects the most probable path of price.
Additionally, with the three lines that make the Fork, we have the natural extremes above, below, and the center—the mean.
We can see that price started to rise in March 2025.
The 80% rule states that price will reach the Centerline around 80% of the time.
And as we see, it did this time as well. Price reached the CL (Center Line), and immediately the big whales dumped positions.
Then price fell—only to be picked up before reaching the Lower Line, also called the L-MLH or Lower Median Line Parallel.
When price can't make it to this (or any of these) lines, we call this a 'Hagopian,' because it follows 'Hagopian's Rule.' This rule says that if price can't reach 'the line' (the L-MLH in this case), there is a high chance that price will reverse in the previous direction (up in this case), and even go further than where it came from (the Centerline).
And as we see, price indeed traded upwards—beyond where it came from—and overshot the Centerline (CL).
Unfortunately for long-positioned traders, the gas in the goose was empty, and price now starts to head south again, missing the target, which would have been the U-MLH (Upper Median Line Parallel).
So, the open happened below the CL!
If we also see a close this week, I'm ready to initiate a short trade.
Why?
Well, as before, Hagopian’s Rule applies—an indication that price will trade further down than where it came from, which is below $361.
And since we know that the natural target is the Centerline about 80% of the time, we have a heck of a good chance that we’ll be happy campers in a couple of weeks. :-)
With a risk/reward of about 2 to 3, and such a high chance of a profitable trade, I’ll sleep like a baby in the coming weeks.
The trade idea would be cancelled if price closes above the CL this Friday.
Let’s stalk it closely...
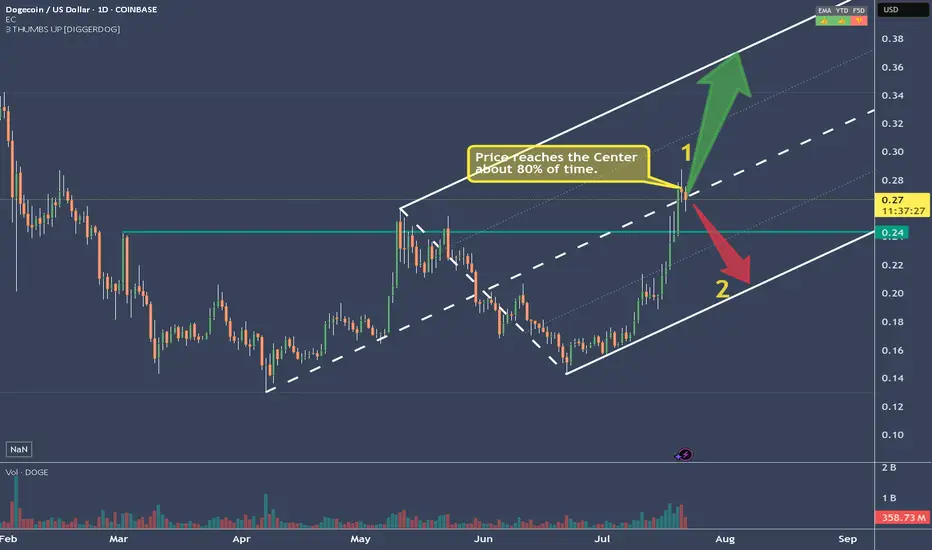
DOGEUSD Has reached it's (first?) targetAfter reaching the Centerline, price eitheradvances to the Upper Extreme (U-MLH), or it reverses and it's target is the L-MLH, the lower Extreme of the Fork.
An Open & Close below the Centerline would indicate further progress to the downside.
A stop above the last high with a target around 2 would be the trade I would take.
80% Of Time - A Trading Edge You Don't Want To MissDo you want to know why trading with median lines, also known as pitchforks, can be so successful? It’s simple:
Prices swing from one extreme back to the middle.
From the middle, they often swing to the other extreme.
What do we see on the chart?
- The upper extreme
- The center
- The lower extreme
So far, so good.
Now let’s follow the price and learn a few important rules that belong to the rulebook of median lines/pitchforks, and with which you can make great trades.
Point 1
The price starts and is sold off down to…
Point 2
...and from there starts to rise again, up to…
Point 3
...which is the center. And here we have a rule that is very important and one that you need to be aware of in trading to be successful:
THE PRICE RETURNS TO THE CENTER IN ABOUT 80% OF ALL CASES
If we know this, then we can stay in a trade with confidence.
Point 4
The price climbed even higher but missed the upper extreme.
This is the “Hagopian Rule” (named after the man who discovered it).
And the rule goes: If the price does not reach the next line (upper extreme, lower extreme, or center), then the price will continue moving in the opposite direction from where it originally came.
Phew...that’s a mouthful ;-)
But yes, we actually see that the price does exactly this.
From point 4, where the price missed the upper extreme, the price not only goes back to the center but continues and almost reaches the lower extreme!
Now if that isn’t cool, I don’t know what is!
And what do we have at point 5?
A "HAGOPIAN"!
What did we just learn?
The price should go higher than the center line.
Does it do that?
Oh yes!
But wait!
Not only does the Hagopian Rule apply. Remember?
"The price returns to the center line in about 80% of the cases."
HA!
Interesting or interesting?
So, that’s it.
That’s enough for now.
Now follow the price yourself and always consider which rule applies and whether it’s being followed.
How exactly do you trade all this, and what are the setups?
...one step at a time.
Don’t miss the next lesson and follow me here on TradingView.
Wishing you lots of success and fun!

ETHUSD - Decision TimeWhat do make of the current situation?
What if you are long?
Here's what to expect:
a) support at the U-MLH, further advancing up to the WL
b) open & close within the Fork. If so, there's a 95% Chance of price dumping down to the Centerline.
Taking 50% off the table is never bad.
50% money in the pocket if price falls down to the Centerline.
Or if it advances up to the WL, you still have 50% that generates profits.
Either way, you have a winner on your hands.
Don't let it dig into a Looser!

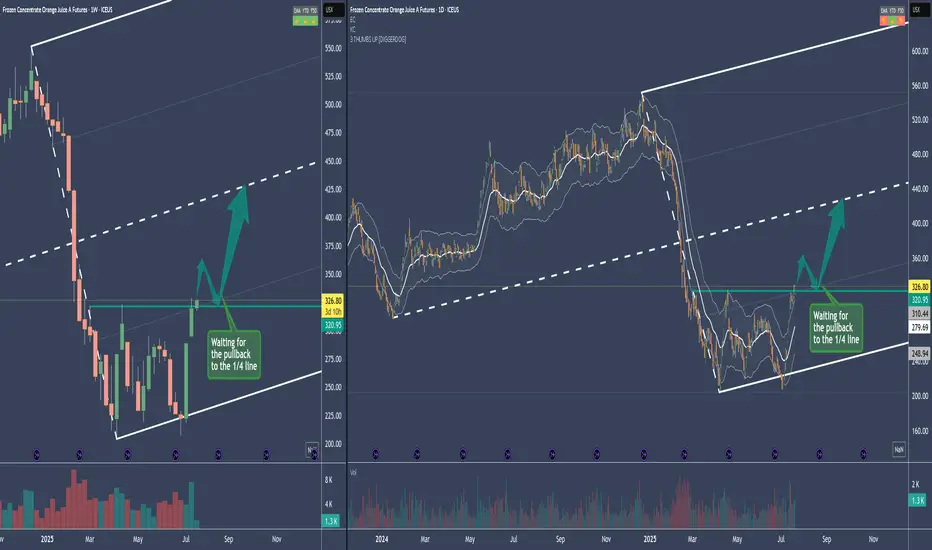
OJ - Frozen Orange Juice Long SetupThe Medianline se aka Fork, is a pullback Fork.
So what we want to see is a reversion to the mean after this drop.
The sideways action from Mar. to Jul. is a "loading" period, where Commercials load their boat.
If we break the resistance, it's usual that there will be a pullback to the prior resistance - now support. Or even into the loading zone.
Entries will be on a intraday basis.
Stalker mode on 88-)
XRPUSD - Why I see that Ripple even higherMedianlines, aka "Forks" have a simple but effective ruleset inherent. These rules describe the movement in certain situations. And of course, the most probable path of wher price is trading to.
Here we a rule in play that projects more movement to the upside, even if BTCUSD has had a strong pullback to the south.
Let's see:
If price is closing above a Centerline, then chances are high that it will retest it. If it holds and starts to continue it's path (to the upside), then the next target is the U-MHL, or the Upper Medianline Parallel, was Dr. Allan Andrews named it back many decades ago.
So, there we have it.
Chances are high that Ripple will reach new highs, with a final target at the U-MLH.

ETHUSD - Stretched price. Pullback to CL likelyPrice tagged the U-MLH, the stretch level.
Think of it like the 2nd STDV.
Now think Mean Reversion.
With such a stretch, price has a high chance to revert to the mean - down to the Centerline (CL).
What is this information good for?
a) take profit (...or 50% partial)
b) short on intrady signs
But if it is open and close above the U-MLH, then there's a good chance that price is advancing to the Warning Line, the extension of the Center to U-MLH.
Let's observe what happens.

BTCUSD - Exhausted? Second time rejected, now down.BTCUSD got rejected at the Centerline the second time. This is super bearish. If it's closing below yesterdays low, that's a clear short signal to me.
Taking 50% gains off the table is never bad. Because then you still have 50% if it's going up further. Otherwise, you got 50% booked.
Don't let gree eat your brain §8-)

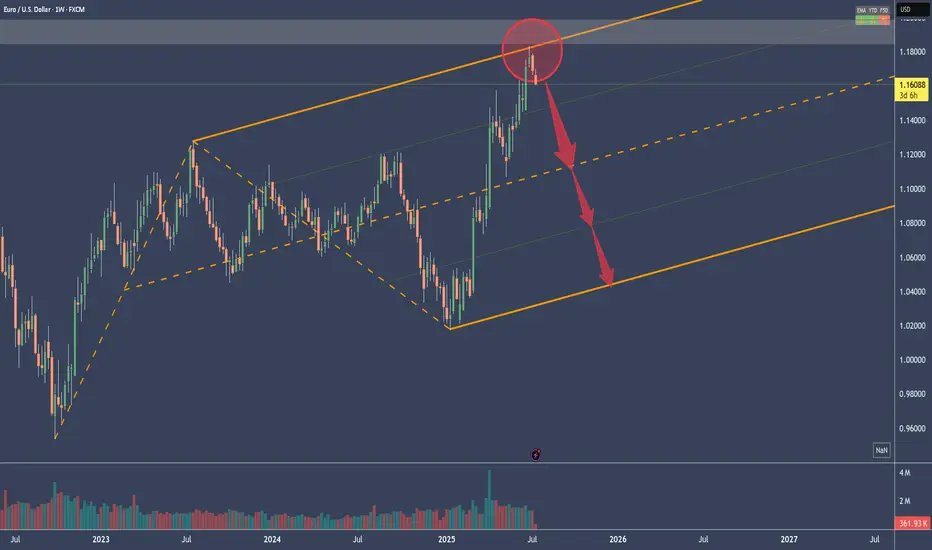
A case for a EURUSD ShortPrice got rejected at the U-MLH.
DXY shows some strenght too:
A close below yesterdays low is a short for me.
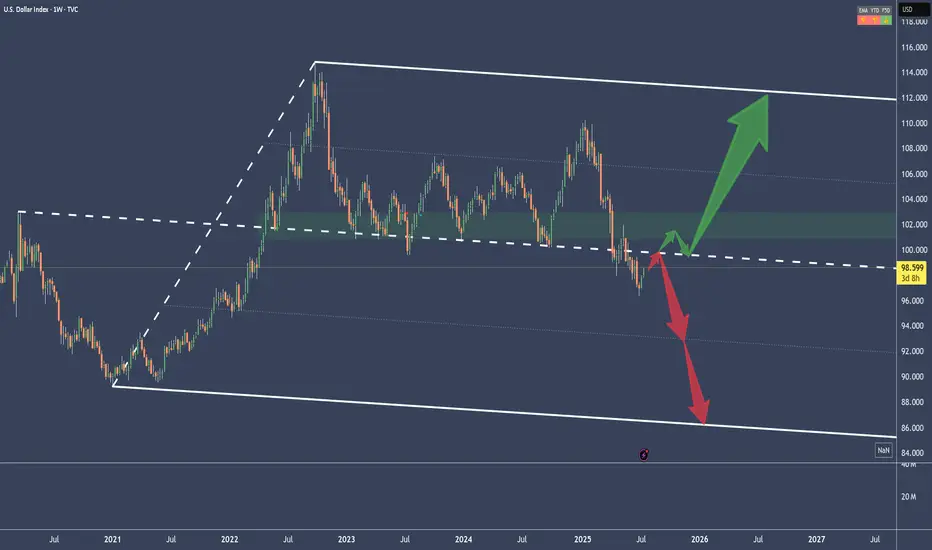
DXY - USD Index: either 86 or 112If the current pullback can break above the Centerline, then massive upside is on the plate.
But if it gets rejected, massiv downside is possible.
We don't know yet.
Just let the market tell you.
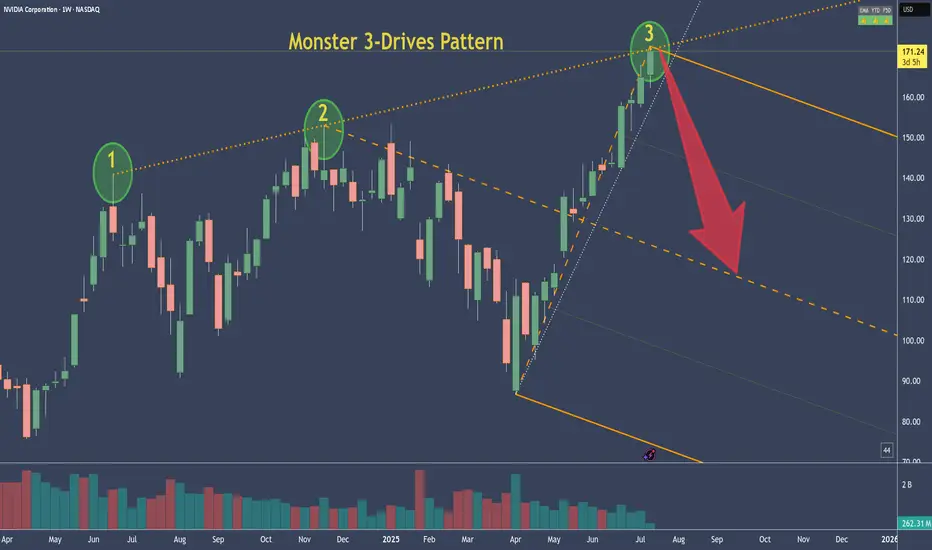
NVDA - NVIDIA's 3-Drive Pattern target if it plays outThis is the weekly chart of NVDA.
We can clearly see a 3-Drives pattern forming.
If this pattern plays out, the centerline would be my target. Of course, it's still too early to short.
But I’ve got my hunting hat on and I'm watching for signals on the daily chart.
One would be a break of the slanted trendline—but there are a couple of other conditions that need to align as well.
Always ask yourself: What if?
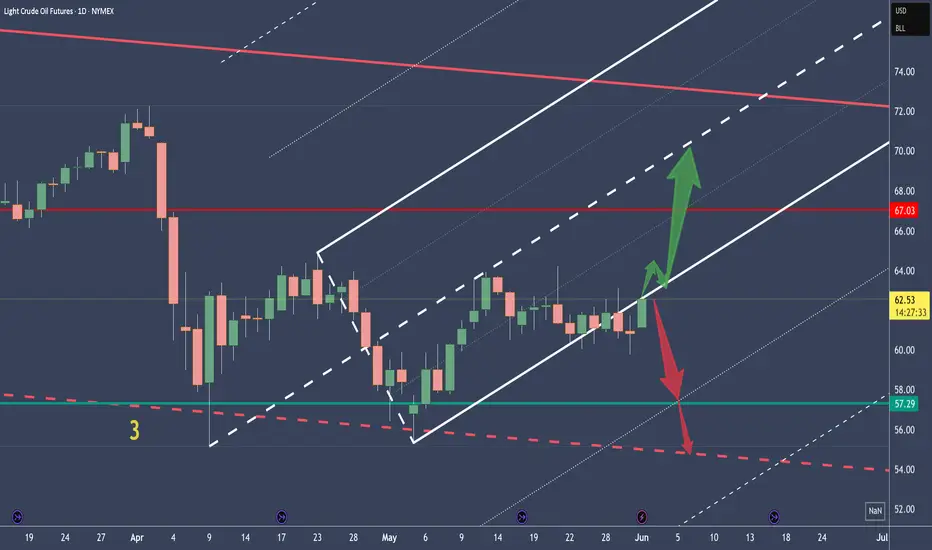
Crude Oil - Two Scenarios and about Brain PowerPrice retests the L-MLH.
VI. - Price breaks upward, target is the centerline
VII. - Price reverses again, then the target is the 1/4 line, with a subsequent extended target at the red centerline, and possibly even lower at the white dashed warning line.
On a personal note:
I was once again told that the price didn’t do what I had projected.
...yeah, really, that’s how it is §8-)
After over 30 years in the markets and hundreds of coaching sessions, I’m still amazed that people think you can predict price movements as if with a magic crystal ball.
The fact that this belief still persists (even though they don’t understand even the absolute basics of trading) deeply concerns me at the core of my trading soul.
Because this growing irrationality clearly indicates that far too little is being done in terms of education – or humanity might simply go extinct in the next 100 years due to rapidly declining intelligence!
...maybe I should just create a chart and apply a few median lines/forks?
Happy trading to all of you and I pray for those with lesser brain power.
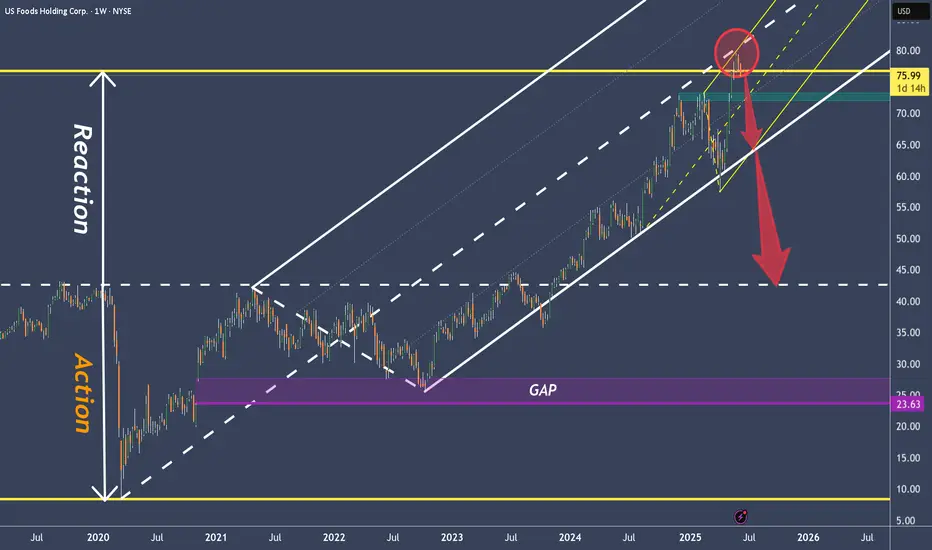
USFD – US Foods has reached its zenithIn 2020, we had the action, and since 2024 the market's reaction. Just as Newton describes the universal law of Action/Reaction.
However, we see that USFD has reached the centerline of the white Fork, which coincides with the reaction high and the upper median line (U-MLH) of the yellow fork!
There is not much more to say about it.
It's a clear Short to me, and the target are always the Forks and the A/R lines. And if you have enough fantasy, GAP's are always get filled....
...they say.
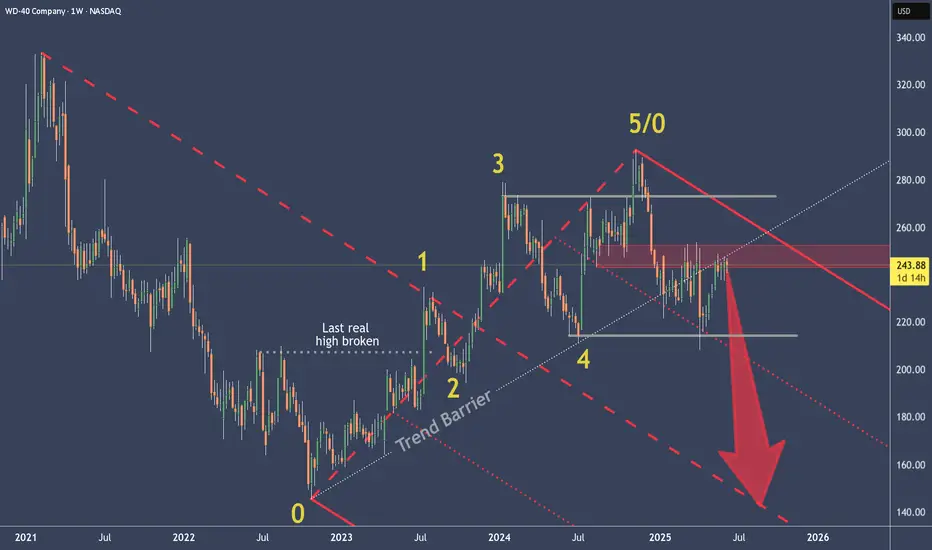
WDFC - WD-40 a good shortWD-40 changed direction to the south after the 5/0 count.
Soon it will become clear whether the support from (4) holds or not.
But what is already apparent is that WDFC is struggling significantly at the trend barrier. No surprise, since this price level coincides with the natural resistance.
To me, this seems like a cheap short, even though a new, true low hasn't been reached yet.
A stop behind the resistance Zone is a fair bet.
VISA - A Pump & Dump? Help me understand please.To places where no stock price has ever gone before..
What makes VISA so special?
The credit industry is currently staring into the abyss due to massively rising payment defaults.
Why is VISA skyrocketing in price, breaking through every barrier as if they were made of butter?
I don't know, and I'm very puzzled.
What will happen if economic conditions become even more difficult and the madness we're currently experiencing fully hits, and hardly anyone can service their consumer debt anymore?
I think at that point, VISA will look like a
Pump & Dump too like many others.
I'd appreciate any info on why VISA is rising so much.

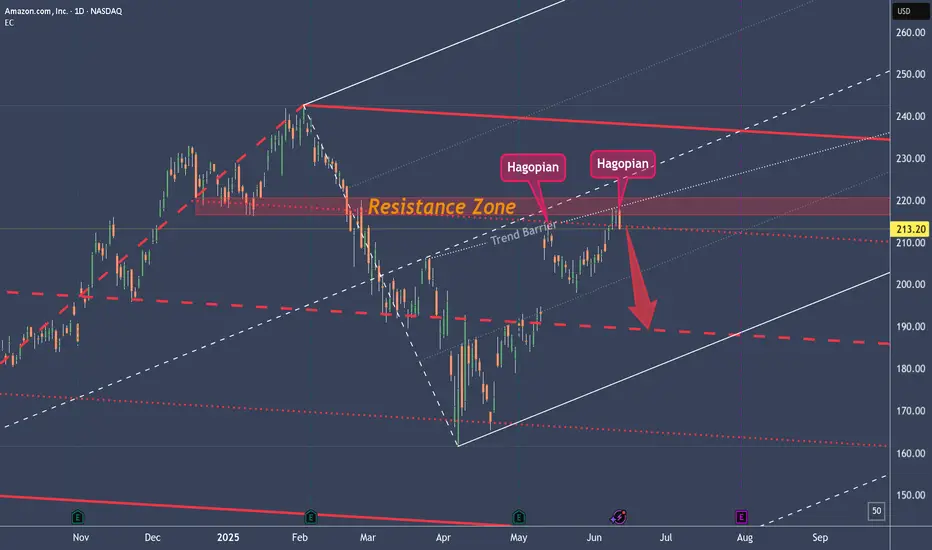
AMZN Struggles at Trend-Barrier and ResistancePrice is still in upward mode.
Why am I bearish?
1. Rejection in the Resistance Zone
2. Second Hagopian
3. Close below the Red Forks 1/4 Line
PTG1 is the Center-Line.
Potential further PTG's below at the 1/4 Line and then of course the L-MLH.
Playing it with Options which give me much more leeway. For a hard Stop I would put it right behind the last high above the TB.
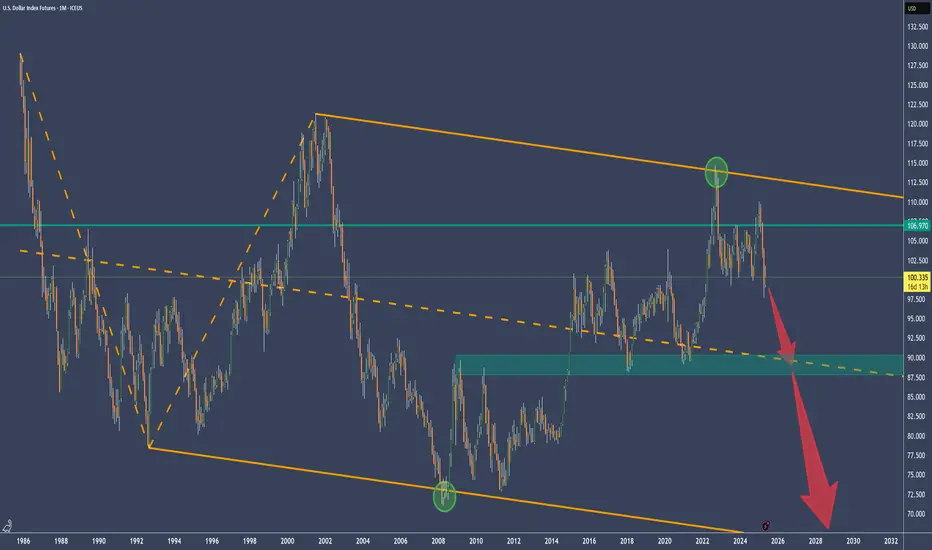
DX - USD Index Longterm Outlook Indicates Further DeclineThis long-term chart shows how the USD Index is trading within the boundaries of the Median Line set.
We see the lower extreme, solid support around the Center Line, and the upper extreme acting as resistance.
What’s next?
Well—if it’s not heading higher, it’s likely heading lower—and the rejection at the Upper Median Line (U-MLH) supports that view.
If we revisit the Center Line, my experience tells me it won’t hold—we’ll break through and head even lower.
Buckle up. It’s going to be a rough ride.