Medianline


The BTC cheat sheet BITFINEX:BTCUSD has a very high probability of hitting this Median Line (ML), the middle blue line, this will be the make or break area. Typically with ML analysis the price will initially fall thru the ML but will almost always return to it to retest, even if it bounces off the ML on the first touch watch for a retest, just look at the chart every time it crossed not only the ML but the other major trend lines in between, test, retest, find direction. if the retest fails and she breaks lower that will be very ugly and a very profitable short. If she can hold the ML, she has a good probability of heading back up to retest the upper parallel. This is the easiest way to follow the price action, just find the major pivots and stick a fork in them, look how well BTC has played off this pitchfork its almost unbelievable.
As you can see looking back, price will always retest a trend line at least once, be patient, no need to rush in the second it pushes through or bounces off a trend line. wait for the retest to jump in. If price fails to reach the ML or an Upper or Lower parallel, and you will know because it will try more than once, its a sign of a reversal.
Every crypto trader should have this on their long term chart to use for support and resistance levels, look at the last bounce and the bounce before that, both came right up to a trend and failed, very easy to follow once you have the pitchfork on the right pivots.
If you found this helpful hit the like button, if you have a comment or question feel free to ask, Happy trading

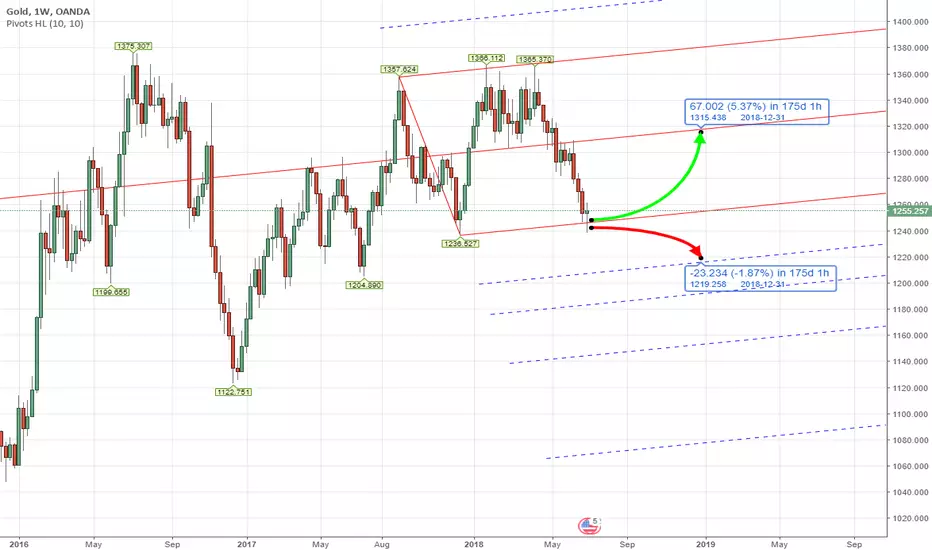
PITCHFORK - CFD XAUUSD Analysis Q3 2018Analysis for XAUUSD Q3 2018
Current price is around the lower line pitchfork
Best opportunity to go long
If the price make a reversal here and keep the momentum upwards
Price expectations are able to reach the median line
However bearish momentum is strong, confirmation price break lower line pitchfork
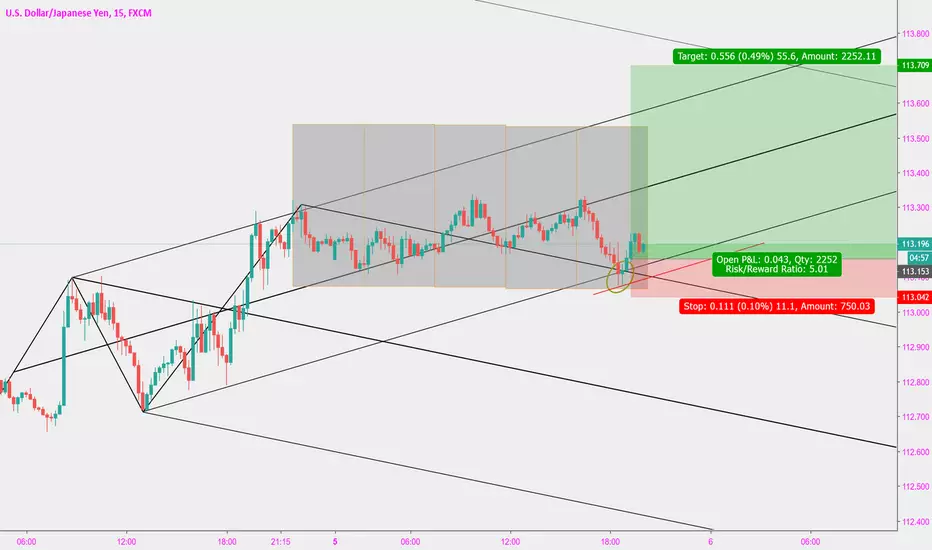
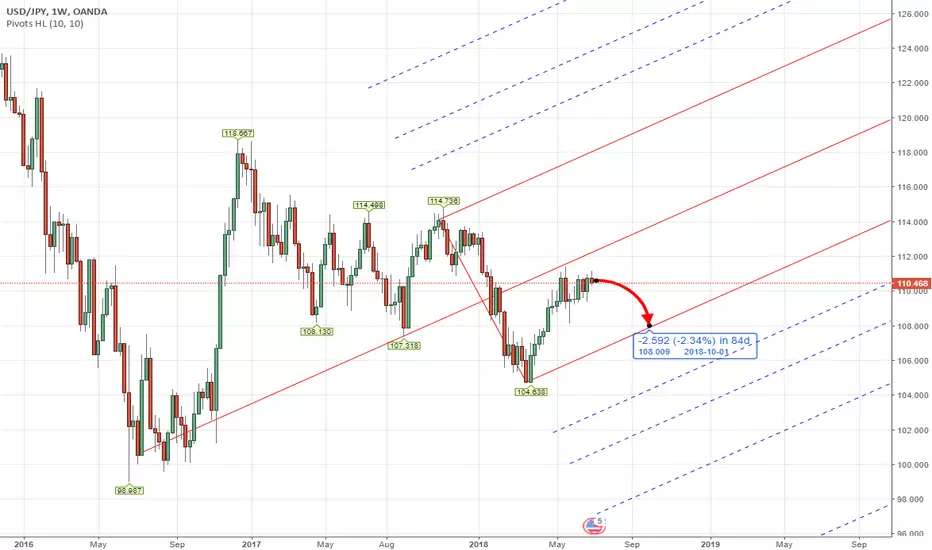
PITCHFORK - Forex USDJPY Analysis Q3 2018Analysis for USDJPY Q3 2018
Expecting price reversal around median line pitchfork
If yes we could see price moving lower towards lower line
However on US Index from our analysis is currently retest on median line
Stronger dollar would push USDJPY towards upper line pitchfork
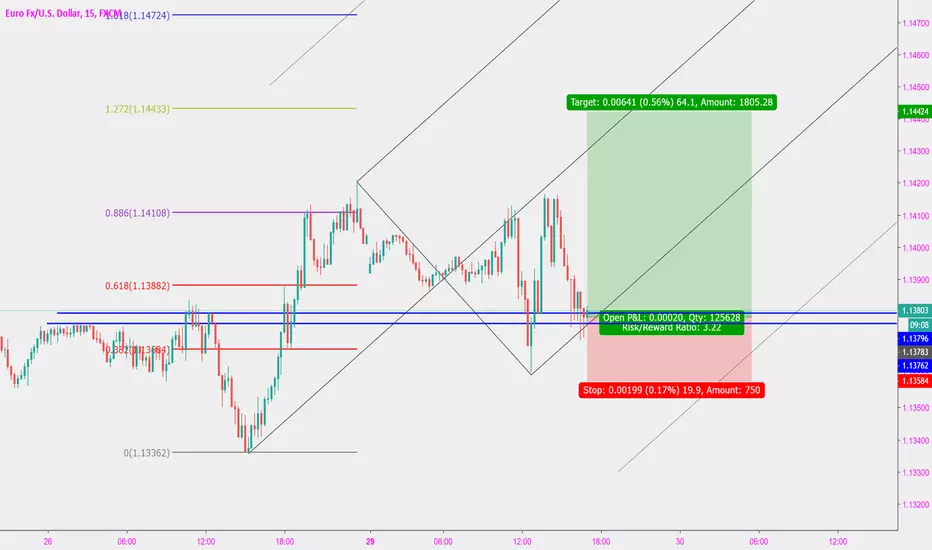
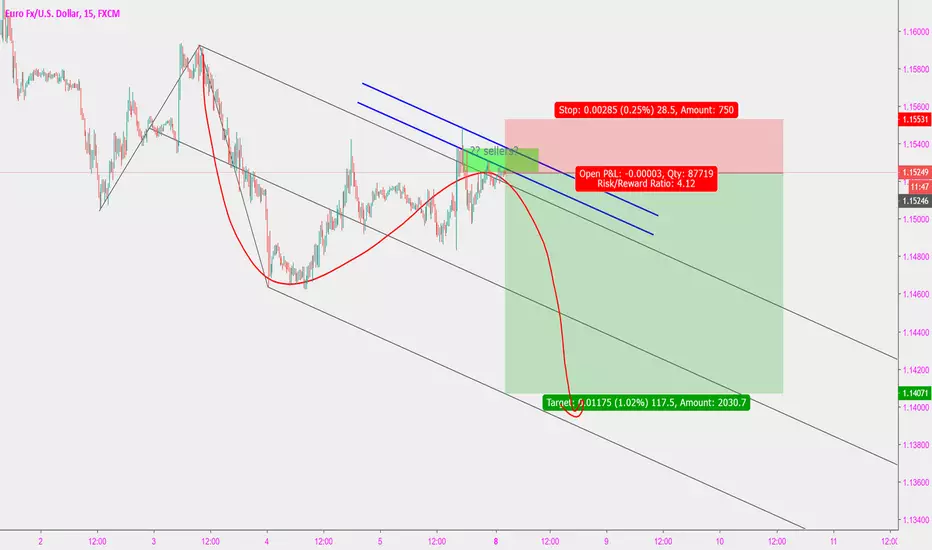
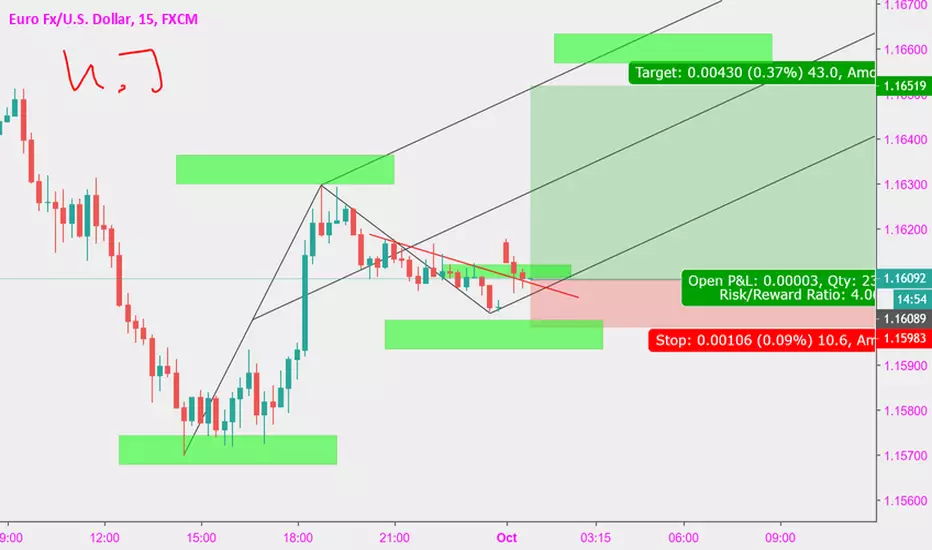
PITCHFORK - Forex EURUSD Analysis Q3 2018Analysis for EURUSD Q3 2018
We could see price has makes few retest and reversal around the median line
Expecting the price is still under strong momentum upwards
Price expectations are able to reach the upper line and move in the ascending channel
