Why Did I Lose XAUUSD During NFP Time .... Waiting for a Miracle
Why Did I Lose XAUUSD During NFP Time 😢 While I Was Waiting for a Miracle 😉… and Everyone Else Cashed In? 🤑
Alright, champ. Let’s break down why you lost your short trade around $3,348 per ounce, while the whole world seemed to be printing money. This one’s for the smartest and slickest trader on Egyptian soil—but explained like someone who actually understands market behavior, not someone blindly quoting a textbook. Grab a pen and paper. Let’s dig in.
⸻
🔥 Part 1: “You Faced NFP Like You’re Superman”
❌ What Happened:
• Price shot up hard after the NFP release.
• You said, “That’s too much—it must come down.”
• You went short from the top (around 3,305).
😵💫 Where You Went Wrong:
• NFP isn’t just any move—it’s nuclear fuel for the market.
• The move that follows it is usually an impulse wave—it continues, it doesn’t pull back.
• The market doesn’t drop just because it went up a lot. It drops when:
• Volume dries up.
• Buyers get bored.
• You spot negative delta or divergence.
⚠️ None of that was present when you shorted.
✅ The Smarter Mindset:
“During major news events like NFP, the market doesn’t pull back—it follows through.”
⸻
🔥 Part 2: “Volume Was Screaming in Your Face: I’m Not Done Yet!”
📊 What You Saw:
• Positive delta.
• Increasing volume.
• Big lot sizes hitting the ask side.
❌ What You Ignored:
• No divergence between effort and result.
• Buyers were still strong—no weakness.
• Price wasn’t reacting to resistance; it was smashing through it.
💡 Big Difference Between:
• Absorption = buyers easing the price up slowly.
• Rejection = buyers failing and price slapping back.
You mistook absorption for rejection—classic rookie mistake.
✅ The Real Lesson:
“As long as volume is pushing price, stick with the trend.”
⸻
🔥 Part 3: “You Misused Fibonacci Like a Hammer on a Screw”
❌ What You Did:
• You shorted at the 125%-150% Fibonacci extensions.
• You said, “Price must reverse here.”
📏 What You Should’ve Known:
These levels (138.2%, 150%, 161.8%, 200%) are not sell zones.
They are target zones for buyers, not resistance levels.
✅ The Correct Use:
• Use 125% or 138.2% as breakout buy zones.
• Take profit at 161.8% or 200%.
These are where bulls take profits—not where you blindly short just because “it went up a lot.”
⸻
🎯 Why You Can’t Just Sell There:
Because those zones are:
• Where buying continues.
• Not where it stops—unless momentum fades.
That only happens when:
• Volume drops.
• Delta turns negative.
• Rejection wicks appear.
But what did you do?
You shorted into momentum—while buying was on fire—thinking, “It must stop here!”
⚠️ Nope, bro. That train was still moving—you just stepped in front of it.
⸻
🔥 Part 4: “You Forgot Market Psychology”
🤔 What That Means:
• After NFP:
• Smart money enters early.
• Retail traders wait and watch.
• When price breaks up, retail chases → market moves more.
• Smart money sells into their faces and takes profit.
❌ Your Mistake:
• You tried to be clever and beat the market.
• You didn’t ask:
• Who’s on the market’s side?
• Who’s chasing?
• What will the crowd do next?
When retail feels FOMO, they chase → and that’s what drives continuation.
⸻
🧠 Pro Playbook for NFP-Driven Impulse Moves
✅ Ideal NFP Trade Setup:
1. News release: NFP
2. Price action: Big breakout from range.
3. Confirmation:
• Increasing volume
• Positive delta
• No rejection wicks
4. Entry: Buy Stop above 125% or 138.2%
5. Stop Loss: Below the breakout candle
6. Targets:
• TP1: 161.8%
• TP2: 200%
Now that’s how you use Fibonacci properly, not like people randomly dragging lines around.
⸻
🎯 Where to Draw the Fib Levels From?
✅ The Rule:
From the start of the explosive move to the first clear top right after the news.
🧨 For NFP:
• From: the low of the NFP candle (or the first strong move after the news).
• To: the first visible high with:
• A pause in upward momentum
• A doji candle
• Rejection wick
• Or minor resistance before the move continues
Example:
• Low: around 3,291.50
• Temporary high: around 3,316.00
Draw your Fib from:
• Bottom = 3,291.50
• Top = 3,316.00
⸻
✳️ How to Use the Levels After That:
• 100% = Move ends at the high
• 125% = First extension
• 138.2% = Real ignition point
• 161.8% = Golden target
• 200% = Full wave target
💡 Why Use Buy Stops Above 125%-138.2%?
Because:
• Price breaks above previous highs (lots of traders sell there).
• It creates fake sell traps.
• You enter after the stop-hunt, when the market wipes out sellers and goes higher.
⸻
🔥 How That Looks in Practice:
1. Draw Fib from the start of the NFP impulse move.
2. Wait for price to reach 125% or 138.2%.
3. Place a Buy Stop just above that.
4. Aim for 161.8% or 200% as targets.
Megabardetectorindicator

MACRO CONTEXT & NEWS FLOW IMPACT — "WHY THE HELL IT MOVED"🔥 I. MACRO CONTEXT & NEWS FLOW IMPACT — "WHY THE HELL IT MOVED"
Yesterday’s move was a classic institutional fakeout followed by controlled accumulation. Today is retest day. Watch VWAP and order flow like a hawk. Don’t chase, wait for reversion and load at value.
📅 Date: July 30, 2025
📰 Event:
US Employment Cost Index: Lower than expected
Core PCE: Cooled off
Market Implication: Fed easing is now on the table.
DXY Weakens → Real yields drop → Gold gets bought like crazy.
👊 Institutional Logic:
Rate-sensitive assets (Gold, Bonds) exploded after the release.
Algorithmic reaction to macro signal: DXY down → XAU bid hard → MegaBar explosion.
BUT institutions needed liquidity to enter big → they faked a breakdown first.
That’s institutional deception 101.
📉 II. DAILY CHART ANALYSIS — THE BIG BOYS' GAMEBOARD
🗺️ Structure:
Price dropped from 3,355 to 3,258 in 3 days — a high-velocity markdown.
On July 30, Price printed a Megabar reversal (Massive range, delta-flush, volume spike).
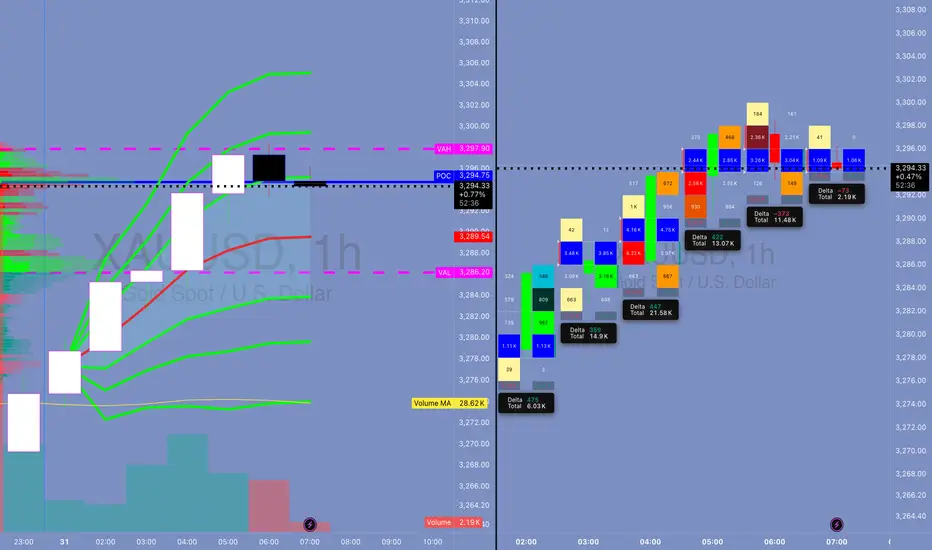
VAH = 3,294.90 capped upside.
POC = 3,288.91, and VAL = 3,282.90 held beautifully.
🔍 Institutional Pattern:
This is a classic “Flush > Absorb > Mark-up” sequence.
Textbook from “Technical Analysis and Stock Market Profits”:
“Volume confirms intention, range confirms commitment. A wide bar with climax volume at low implies the exhaustion of sellers and transfer of ownership.”
🔑 Key Daily Stats:
📉 Delta Flush: -584K
🔁 Reversal Delta: +70K
🔊 Volume spike: >450K (Well above 30-day volume MA)
💡 Inference:
This bar did not print because of retail buying. It’s smart money rebuying from panic sellers.
⏱️ III. 4H / 1H TIMEFRAME: ORDERFLOW & REACCUMULATION
📌 4H Chart:
📍 Megabar with -191K delta near 3,258 (Volume: 191.14K)
Immediate absorption by dark blue and green delta bars — this was not retail reversal.
VWAP reversion in play — price gravitates toward 3,294 (VWAP anchor zone)
🔁 1H Chart:
Rapid stair-stepping: Each hourly candle had higher lows and strong deltas.
Volume built from super-POC 3,289 to super-VWAP 3,295.25.
Final hour: exhaustion wick → distribution into resistance.
🧠 Institutional Tactic:
They used Volume by Price congestion to hold price between FVRP bounds:
Low Volume Nodes (LVNs) = acceleration zones
High Volume Nodes (HVNs) = consolidation + absorption zones
🔍 IV. 15M / MICROSTRUCTURE — WHERE THE GAME WAS REALLY PLAYED
🔬 VWAP Stack Analysis:
VWAP: 3,294.61
D-VWAP: 3,289.30
Super-VWAP Cluster held price in check — real institutional price magnet.
🔄 Delta Flow (15m):
Delta climbed from -3.15K → +3.21K in 1.5 hours.
Imbalance flipped bullish near POC.
🎯 FPVR Mapping (Volume Profile Right Side):
Thickest distribution volume occurred at 3,287 – 3,295
Value tightly packed = fair price.
Institutions are loading in value, not chasing.
⚙️ V. INDICATOR & MOMENTUM SIGNALS — INSTITUTIONAL CONFLUENCE ZONES
Tool Signal
VWAP Anchored VWAP tagged and respected — classic institution level
SMA50 Capped daily move (3,342) — still a long-term bearish lid
HMA5/9 Bullish crossover on 15m/1H – signals momentum alignment
Volume MA Volume climax confirms effort at lows, signaling phase change
🔩 VI. TECHNICAL SEQUENCING OF EVENTS (STEP BY STEP)
Asia Session: Tight range, price floats around VAL (3,282)
London Session: Fake breakdown to 3,258 – traps late shorts
NY Pre-News: Choppy price action within FRVP range
Macro News Drop: Megabar → -191K delta flush
Next Candle: Delta flips +21.2K → Absorption confirmed
Price Walks Up: Controlled bid to VWAP
End of Day: Distribution at VAH → price capped by VWAP band
💣 Final move = algorithmic mean reversion + VWAP auction completion
🧬 VII. ADVANCED ORDERFLOW INTERPRETATION
⚔️ MEGABAR (The Trap Setup):
Volume = 191K+
Delta = -191K (yep, full-on flush)
What happened?
→ Late shorts + stop runs + SL hunters got rekt.
→ Institutions absorbed, switched algo, and reversed.
🧱 FVRP (Fair Value Range Profile):
Defined by VAL (3,282.90) and VAH (3,294.90)
Institutions play inside this range for risk efficiency
They accumulate low and distribute high within it
🔄 Delta Rotation:
Delta Rotation = Shift from Negative Accumulation → Positive Distribution
Classic rotation confirms phase transition
🧠 VIII. INSTITUTIONAL OBJECTIVE (WHAT THEY WANTED)
Primary Goal: Create liquidity void below → Enter large long positions
Secondary Goal: Return to VWAP zone and unload
Tertiary Goal: Signal to market: "We're in control, stay out or get punished"
This is textbook Volume Profile Auction Theory in motion.
🎯 IX. HYPOTHETICAL TRADE SETUP (EDUCATIONAL PURPOSE ONLY)
🧾 Trade Plan: Institutional VWAP Reversion Play
Order Type: Buy Limit
Entry: 3,287.00
Stop Loss: 3,279.00 (below VAL & invalidation)
Take Profit: 3,300.00 (Super-VAH zone)
Confidence: 85%
R/R: 1:1.6
💡 Justification:
Entry at POC + SMA50 cluster
Stop below structural invalidation zone
Target near major supply
This is the exact playbooks funds run during reaccumulation rotations
🧠 X. EDUCATIONAL TAKEAWAY — WHAT YOU SHOULD LEARN
Volume is truth. If volume spikes at lows, it’s not weak hands — it’s smart money flipping.
VWAP is magnet. Everything mean-reverts back to VWAP in controlled auctions.
Delta tracks aggression. Sharp delta reversals = algorithm switch.
Megabar = signal. Huge candle + volume + delta = possible phase shift.
FRVP = roadmap. Price doesn’t move randomly — it moves to balance imbalances.
🔚 CONCLUSION — YESTERDAY’S LESSON
July 30, 2025 wasn’t just a bullish day — it was a textbook institutional deception-reversion cycle. If you understand:
How the news was used
How the megabar printed
How the volume clustered
How the VWAP held
… then you’re not trading blindly.
You’re trading with the damn architects of the market.