Opening A Small Position In FARTCOIN HereGood Morning Trading Family,
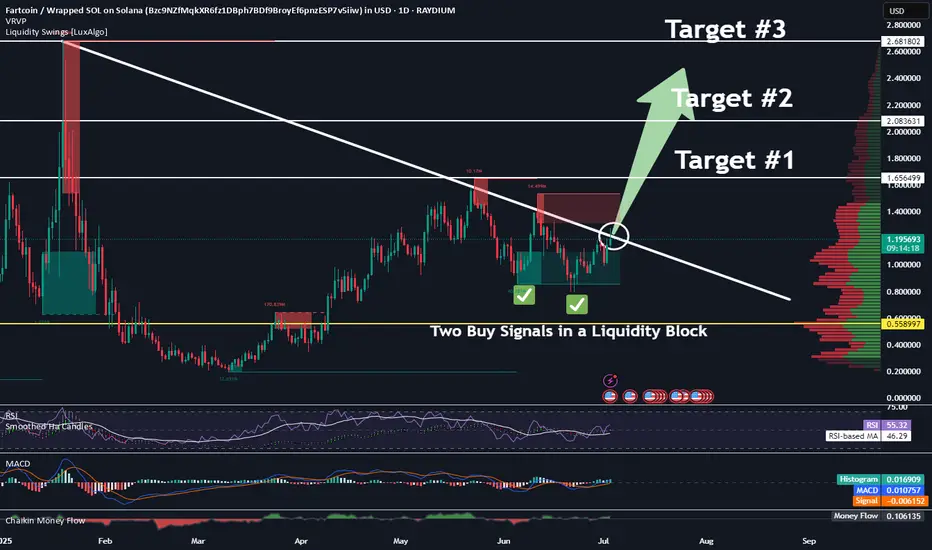
I may be a little early here, but at $1.00, I can't resist. I am picking up a small position in FARTCOIN here. I have three targets above. Each will eventually be hit IMO, but for now, I will only be shooting for TARGET #1. I may sell half at that point and let the rest ride.
Now, here are the technical reasons for making my entry here without waiting for my indicator to signal.
First of all, there are three trendlines, all significant, all converging at this one particular point, making this a powerful area of confluence!
Secondly, we broke to the topside of that descending trendline but never really came back to kiss mamma goodbye. Today we are doing that! This is a patent technical move that indicates healthy price fluctuation and is exactly what I have been waiting for.
Third, the VRVP indicates a ton of volume in this area (mostly buyer), which will be tough to break below without significant FUD, which, of course, is always a possibility.
Finally, all of my lower indicators show this thing is starting to get oversold: RSI, MACD, Chalkin MF, HA.
If we do dip lower, I will simply increase my position unless I hit my SL first. My SL is around .78 with my projected first target at 1.66 for a nice 1:3 rrr.
Good luck, all!
✌️Stew
Memecoins

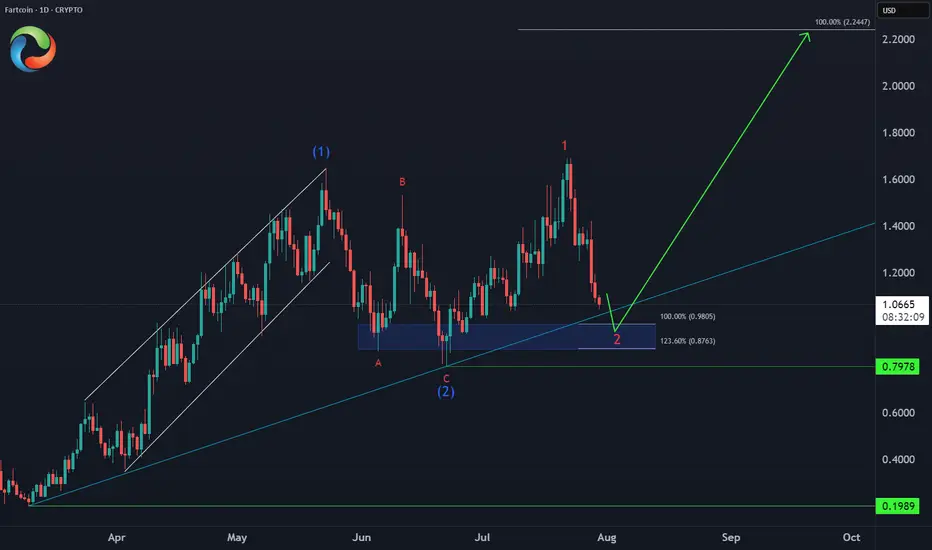
FARTCOIN Bullish Setup 📈 CRYPTO:FARTCOINUSD Entering an extreme buying area:
✅ Key support zone: $0.98-$0.87 (April trendline + equal legs)
⛔ Invalidation: $0.79
🎯 Target: $2.20 (124% upside)
This is how explosive meme setups look before liftoff.
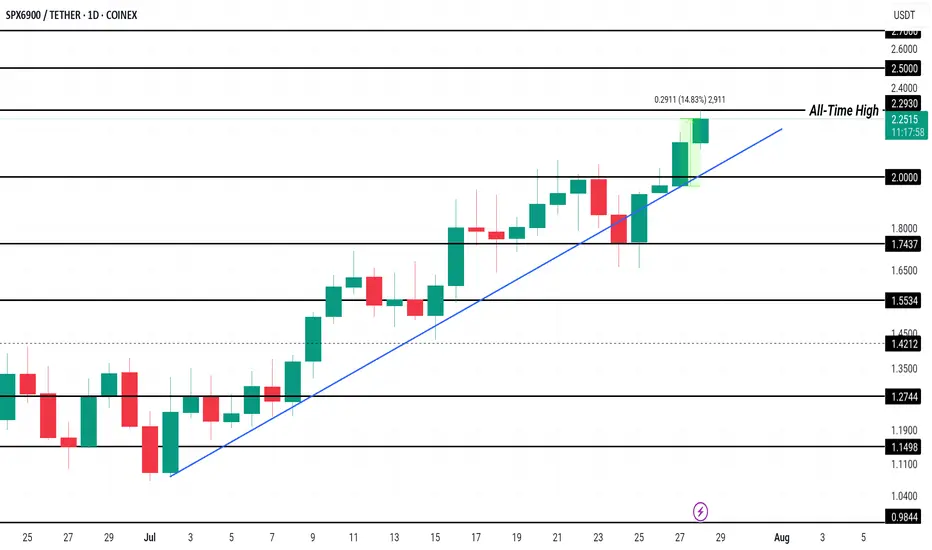
SPX Price Hits New All-Time High, $2.50 Up NextCOINEX:SPXUSDT has been experiencing a consistent uptrend since the beginning of the month, leading to the formation of multiple all-time highs, including one today at $2.27 . This price action reflects strong investor interest, pushing the altcoin to new levels and generating a positive market sentiment.
Currently trading at $2.23, COINEX:SPXUSDT has gained 14% in the past 24 hours . The Ichimoku Cloud, acting as support, signals bullish momentum. This suggests that SPX could rise further, with the potential to reach $2.50 or higher if market conditions remain favorable and investor confidence persists.
However, if selling pressure intensifies, COINEX:SPXUSDT could experience a reversal . A dip below the $2.00 support could push the altcoin toward $1.74 or lower, invalidating the bullish outlook.
From Hype to Hesitation: What’s Next for Pump Fun ($PUMP)?Today, I want to break down the recent developments and fundamentals of Pump fun ( BYBIT:PUMPUSDT ) and its token PUMP — a project that initially launched with strong hype but is now facing serious investor concerns .
What is Pump fun?
Pump fun is a memecoin launchpad that allows users to launch and trade memecoins in a gamified, simplified environment. The idea was to create a frictionless way for anyone to generate and speculate on meme tokens, leveraging viral growth and community culture.
Its native token, PUMP , was introduced via an ICO priced at $0.004, with 12.5% of the total 1 trillion supply offered during the sale.
Latest Updates – Past 24 Hours Recap
PUMP Crashes Over 50% After ICO :
The token initially spiked to $0.0068 on launch day (July 16) , but has now dropped over 50%.
This is roughly 14% below its ICO price , creating concerns for short-term investors.
Founder Confirms No Airdrop Anytime Soon:
In a livestream with ThreadGuy , project founder Alon Cohen confirmed:
“ The airdrop is not going to be taking place in the immediate future. ”
While the team still plans to deliver an airdrop, Alon emphasized it must be well-executed and meaningful, not rushed for hype.
The current focus is on long-term growth and ecosystem sustainability, not short-term incentives.
Mixed Investor Sentiment:
High-profile trader Machi Big Brother ( Jeffrey Huang ) reportedly increased his long position in PUMP — even though he’s down over $5.8M on his position.
Meanwhile, two wallets linked to private sale investors dumped over 1.2B PUMP at $0.003 , taking a combined loss of $1.19M.
Declining Volume and Market Cap:
Trading volume has dropped significantly.
PUMP has lost over 40% of its value in the past 7 days.
Short-term holders appear uncertain, while the project team asks for patience and long-term vision.
Fundamental Outlook:
Pump fun’s future now heavily depends on:
The real utility of the platform as a meme coin incubator.
The team’s ability to regain trust after delaying the airdrop.
Whether new features or hype can revive volume and user engagement.
-------------------------------
Now, let's examine the PUMP token from a technical analysis perspective
From the outset, I must say that due to the small number of candlesticks that create the PUMP token, technical analysis may be a bit difficult , but we will use technical analysis tools to analyze this token.
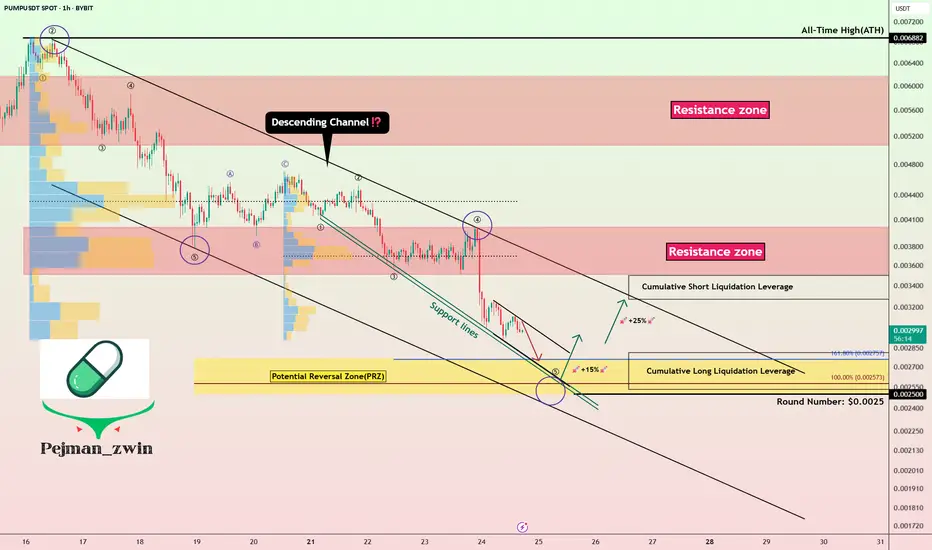
The PUMP token seems to be moving in a descending channel since the beginning of its correction (over -50%) until now, we need a second price bottom to confirm the descending channel.
I expect the PUMP token to rise from the Potential Reversal Zone(PRZ) and near the Support lines to $0.0029(+15%) . PUMP Token increase can also be from the bottom of the ascending channel .
Second target: the upper line of the ascending channel.
Cumulative Long Liquidation Leverage: $0.002810-$0.002530
Cumulative Short Liquidation Leverage: $0.003498-$0.00327
Note: Stop Loss(SL): $0.002391
Please respect each other's ideas and express them politely if you agree or disagree.
Pump fun Analyze (PUMPUSDT), 1-hour time frame.
Be sure to follow the updated ideas.
Do not forget to put a Stop loss for your positions (For every position you want to open).
Please follow your strategy and updates; this is just my Idea, and I will gladly see your ideas in this post.
Please do not forget the ✅' like '✅ button 🙏😊 & Share it with your friends; thanks, and Trade safe.
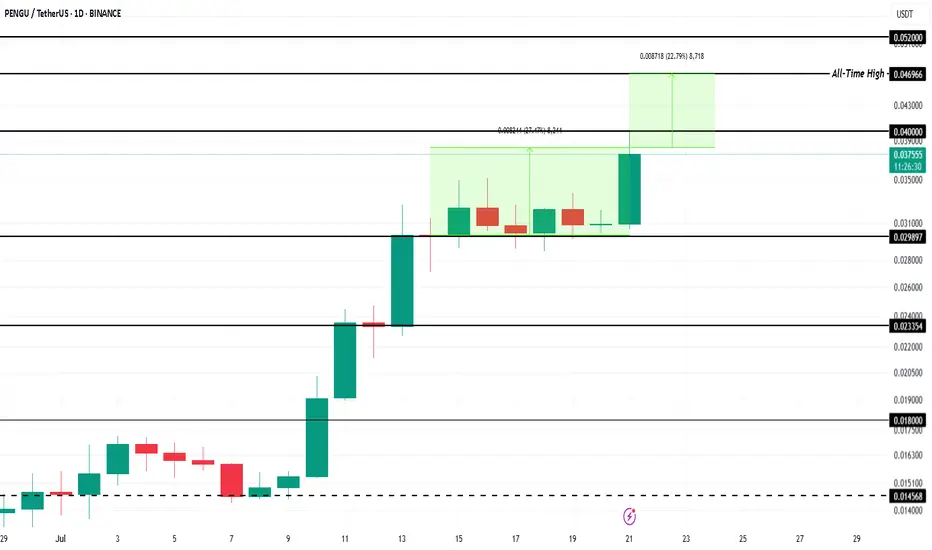
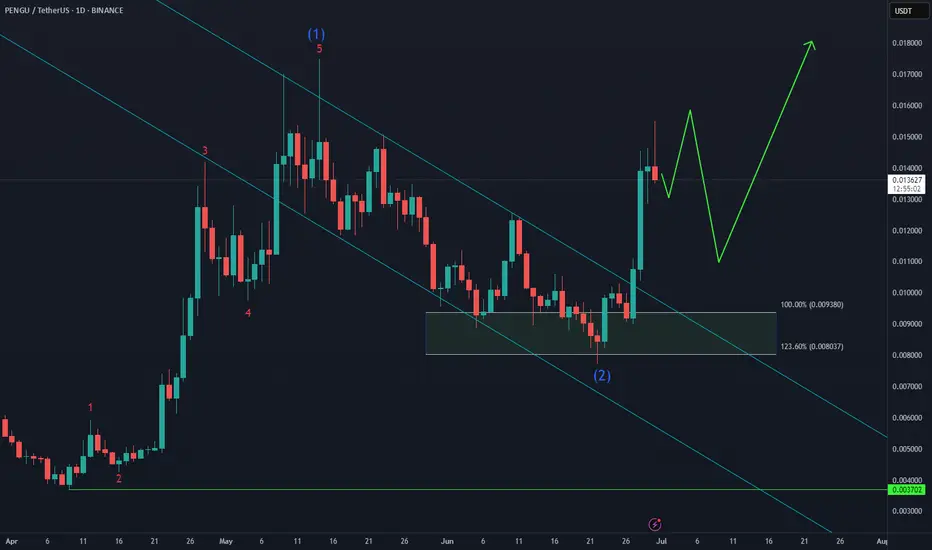
Meme Coin To Watch This Week - Pudgy Penguin (PENGU)BINANCE:PENGUUSDT price has surged 27% in the past week , currently trading at $0.038. The meme coin is inching closer to its all-time high of $0.046 . Strong bullish sentiment and market participation are fueling this rally, signaling that PENGU could soon retest resistance levels if momentum remains intact.
The meme coin is now just 22% away from hitting its record high . A Golden Cross pattern formed last week adds to the bullish outlook. If BINANCE:PENGUUSDT successfully flips $0.040 into a stable support level, the rally could continue, pushing the altcoin higher toward reclaiming its historical peak.
However, downside risks remain. If investors begin booking profits, selling pressure could drag BINANCE:PENGUUSDT lower . The critical support level of $0.029 will come into play. Losing this support could halt the upward trend and invalidate the optimistic price projection in the near term.
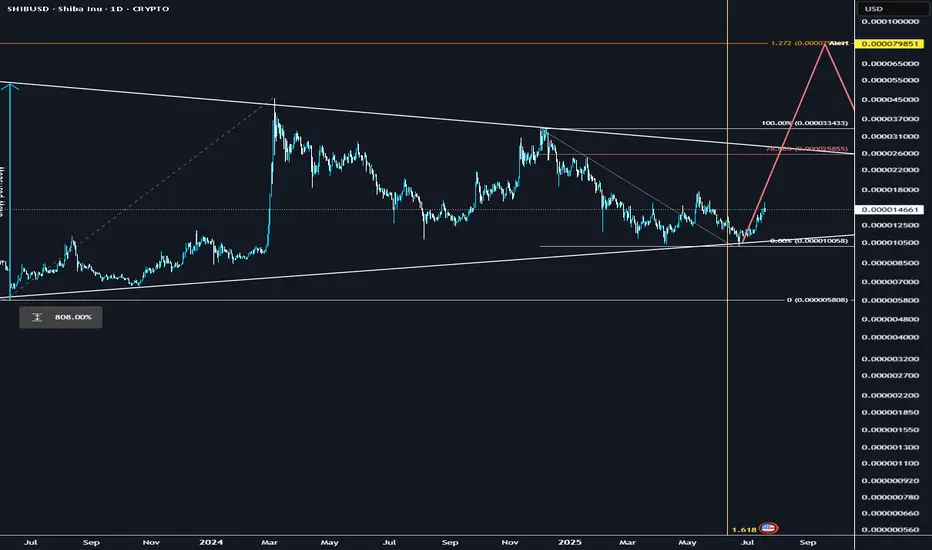
SHIB could explode soon.Multi year accumulation, crossing a significant fib-time pivot, similar set up to XRP.. could follow DOGE once it takes the lead as a catch up trade and rip..
Technical breakout: Above 200-day MA + golden cross formation
Volume surge: Social + trading volume spiking, driving demand
Ecosystem catalysts: Shibarium L2, metaverse progress, aggressive token burns cutting supply
Macro tailwinds: ETH rally + broad altcoin strength
I think it could be one of the leaders before capital rotates into the lower caps
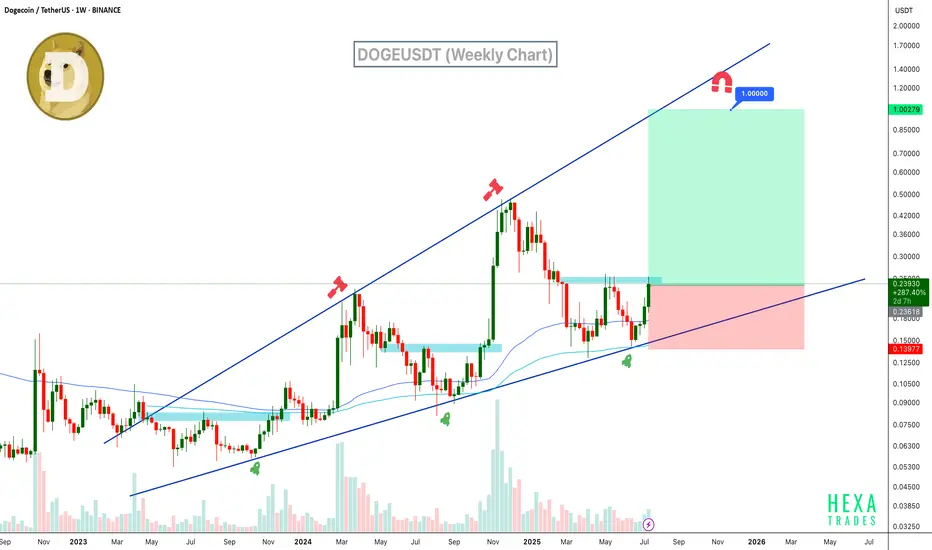
Will DOGE Hit $1? Ascending Broadening Wedge in PlayDogecoin is trading within a clear ascending broadening wedge on the weekly chart. The price has bounced strongly from wedge support and the 100 and 200 EMAs, now pushing upward with growing volume and bullish candles. If momentum sustains, DOGE could rally toward the $1 psychological target and broadening wedge resistance.
Resistance 1: $0.35
Resistance 2: $0.60
Resistance 3: $1.00
Stop Loss: $0.14
Cheers
Hexa
COINBASE:DOGEUSD BINANCE:DOGEUSDT
PEPE Faces Key Resistances – Is a -8% Pullback Coming?The PEPE memecoin ( BINANCE:PEPEUSDT ) is currently near the Resistance zone($0.00001392-$0.00001330) and Important Resistance lines . This is the third time that PEPE has attacked the Important Resistance lines .
In terms of Elliott wave theory , it seems that PEPE is completing the microwave 5 of the main wave 3 , so that the main wave 3 is of the extended type .
Also, we can see the Regular Divergence(RD-) between Consecutive Peaks.
I expect a -8% drop for PEPE in the coming hours.
First Target: $0.00001251
Second Target: $0.00001212
Note: Stop Loss(SL)= $0.00001400
Please respect each other's ideas and express them politely if you agree or disagree.
PEPE Analyze (PEPEUSDT), 4-hour time frame.
Be sure to follow the updated ideas.
Do not forget to put a Stop loss for your positions (For every position you want to open).
Please follow your strategy and updates; this is just my Idea, and I will gladly see your ideas in this post.
Please do not forget the ✅' like '✅ button 🙏😊 & Share it with your friends; thanks, and Trade safe.

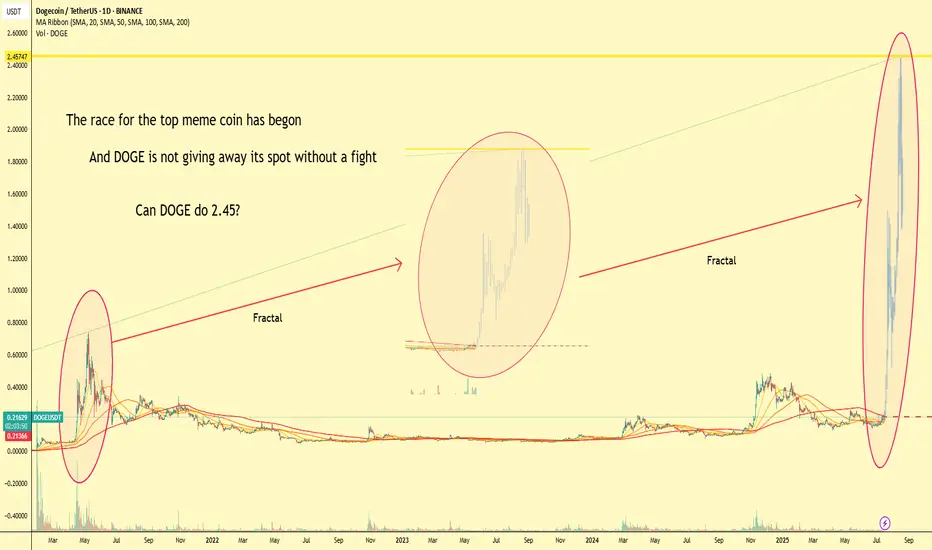
The Meme Coin Race Has Begun, DOGE fighting for top spot!📈 The Meme Coin Race Has Begun
🔥 The battle for the throne is heating up...
🐶 DOGE, the original meme coin, isn’t giving up its crown without a fight.
Fractals from the past seem to echo in today's chart – history doesn’t repeat, but it rhymes.
⚔️ With new challengers lining up in the meme arena, one question remains:
Can DOGE reach $2.45 and reclaim the top spot?
🚀 Volume is rising. Patterns are aligning.
The king is awake.
👑 The OG vs the New School. Who will win the meme war?
Comment your prediction 👇
#DOGE #MemeSeason #CryptoFractals #Altseason #DOGEUSDT #CryptoTrading #TradingView #FractalAnalysis #CryptoWar #MemeCoins
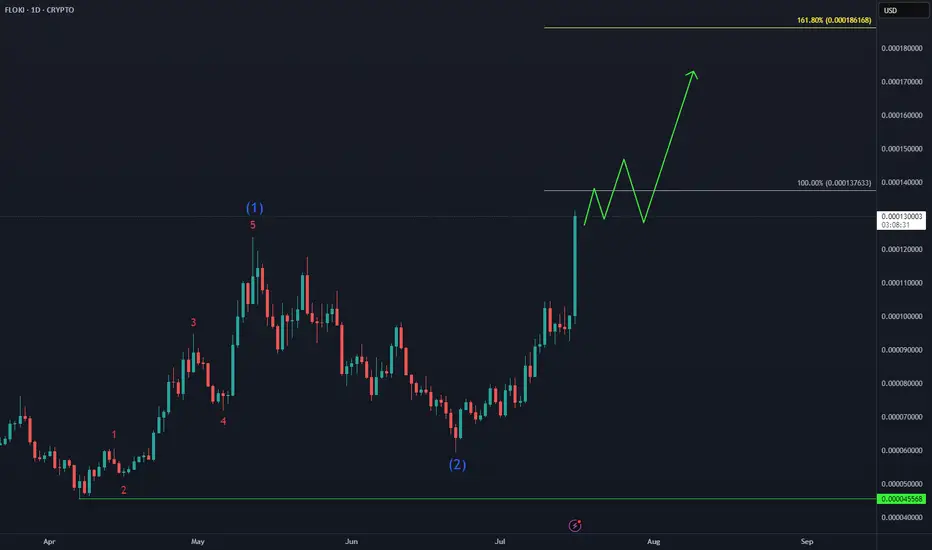
FLOKI Isn’t Missing the Party🚀 CRYPTO:FLOKIUSD Price has broken above the May peak, confirming a bullish continuation. With momentum building, price is now eyeing the next upside target near $0.00018.
#elliottwave #memecoins #altseason
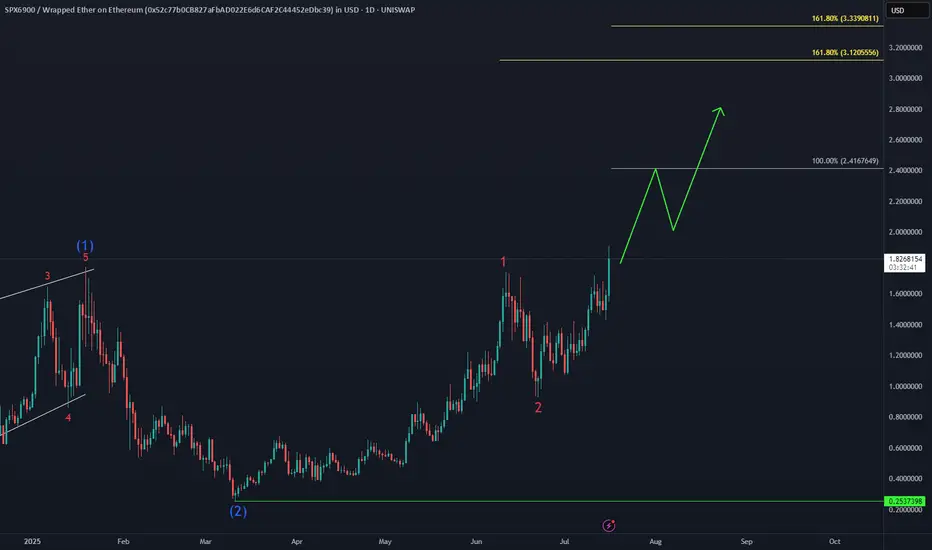
#SPX6900 Bullish SequenceThe Gate Is Open – Send It 🚀🚀🚀
UNISWAP:SPXWETH_52C77B.USD just smashed into a new all-time high, unlocking the next bullish targets at $2.4 and $3.1.
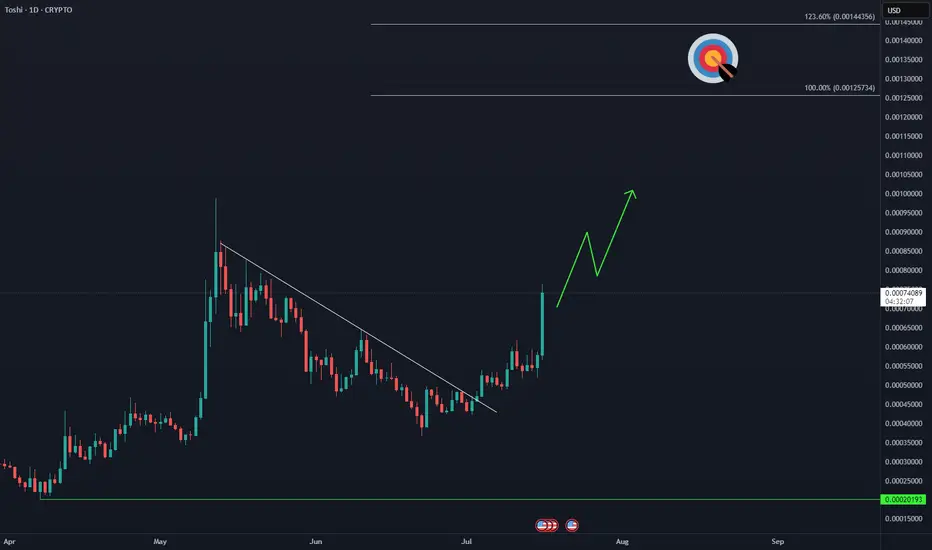
TOSHI Bulls on the Move🚀 COINBASE:TOSHIUSD is showing signs of acceleration, aiming to break above the May peak and extend toward the $0.0012 target zone.
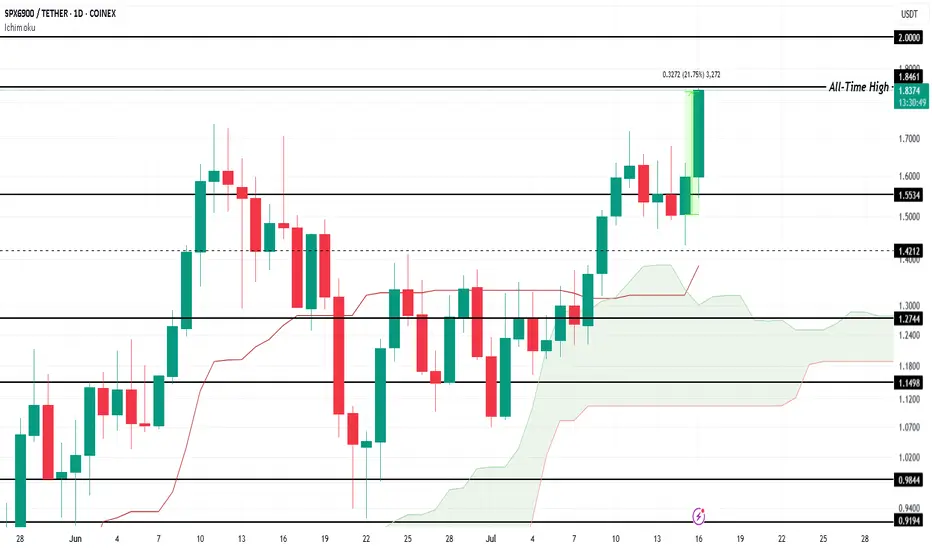
SPX Forms New All-Time High, Price Nears $2.00COINEX:SPXUSDT price has surged by 21.75% over the last 24 hours , reaching a new all-time high (ATH) of $1.84 . At the time of writing, SPX is trading at $1.83, showing promising signs of further upward movement. The altcoin's strong performance reflects growing investor interest and market optimism.
The Ichimoku Cloud, which lies beneath the candlesticks, signals that bullish momentum is currently prevailing for $COINEX:SPXUSDT. This technical indicator suggests that the altcoin could continue its ascent, potentially breaching the $2.00 level in the near future . If the trend persists, SPX could set new price milestones.
However, if COINEX:SPXUSDT experiences significant selling pressure from investors, the altcoin could face a correction. A drop below $1.55 would indicate a shift in momentum and potentially erase some of the recent gains. A failure to maintain key support levels could lead to further downside risks.
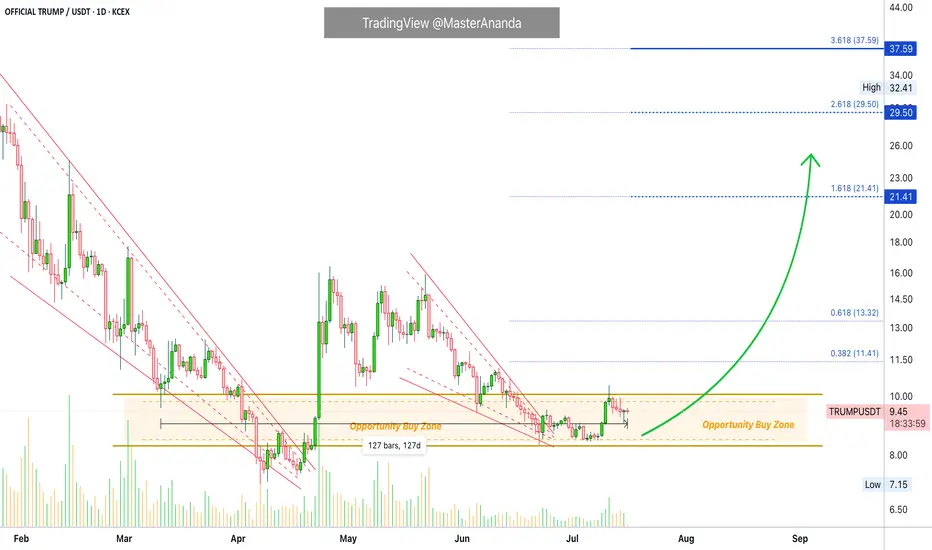
OFFICIAL TRUMP Trading Within Opportunity Buy Zone—About To ExitThis is the last chance to get OFFICIAL TRUMP (TRUMPUSDT) within the opportunity buy zone, the best possible entry prices before a major bullish wave.
Good morning my fellow Cryptocurrency trader, this market has endless opportunities to offer. There is always a second chance; it is never too late.
This "Opportunity Buy Zone" has been available only once briefly before the current period. The first three weeks of April. The second entry into the opportunity buy zone within a higher low happened in June and has been active for 41 days. Time is running out.
Since 11-March, when the current zone was activated through present day, we have more than four months. That's four months of consolidation, sideways... The market can remain neutral only for so long, and it isn't bearish anymore.
The downtrend ended with the 7-April low, the big red falling wedge. After this date the market started a recovery and then we have a retrace—the small falling wedge—and within this retrace market conditions remain bullish based on a higher low.
The main low and market bottom happened 7-April 2025 and the higher low 22-June 2025. This means we are already on the bullish train.
The higher low will lead to a higher high which simply means higher prices. Let's skip the technical analysis and move to the good part.
Maximum growth
How do you see the market right now? How do you see TRUMPUSDT?
It is not going to be the same forever actually, we are expecting big change.
All those days going sideways, down, boring, the market retrace; when it changes it will be so much different. Imagine, visualize, 100%+ in a single day. Then repeat this process over and over. Still some swings and corrections, but that is how you get to 1,000%+ or even 2,000% growth in 30 days.
The meat of the bullish move can happen within 1-2 months. It can also take 4-6 months. What happens is that the start date is not the date when prices start to rise fast but the date the market hit bottom. This means that we are already three months in (100 days) into this bullish wave. Why? Because the low happened 7-April. When you get a strong bullish breakout and the market peaks after two months, total duration of the bullish cycle wouldn't be two months but five months.
We are already on the other side. Now that the next low is in, TRUMPUSDT will be moving to produce a higher high.
Patience is key. The best is yet to come.
Hold strong; rest easy... You will be happy with the results.
Namaste.
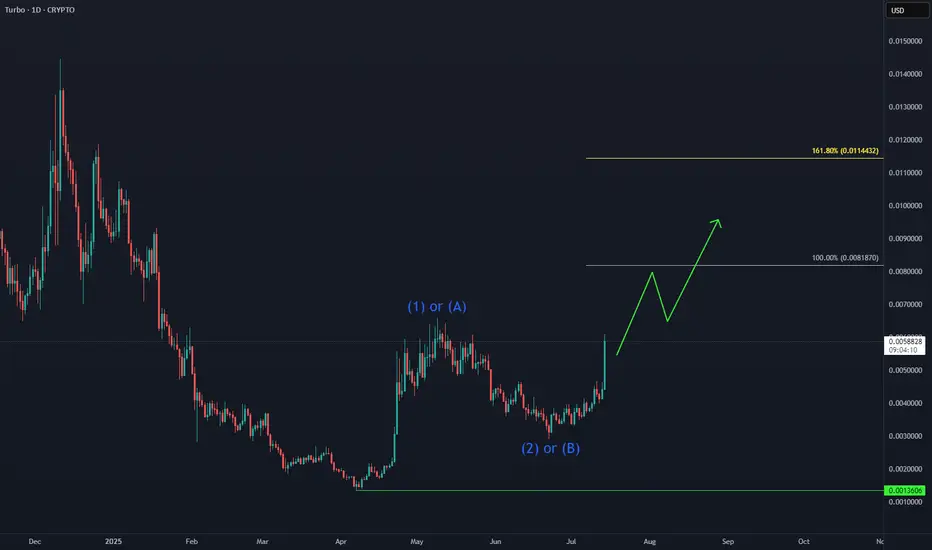
TURBO: Next Leg Higher in Progress📈 CRYPTO:TURBOUSD is building momentum after holding key support levels, with Elliott Wave projections pointing toward the equal legs target zone at $0.008–$0.011. The recent bullish structure suggests continuation, especially following its Binance US listing and strong community backing.
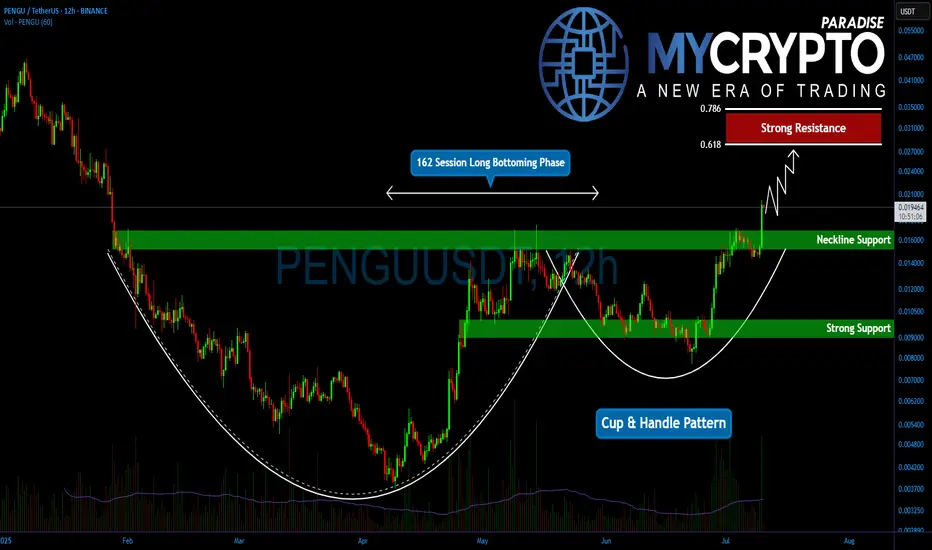
PENGU Just Triggered a Massive Breakout! Key Levels to WatchYello, Paradisers! Are you watching what’s unfolding with #PENGU after months of quiet accumulation? Because this chart is finally waking up, and it’s happening right now.
💎After a prolonged bottoming phase that lasted approximately 162 sessions, PENGU has completed a classic cup and handle formation, and we’re now seeing the start of what could be a powerful breakout.
💎#PENGUUSDT has surged above the neckline resistance at $0.01680, and—more importantly, this breakout is backed by strong volume, giving the move real credibility. It’s not just a wick; it’s a genuine push.
💎Now that the neckline is broken, PENGU has room to push higher. But let’s be clear, price is likely to face moderate resistance at the $0.02280 level. That’s a spot where some short-term profit-taking can’t be ruled out, especially from early entries. It’s a natural reaction zone and a moment to watch for how price behaves under pressure.
💎Still, if momentum holds, the pattern suggests a potential move toward the $0.02820 to $0.03200 region. That zone is no joke. It includes the 61.8% and 78.6% Fibonacci retracement levels, two of the most powerful technical resistance points in any market cycle. This makes that area a major decision zone and one that should be approached with caution.
💎On the other side, support is now established between $0.01680 and $0.01500. This is the previous resistance zone, and any retest into this range is likely to see strong demand stepping in. It would not be surprising to see buyers defend this area aggressively, especially if the retest is clean and orderly.
Strive for consistency, not quick profits. Treat the market as a businessman, not as a gambler. This is the only way you will make it far in your crypto trading journey. Be a PRO.
MyCryptoParadise
iFeel the success🌴
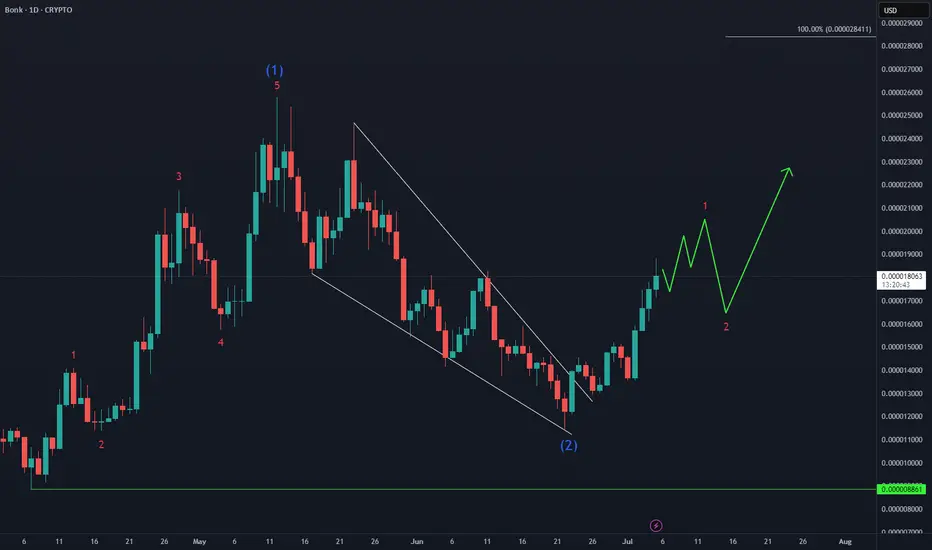
BONK Bullish Reversal in PlayAfter a clean 5-wave advance from the April low, CRYPTO:BONKUSD corrected 55%, then carved out a higher low last month. Now it’s eyeing a breakout above the May peak as the next leg higher begins.
Get Ready! Hot Air Rises. Fartcoin About To Break Wind.Trading Fam,
Our national debt is a meme. The buying power of our dollar is a meme. Our monetary system is a meme. The Fed is a ponzi scheme and a meme. Everything related to geopolitical economics has become a meme. We can't take any of this stuff seriously anymore. So, why not make a profit on the best memes of the day? Enter pungeant FARTCOIN. AI-created and managed, FARTCOIN is cutting loose with no reservations. And it looks like it is about to break wind again. They say hot air rises. Let's see how far this stink can go.
Let her rip!
Stew
Pudgy Penguins PENGU Bullish Reversal Taking Shape🐧 Pudgy Penguins BINANCE:PENGUUSDT has bounced twice from the $0.009–$0.008 buying zone, showing resilience despite the choppy structure. As long as the June low holds, the setup favors a higher low formation next month, potentially setting the stage for the next impulsive leg higher.
Momentum is building — now it’s about follow-through and confirmation.
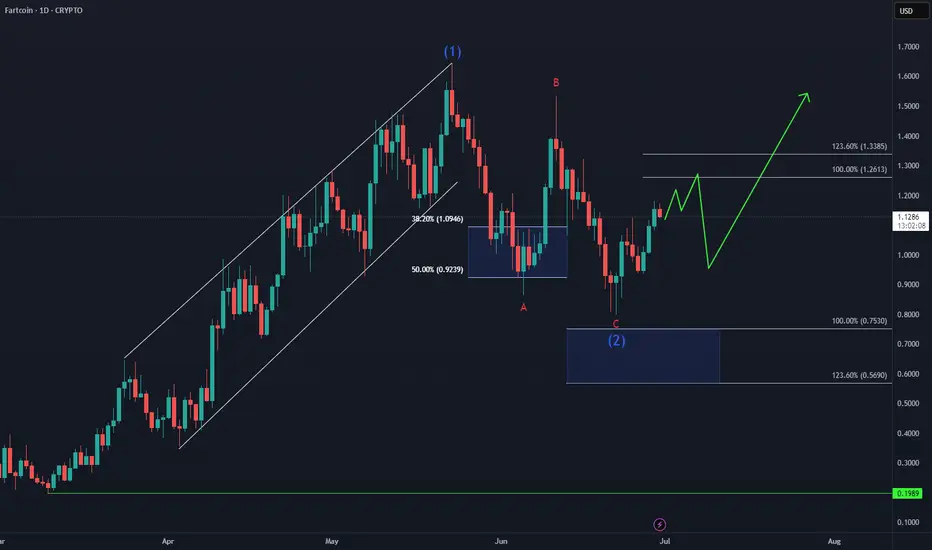
FARTCOIN Bullish Reversal in Progress
CRYPTO:FARTCOINUSD 3-swing correction from the May peak appears complete, even though price didn’t quite tag the $0.75 entry zone.
Now, the spotlight’s on the bulls — can they deliver an impulsive rally off the lows to invalidate a potential double correction next month?
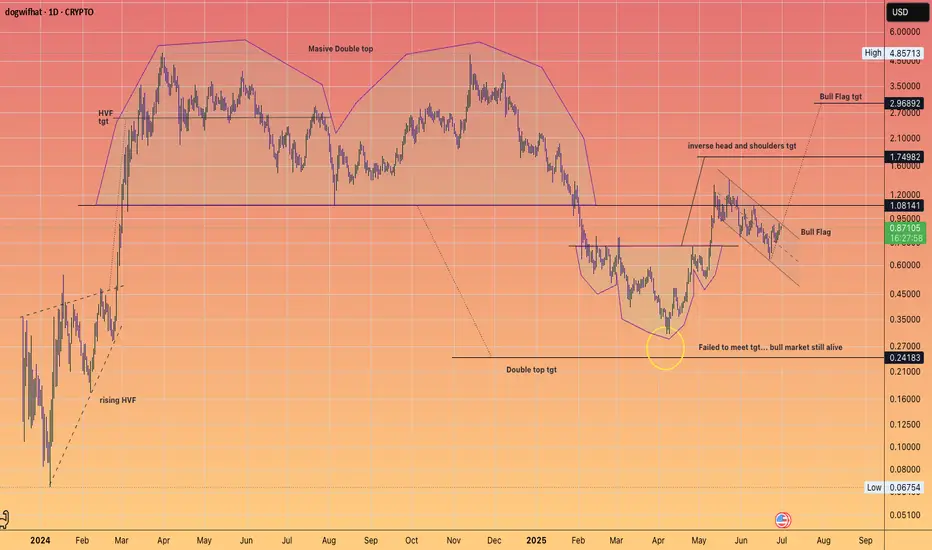
WIF back to $3Complete look at Dog WIF Hat
We had some pretty nice technical setups on this meme.
#HVF
#DoubleTop
#InverseHeadandShoulders
#BullFlag
Currently it has two active patterns ...
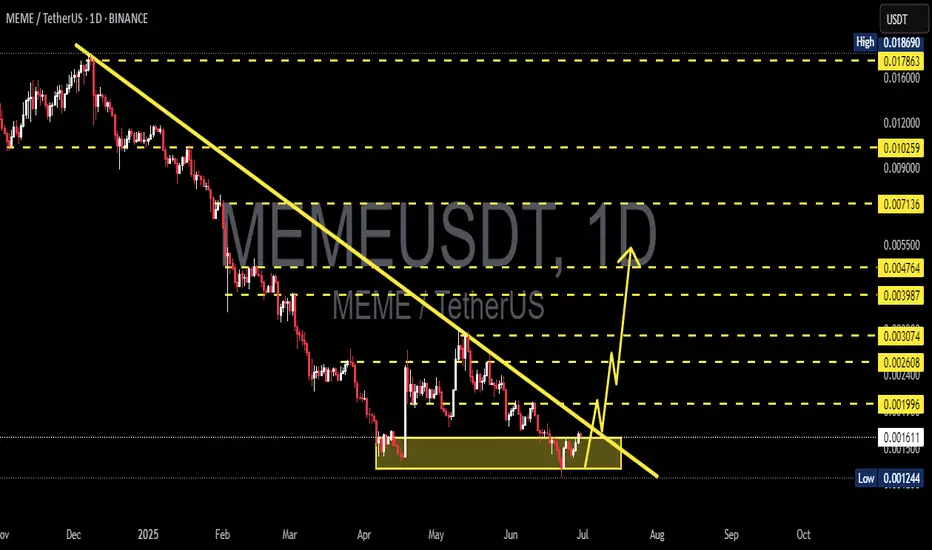
Trend Reversal Confirmed? MEME/USDT Bulls Take ControlThe MEME/USDT chart is showing a highly compelling technical setup. Here are the key points of the analysis:
1. Breakout from Long-Term Downtrend:
Price has successfully broken above a descending trendline that has been in place since November 2024. This breakout marks a potential end to the prolonged bearish phase and opens the door for a new bullish trend.
2. Strong Accumulation Zone:
A clear accumulation zone is visible between $0.00130 – $0.00160, lasting from May through late June 2025. This zone now serves as a strong support area.
3. Formation of Higher Lows:
After the breakout, price action has begun to form higher lows — a bullish signal indicating that buyers are stepping in.
4. Potential Upside Targets (Key Resistance Levels):
The chart outlines several key resistance levels that may serve as short- to mid-term targets:
$0.001996
$0.002608
$0.003074
$0.003987
$0.004764
$0.007136
$0.010259
$0.017863
$0.018690 (previous high)
5. Bullish Scenario:
If bullish momentum continues with strong volume, price could follow the projected upward zigzag pattern and move through these resistance levels progressively.
6. Risk Management Note:
A breakdown below the accumulation zone ($0.00130) would invalidate the bullish scenario and should be watched closely.
✅ Conclusion:
MEME/USDT is displaying strong reversal signals after breaking out of a long-term downtrend and consolidating in a solid accumulation range. If buyer momentum continues, we could see significant upward moves toward key resistance zones.
#MEME #MEMEUSDT #CryptoBreakout #AltcoinAnalysis #BullishReversal #TrendlineBreakout #CryptoTrading #TechnicalAnalysis #AltcoinSeason #ChartPattern #CryptoSignals
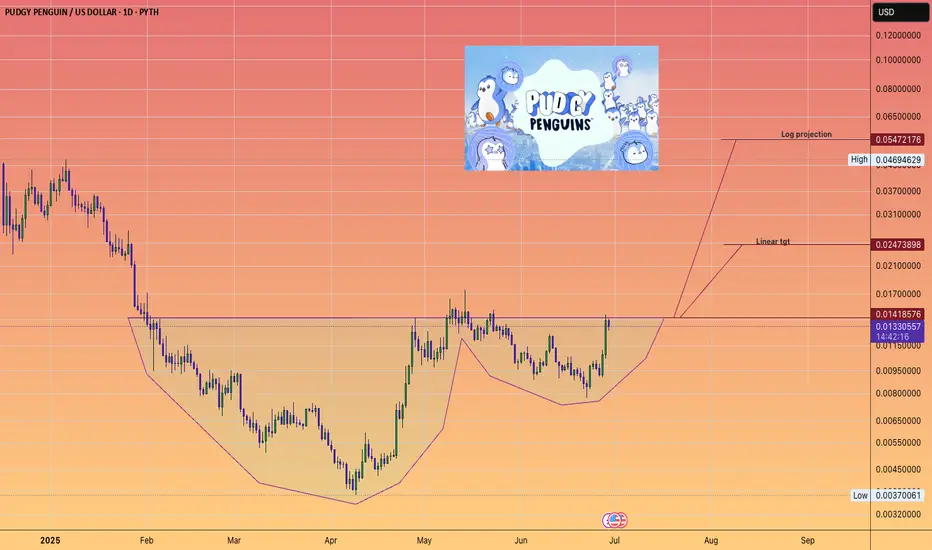
Can Penguins Fly?Pudgy Penguins #Pengu is up nicely already 3.6X from it's april low.
And is sitting nicely outside the top 100 CMC list and is the 8th biggest Memecoin by marketcap.
It appears it is on the cusp of a cup and handle breakout and projects to a very high flying 5 cent log projection.
(#Crypto's are highly speculative and can go down -99%)