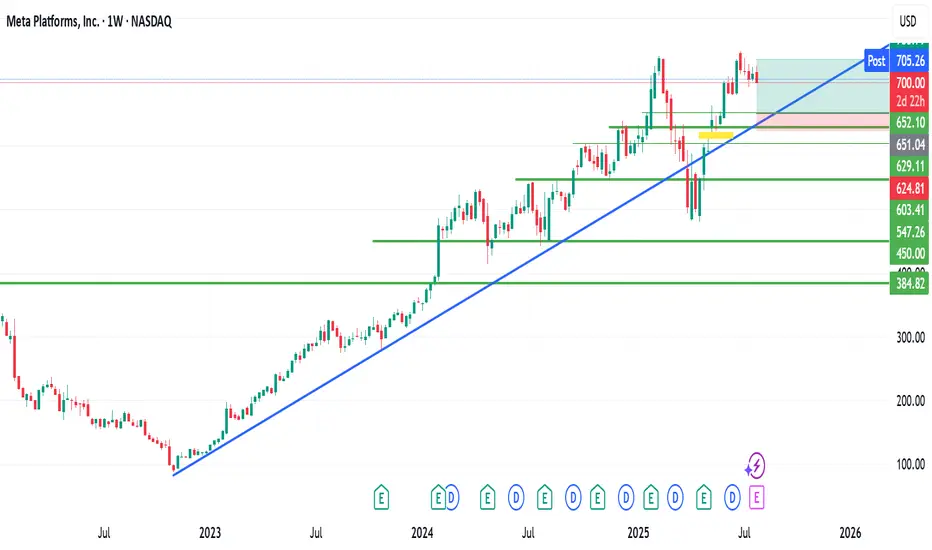
META Double Topping!Does it get any easier than this? NOPE!
If you can't spot this pattern from 1000 miles away, then you need a lot more time in the seat, training yourself in TA.
Simple with great risk reward!
Bulls GTFO!
Meta
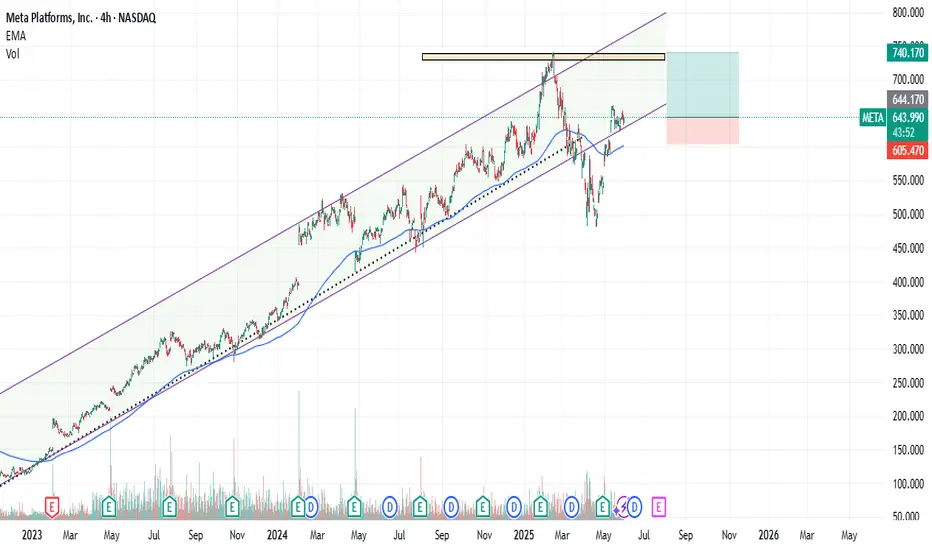
META : Old Peak can be TestedMeta platform has lost altitude from the channel it has formed since 2023, but has gained momentum and re-entered the channel. The possibility of testing the old peak contains a good RR rate.Of course, with a stop-loss close to the 200-period moving average.( Risk/Reward Ratio : 2.48)
Stop-Loss: 605.47
Target : 740.10
APPL/METAHi every one
You should gradually sell Apple and buy Meta.
From now on, I will call this type of analysis inter-market analysis.

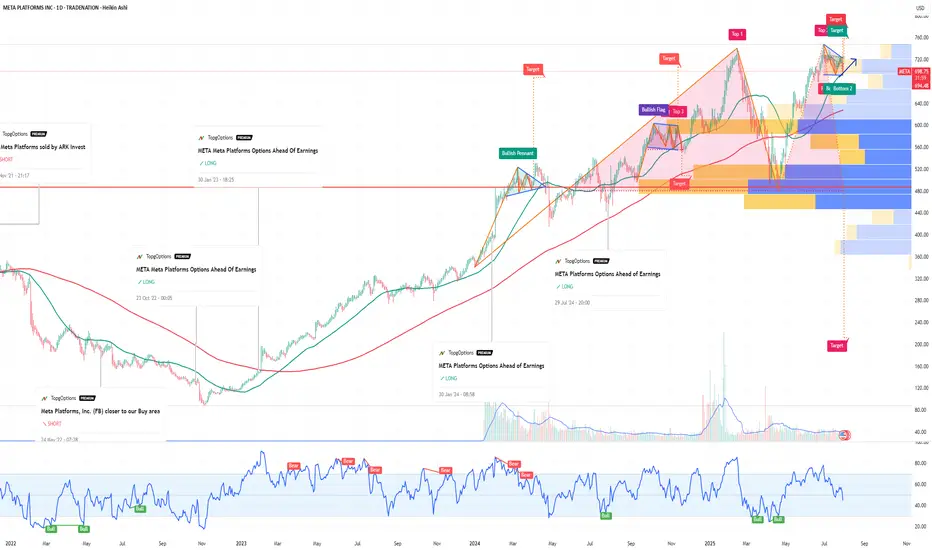
META Meta Platforms Options Ahead Of EarningsIf you haven`t bought META before the rally:
Now analyzing the options chain and the chart patterns of META Platforms prior to the earnings report this week,
I would consider purchasing the 710usd strike price in the money Calls with
an expiration date of 2026-6-18,
for a premium of approximately $89.30.
If these options prove to be profitable prior to the earnings release, I would sell at least half of them.
Disclosure: I am part of Trade Nation's Influencer program and receive a monthly fee for using their TradingView charts in my analysis.
Is this possible with METAIs this possible with META?
META stock is currently trading at $700.
My technical view as shown on the chart, is looking at a possible retracement to around $650.
The question is ''Is this possible?
If it ever gets to this forecasted zone, I will accumulate massively.
Meta - The breakout in question?🪓Meta ( NASDAQ:META ) is retesting major structure:
🔎Analysis summary:
After Meta perfectly retested a major previous support trendline in 2022, the trend shifted bullish. We have been witnessing an incredible rally of about +700% with a current retest of the previous all time highs. Time will tell but a bullish breakout remains quite likely.
📝Levels to watch:
$750
🙏🏻#LONGTERMVISION
Philip - Swing Trader

Stock Market Forecast | TSLA NVDA AAPL AMZN META MSFTStock Market Forecast | CME_MINI:NQ1! CME_MINI:ES1! SPY QQQ
Mag 7 forecast NASDAQ:TSLA NASDAQ:NVDA AAPL AMZN META MSFT GOOG

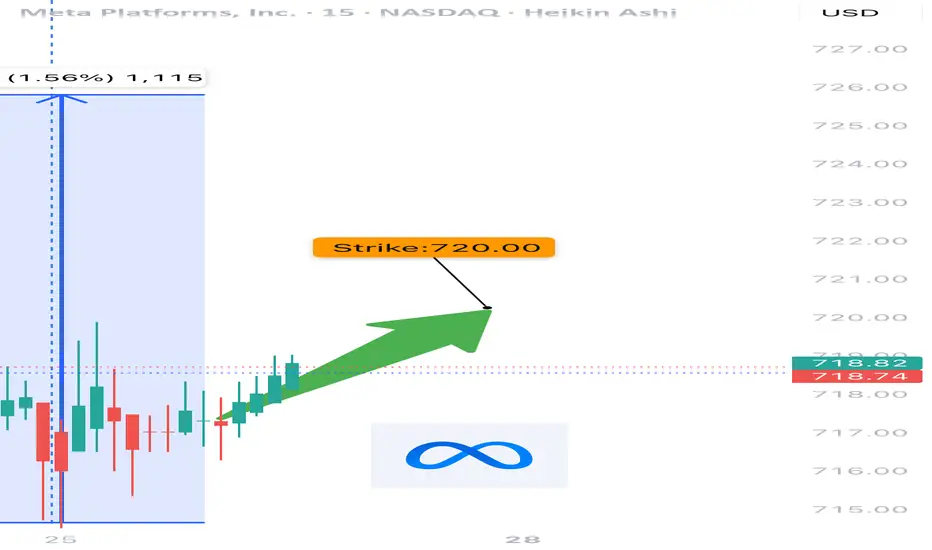
META WEEKLY TRADE SETUP – JULY 25, 2025
📈 META WEEKLY TRADE SETUP – JULY 25, 2025 📈
🔥 Institutional Bulls Are In Control — 3.05 C/P Ratio!
🚨 BUT — It’s 0DTE Friday, so don’t get caught in gamma fire.
⸻
🧠 Model Consensus:
✅ All Models = STRONG BULLISH
⚠️ Entry Timing: Monday preferred (due to gamma + time decay)
📉 Volume still weak = caution on conviction
⸻
🔍 META Flow Stats:
• 🟢 Calls: 65,379
• 🔴 Puts: 21,409
• 📊 C/P Ratio: 3.05 = Institutional bulls stepping in hard
⸻
✅ RECOMMENDED TRADE – PLAN FOR MONDAY
🎯 Instrument: META Call Option
🟢 Strike: $720
📅 Expiry: August 1, 2025
💵 Entry Price: $0.97
💰 Profit Target: $1.45
🛑 Stop Loss: $0.49
⚖️ Confidence: 75%
🕒 Entry Timing: Market open Monday
⸻
⚠️ TRADE NOTES:
• Don’t enter on Friday – too much gamma risk
• Wait for volume confirmation Monday morning
• Expect short-duration swing (hold 3–5 days max)
⸻
📊 Smart money is bullish, timing is everything.
👍 Like & Follow if META is on your radar!
#META #OptionsTrading #0DTE #GammaSqueeze #BullishSetup #TradingView #WeeklyOptions #TechStocks
NASDAQ100 continue its strength due to the strong earning seasonFundamental:
USTEC (NASDAQ100) continues its strength, propelled by robust Alphabet (GOOG) earnings that buoyed technology companies. Cloud services recorded the largest growth at 32% YoY, primarily driven by AI. Concurrently, the company plans to allocate $85 bln to capital expenditure in 2025 for AI, an increase from $75 bln, signaling continued surging demand for AI infrastructure.
In addition, recent US economic data indicated strong consumption and optimism, with the July Services PMI expanding to 55.2 from 52.9 in the previous month. Initial Jobless Claims also fell to 217k, the lowest in 14 weeks, reinforcing optimism regarding the labor market, alongside stronger-than-expected Nonfarm Payrolls from early July.
Inflation data showed a minor impact from tariffs, and tariff negotiations have progressed favorably. Trade deals have been secured with Vietnam, Indonesia, Japan, and the Philippines, and potential trade agreements with the Eurozone and India are anticipated before the deadline.
Major earnings releases are slated for next week, including MSFT, META, and QCOM on July 30. AMZN and APPL's results the following day could provide a clearer picture of USTEC's overall earnings.
Meanwhile, USTEC's forward P/E currently stands at 27x, aligning with its 5-year average despite reaching a new record high, suggesting further upside potential.
Technical:
The index is trading above its EMAs, which are extending, signaling a continuation of the rally.
If USTEC sustains its momentum, the index may reach 24000 upon breaking above the potential resistance at 23400.
Conversely, a pullback near the swing high may suggest a retest of the support at 23000.

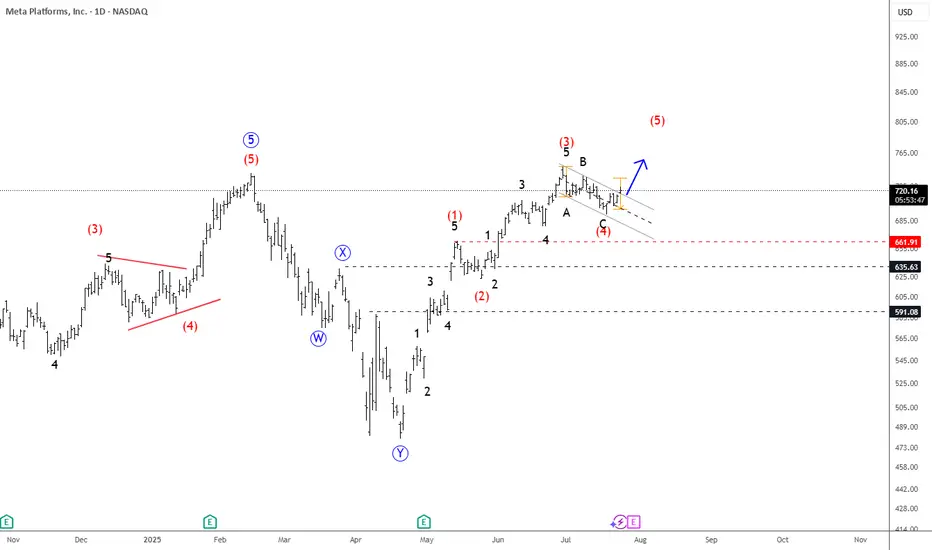
META Slows Down For A Correction Within UptrendMeta has seen a strong recovery recently, but barely retested February highs around 740, from where we can see some nice pullback, but it appears corrective, since it’s unfolding in three waves, and forming a potential bull flag — likely wave 4. A breakout above the downward channel on a daily close could signal the start of wave 5 and a push to new highs.
However, keep a close eye on the 666.1; a break below this level would invalidate the bullish view and suggest a deeper consolidation phase may follow.
Highlights:
Direction: Up (pending breakout)
Structure: Wave 4 bull flag; wave 5 possible soon
Support: 680 / 690
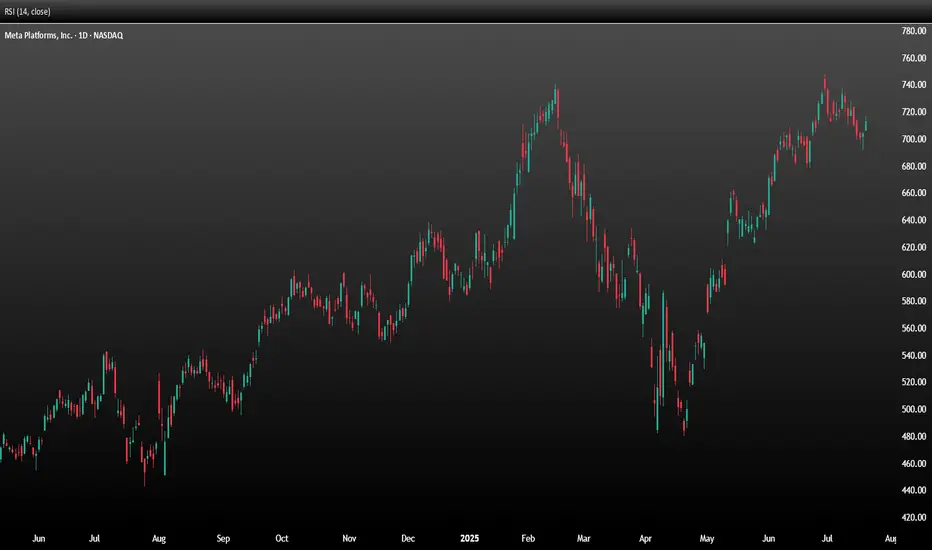
Meta Stock Risks Breakdown Amid Slowing Growth and Rising CostsMeta (NASDAQ: META), the parent company of Facebook, will report second-quarter 2025 results on Wednesday, 30 July, after the close of trading in New York. The social media giant is expected to report that earnings growth slowed to 14.2% to $5.89 per share, as revenue growth decelerated to 14.4%, reaching $44.7 billion. CAPEX is expected to more than double from a year ago, increasing to $17.5 billion from $8.1 billion.
For the third quarter, analysts expect the company to guide revenue to $46.0 billion. CAPEX for full year 2025 is forecast at $64.7 billion. The options market is pricing in a post-earnings move of about 6.5%.
The stock has formed a potential 2B top reversal pattern when it briefly rose on 30 June, closed above the high seen on 14 February, but was unable to maintain it. Now, the stock has fallen below an uptrend that began on 1 May, as well as below technical support at around $705. Meanwhile, the Relative Strength Index has rolled over, suggesting momentum has shifted from bullish to bearish. There is considerable technical support for Meta between $680 and $700 per share, and a move below that support region could lead to the shares falling below $600 over time.
From an option gamma perspective, $700 appears to be the put wall, which also suggests there is solid support around this level. However, the overall call delta values are high, indicating that the options market is very bullish. Therefore, after the company reports, it is possible there could be significant call value decay, leading to the unwinding of hedges and potentially pushing shares below the $700 support region. However, if the stock can hold support at $700, it stands a chance to move higher towards the call wall at $750 and potentially as high as $800.
Written by Michael J. Kramer, founder of Mott Capital Management.
Disclaimer: CMC Markets is an execution-only service provider. The material (whether or not it states any opinions) is for general information purposes only and does not take into account your personal circumstances or objectives. Nothing in this material is (or should be considered to be) financial, investment or other advice on which reliance should be placed.
No opinion given in the material constitutes a recommendation by CMC Markets or the author that any particular investment, security, transaction, or investment strategy is suitable for any specific person. The material has not been prepared in accordance with legal requirements designed to promote the independence of investment research. Although we are not specifically prevented from dealing before providing this material, we do not seek to take advantage of the material prior to its dissemination.
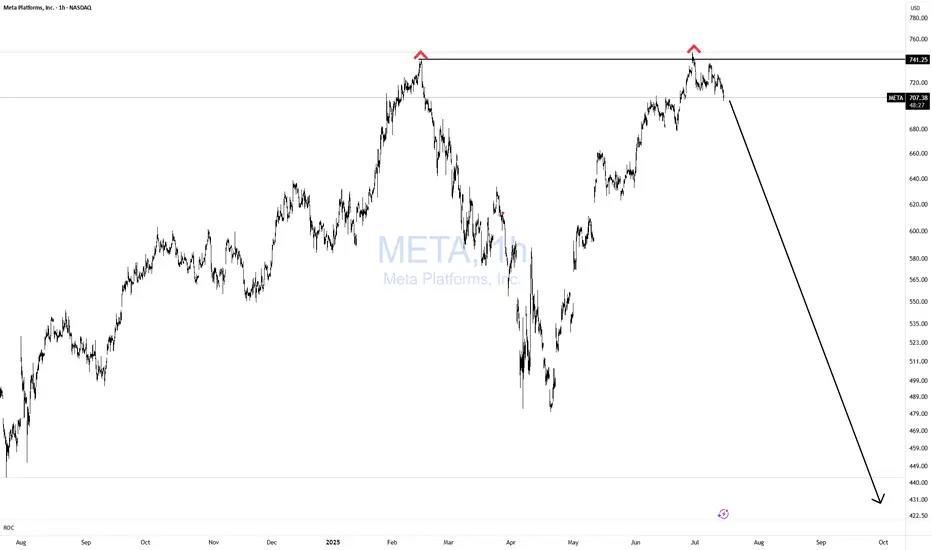
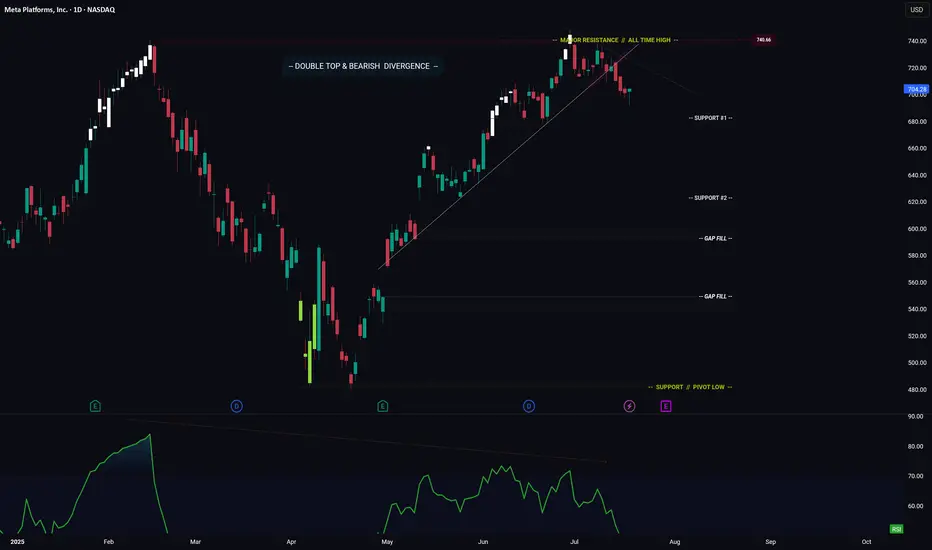
META -- Breakdown? Or Move Higher? Levels To Watch ForHello Traders!
Meta has broken down from its ascending trendline. This is bearish.
In addition price has formed a major Double Top pattern with Bearish Divergence.
Bearish Factors
1) Breakdown of ascending trendline
2) Double top
3) Bearish divergence
Two things need to happen if META is going to make a move higher...
1) Price needs to stay above "Support #1"
2) Price needs to break above the descending trendline (connecting the range highs)
IF price does breaks lower... where do we start looking for long positions?
- Support #2 is a great starting point, however if price makes it to support #2, then I could also see price trading down to fill the gap just below.
- This is where you could enter again to average down your position.
Thanks everyone and best of luck on your trading journey!
Stock Market Forecast | TSLA NVDA AAPL AMZN META MSFTStock Market Forecast | CME_MINI:NQ1! CME_MINI:ES1!
Mag 7 Forecast | NASDAQ:TSLA NASDAQ:NVDA AAPL AMZN META MSFT GOOG

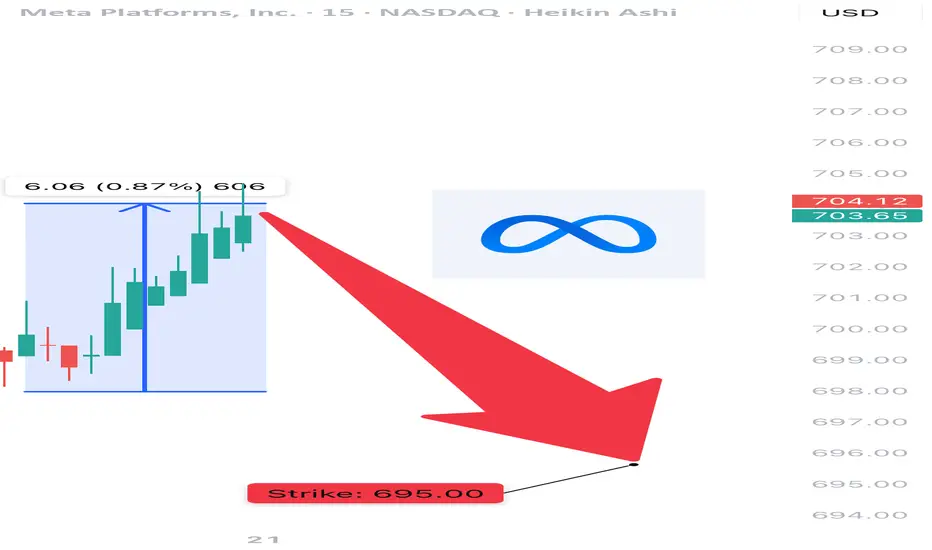
META Bearish Swing Alert – Bear in Hiding? Watch for Breakdown B
🔻 NASDAQ:META Bearish Swing Alert – Bear in Hiding? Watch for Breakdown Below $690 🐻
📅 Posted: July 18, 2025
💡 All models say “bearish,” but volume is the wildcard. Tight play, big potential.
⸻
🧠 AI Consensus Summary: Bearish But Not Triggered
Model Bias Key Notes
Grok 🐻 Bearish RSI 40.5, weak volume, neutral options flow. No clear flow bias.
Claude 🐻 Bearish Same indicators. Recommends conditional entry.
Gemini ⚠️ Bearish Wait Bearish bias but no trigger yet due to low volume.
Llama 🐻 Cautious Bear Trade only if breakdown below $678 with volume.
DeepSeek 🐻 Bearish No bull signals. Neutral options flow confirms low conviction.
⸻
⚙️ Setup Details – META Naked Put
🎯 Strike: $695.00
📅 Expiry: August 1, 2025
💰 Entry Price (Premium): $22.70
💵 Profit Target: $30.00
🛑 Stop Loss: $14.00 (~40% of premium)
📏 Contract Size: 1
📈 Confidence Level: 70%
⏰ Entry Timing: Market open — only if price breaks below $690 with volume confirmation
🕒 Signal Timestamp: 2025-07-18 @ 10:54 AM EDT
⸻
🔍 Why This Works
• ✅ Technical Trend: RSI < 45, negative 5-day/10-day momentum
• 🧊 Options Flow: Flat — no bullish bias = clean downside setup
• 🧨 Trigger Level: Breakdown below $690 = institutional exit confirmed
• ⚠️ Key Caveat: Weak volume = don’t front-run the breakdown
⸻
📌 Levels to Watch
• ⚠️ Breakdown Confirm: Below $690 with volume > 1.25x
• 🧱 Target Zone: $678 support
• ❌ Invalid If: Bounces back over $705 on volume
⸻
🚨 Risk Warning
This isn’t the “all-in” moment — it’s a sniper trade.
No volume = no entry. Tight stop. Fast hands. Smart size.
⸻
📊 TRADE SNAPSHOT
{
"instrument": "META",
"direction": "put",
"strike": 695.0,
"expiry": "2025-08-01",
"confidence": 0.70,
"profit_target": 30.00,
"stop_loss": 14.00,
"size": 1,
"entry_price": 22.70,
"entry_timing": "open",
"signal_publish_time": "2025-07-18 10:53:53 UTC-04:00"
}
⸻
🔁 Follow for more AI-backed trades
💬 Is META breaking down — or faking out?
👀 Drop your entry thoughts in the comments.
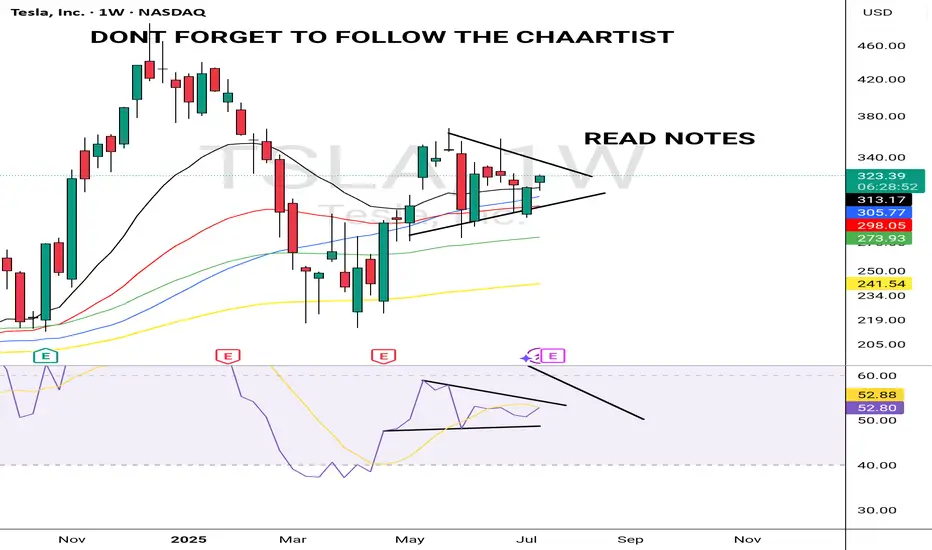
TSLA ULLISH JULY 18 2025Tsla is lloling extremely bullish technically. If it stops me out ,il exit but my my targets from here would be $390.
Always put a SL & decide a target before your entry
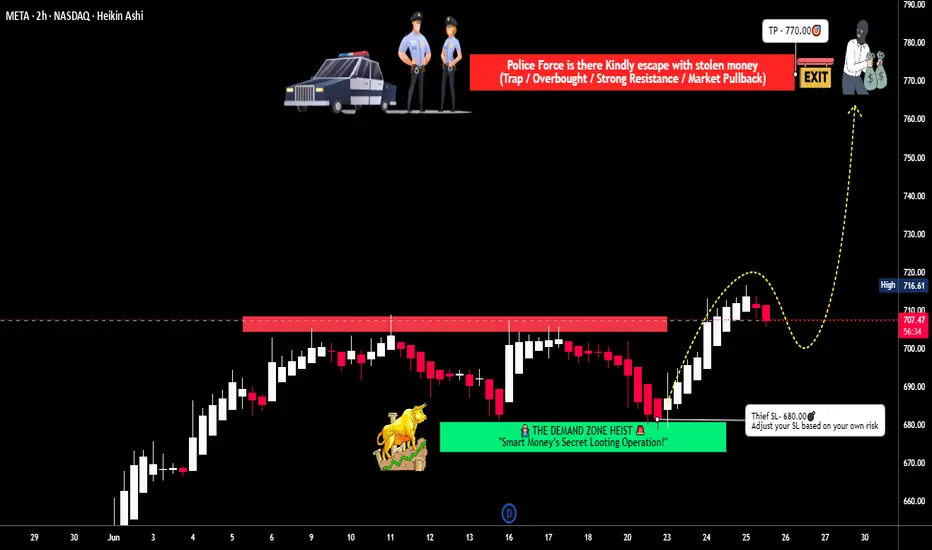
META Platforms Long Setup – Ready for the Next Move?💣 META Masterplan: Bullish Break-In Activated! 💼📈
🌟Hi! Hola! Ola! Bonjour! Hallo!🌟
Dear Money Makers & Silent Strategists, 🤑💰💸✈️
We’ve locked in on our next high-value digital vault: META Platforms Inc.
Built on our signature Thief Trading Style™ — where fundamentals meet stealth technical precision — this is your map to the bullish jackpot.
📍 ENTRY PLAN – Door’s Unlocked!
✅ Enter at any level — this heist is already in motion.
OR
🎯 Set your Buy Limit on a 15m/30m swing low or high — classic pullback infiltration.
🛑 STOP LOSS – Your Exit Route
Before breakout? Hold the line.
After breakout? Drop your SL at the recent 4H swing low – and size it to your risk appetite.
This isn’t luck — it’s calculated theft. 🔐
🎯 TARGET ZONE – Grab & Vanish
🎯 Aim: 770.00
But if the cops (aka sellers) show up early, get out with your loot — no shame in a clean getaway.
“Profit is the win. Perfection is fantasy.”
⚡ SCALPERS' TIPS – Quick In & Out
💵 Big wallet? Enter now.
💳 Tight budget? Follow the swing team.
Either way — longs only, and trailing SL is your safety rope.
📊 WHY META? – Intel Behind the Mission
🔍 This plan is reinforced by:
🔥 Strong Fundamentals
📈 Sentiment Signals
🧠 Quantitative + Macro Flow
💼 COT Data
🌐 Intermarket Correlations
It’s all aligning — the pressure’s building, and the breakout door is creaking open...
🚨 TRADING ALERT – Stay Outta Trouble
💥 Avoid placing new trades during major news drops.
🎯 Use trailing SL to protect and lock profits — your getaway vehicle must be ready.
💖 Support the Heist? Smash Boost!
Fuel the mission — every Boost empowers the crew.
This is Thief Trading Style — we don’t chase, we plan, strike, and vanish with the win. 🏆💪🐱👤
📡 Another breakout mission incoming. Stay hidden. Stay profitable. 🤑🚀
Inevitable Pull Back Coming Soon? | NVDA TSLA AAPL AMZN META MSFStock Market Forecast | CME_MINI:ES1! CME_MINI:NQ1! SPY QQQ
Mag 7 Forecast | NASDAQ:NVDA NASDAQ:TSLA AAPL AMZN META MSFT July 2025 Forecast

Inevitable Pull Back Coming Soon?| NVDA TSLA AAPL AMZN META MSFTStock market Forecast | QQQ SPY CME_MINI:NQ1! CME_MINI:ES1!
Mag 7 FORECAST| NASDAQ:NVDA NASDAQ:TSLA AAPL AMZN META MSFT July 2025 Forecast

BTCUSD| Bitcoin’s Historic Parabolic Pattern🔥 Parabolic Pattern | Institutional COINBASE:BTCUSD Demand Mirrors Gold ETF Era 🔥
COINBASE:BTCUSD vs SP:SPX vs TVC:GOLD
The market is whispering something big — and it's not retail noise this time. For the third straight quarter, listed corporations have outpaced ETFs in Bitcoin purchases, a seismic shift that echoes one key moment in history: the launch of the Gold ETF. Companies like NASDAQ:MSTR contiune to buy and others are following. Will NASDAQ:AAPL NASDAQ:META and NASDAQ:GOOG be next ? Let me know in the comments who you think will be next to buy?
Back then, companies rushed to gold as a hedge against inflation and a store of value as fiat cracks widened. Fast forward to now — we're seeing the same institutional footprints in Bitcoin. The buy-the-dip narrative isn't just alive — it's being driven by corporate balance sheets.
Rumors are circulating that the U.S. government plans to buy 1 million BTC — a move that would shake the global financial system to its core. If true, this isn’t just bullish — it’s historic. The last time governments got this aggressive with a hard asset was during the Gold Reserve buildup. Bitcoin isn’t just digital gold anymore — it’s becoming sovereign-level collateral. 📈💥
💬 Drop your thoughts below. Is this the beginning of the next parabolic era?
In this episode, we break down the parabolic pattern forming on the chart, why it may signal the next explosive leg up, and how history is repeating with BTC playing the role of digital gold.
📊 Technical breakdown. On-chain behavior. Smart money moves.
Don’t blink. Parabolas end in fireworks.
I've been trading for 17 years
👍 If you found this useful, drop a like.
💬 Got questions or thoughts? Leave a comment below — I always respond and happy to help.
👍
Best Regards
MartyBoots

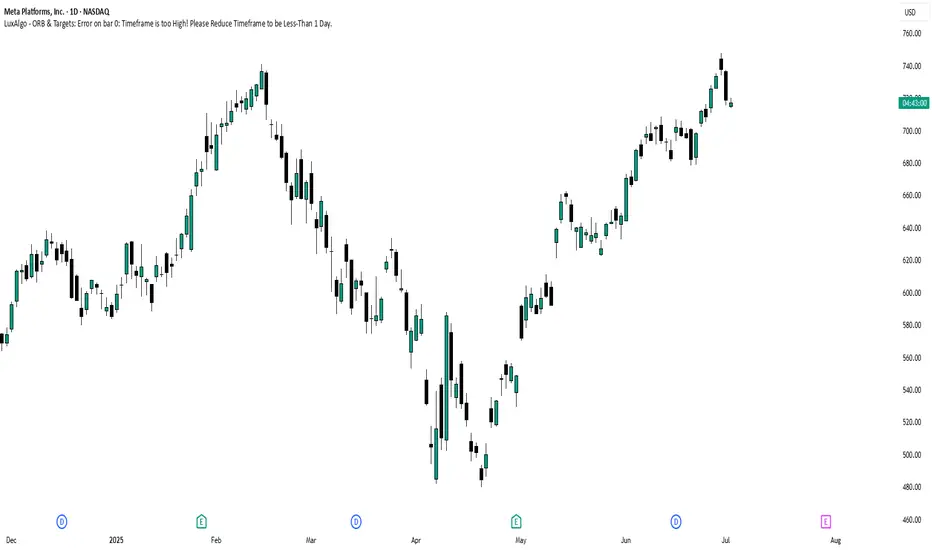
META Shares Signal Major Reversal Risk Amid Potential 2B Top PatThe shares of META, the NASDAQ-listed owner of Facebook, recently reached overbought levels as the stock price rose above its upper Bollinger Band and its Relative Strength Index climbed above 70. This suggests that META is likely to enter a period of sideways consolidation or perhaps experience a sharp decline.
However, traders should also pay close attention to a potentially larger reversal pattern known as a 2B top, which may currently be forming.
A 2B top is similar to a double top pattern, but typically the second high slightly exceeds the prior high before reversing. In this case, the high on 30 June 2025 exceeded the previous high set on 14 February 2025. The stock then fell sharply on 1 July, and if it continues to decline below support at $700, this would confirm the 2B topping reversal pattern.
Additionally, a break below support at $700 would signal the end of the uptrend that began on 1 May and also push the price below the 10-day exponential moving average, further confirming a trend reversal.
A decline below $700 could see the shares fall significantly, potentially erasing much of the gains recorded following the US-China trade negotiations held in Switzerland on May 12.
Notably, a price gap exists at $593, created by the announcement following those talks.
Alternatively, if the stock holds support at $700 and continues the uptrend, the 2b top is invalidated, and traders should look for even higher prices from this AI giant. The nice thing about the 2b topping pattern is that it provides an easy-to-identify invalidation price, which in this case would be above $748.
Written by Michael J. Kramer, founder of Mott Capital Management.
Disclaimer: CMC Markets is an execution-only service provider. The material (whether or not it states any opinions) is for general information purposes only and does not take into account your personal circumstances or objectives. Nothing in this material is (or should be considered to be) financial, investment or other advice on which reliance should be placed.
No opinion given in the material constitutes a recommendation by CMC Markets or the author that any particular investment, security, transaction, or investment strategy is suitable for any specific person. The material has not been prepared in accordance with legal requirements designed to promote the independence of investment research. Although we are not specifically prevented from dealing before providing this material, we do not seek to take advantage of the material prior to its dissemination.
$META Chart updateNASDAQ:META just took out ATHs here's an update on my path tp $750, and possibily higher.

Stock Market Forecast | TSLA NVDA AAPL AMZN META MSFTStock Market Forecast | CME_MINI:NQ1! CME_MINI:ES1! QQQ SPY
Mag 7 Forecast | CBOE:MAGS NASDAQ:TSLA NVDA AAPL AMZN META MSFT

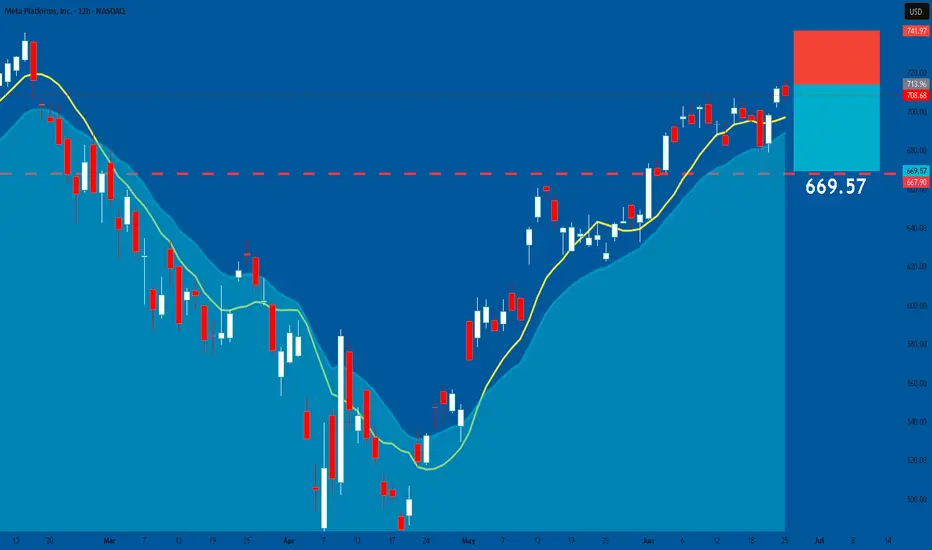
META: Short From Resistance! SELL!
META
- Classic bearish resistance pullback
- Our team expects a move down
SUGGESTED TRADE:
Swing Trade
Sell META
Entry Level - 708.68
Sl - 742.00
Tp - 667.90
Our Risk - 1%
Start protection of your profits from lower levels
Disclosure: I am part of Trade Nation's Influencer program and receive a monthly fee for using their TradingView charts in my analysis.
❤️ Please, support our work with like & comment! ❤️