Gold is rising steadily.Gold technical analysis
Daily chart resistance: 3400, support: 3320
Four-hour chart resistance: 3390, support: 3340
One-hour chart resistance: 3375, support: 3348.
After bottoming out last Thursday, gold began to fluctuate upward on Friday, and the 1-hour bottom structure reappeared, which indicates that a new bullish opportunity has appeared again! It is worth noting that after breaking through 3344 on Friday, it continued to rise to around 3360. Today, after retreating to 3444 in the Asian session, it rose again. 3344 has become the top and bottom conversion position, so we can buy on dips based on the support of 3344. The second is the support at 3331.
In terms of intraday operations, the support below is 3344 and 3331, and it may not fall to around 3344. It is probably waiting to buy in the 3350-55 area. Pay attention to the key resistance around 3377 above. After the 15-minute top pattern appears, sell near this area.
Sell: 3375near
Buy: 3355near
Metals
Gold Nears $3,350 as Tariff Risks PersistGold rose to around $3,350 per ounce on Monday, extending its gains for a second session amid concerns over Trump’s tariff strategy. Commerce Secretary Howard Lutnick said a deal with the EU is likely but confirmed the August 1 tariff deadline. He also suggested smaller countries could face at least a 10% tariff, with some rates reaching 40%. Strong US data last week reduced expectations for an immediate Fed rate cut, capping gold’s gains. Markets now await comments from Fed Chair Powell and Governor Bowman for policy signals.
Gold faces resistance at 3380, with additional barriers at 3400 and 3430. Support levels are positioned at 3330, followed by 3295 and extending down to 3250.

Gold is waiting for a pullback to break through 3400In the short term, gold is stuck in a sideways trend near 3365. It is not recommended to enter this point regardless of long or short positions. It is expected that there will be certain variables in the NY period. If gold retreats and falls in the short term as we expect, it may first touch around 3361. If it falls below 3361, it is expected to touch around 3353, which is also the point I gave this morning to see support.
Judging from the market, our focus on the upper side is still the 3375-3385 resistance area. If it can be effectively broken through, it is expected to hit the 3400-3420 mark. Although the daily MACD is oscillating near the zero axis, the 4H market shows that the oscillation is strong. Our trading strategy remains unchanged in the short term. The pullback in the NY period provides an opportunity, and we can consider going long. If there is new news during the day that requires adjustment, I will notify you immediately. Bros, please be patient and wait for trading opportunities.
OANDA:XAUUSD
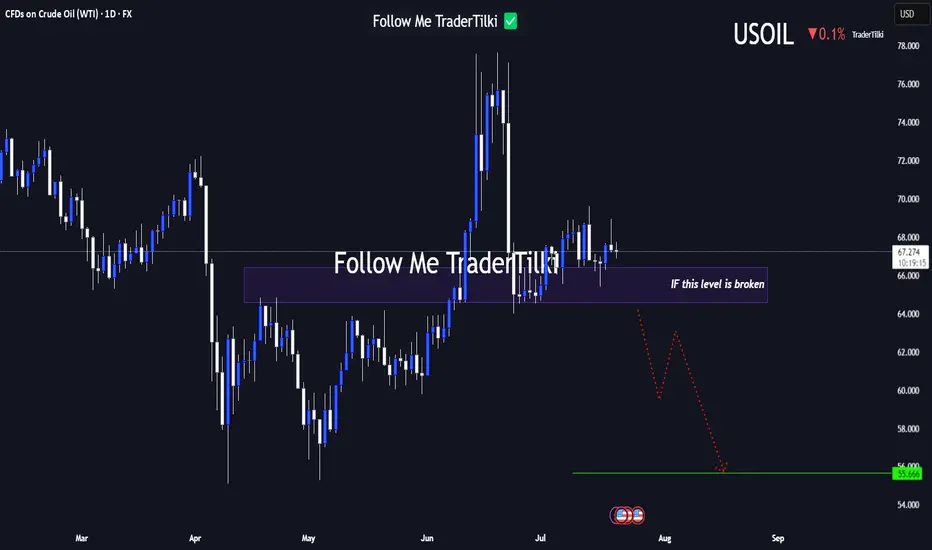
USOIL Under Technical Pressure: 1D Timeframe Breakdown Hey Guys,
The 66.584 level currently stands as the strongest support zone for USOIL. If this level breaks with a candle close, the next major target could drop to 55.666.
This setup is based on the 1-day timeframe. I highly recommend keeping a close watch on that key level.
Every like from you is my biggest motivation to keep sharing these insights. Thanks so much to everyone who’s showing support!
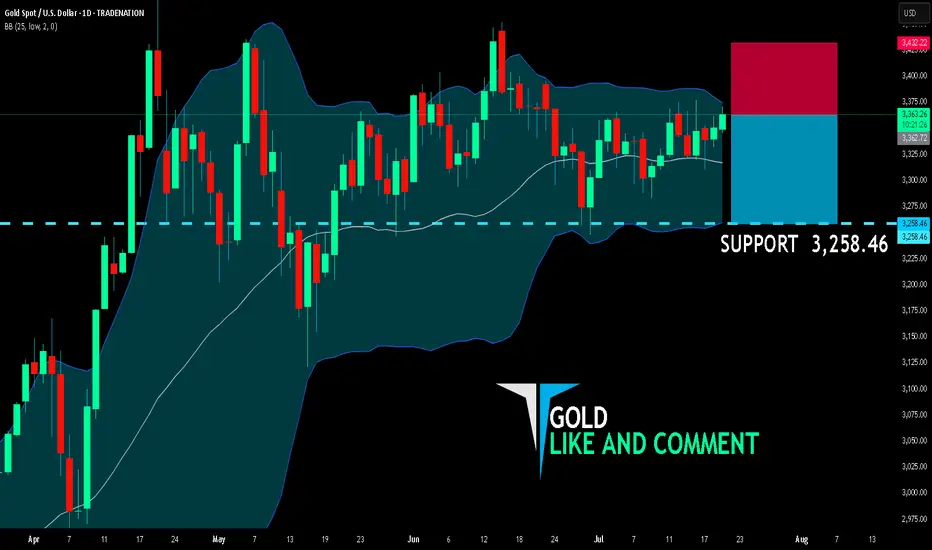
GOLD BEARS ARE GAINING STRENGTH|SHORT
GOLD SIGNAL
Trade Direction: short
Entry Level: 3,362.72
Target Level: 3,258.46
Stop Loss: 3,432.22
RISK PROFILE
Risk level: medium
Suggested risk: 1%
Timeframe: 1D
Disclosure: I am part of Trade Nation's Influencer program and receive a monthly fee for using their TradingView charts in my analysis.
✅LIKE AND COMMENT MY IDEAS✅
GOLD Weekly Recap (Week 29) – MJTrading View📸 Viewing Tip:
🛠️ Some layout elements may shift depending on your screen size.
🔗 View the fixed high-resolution chart here:
Now that you have got the perfect layout let's dive in...
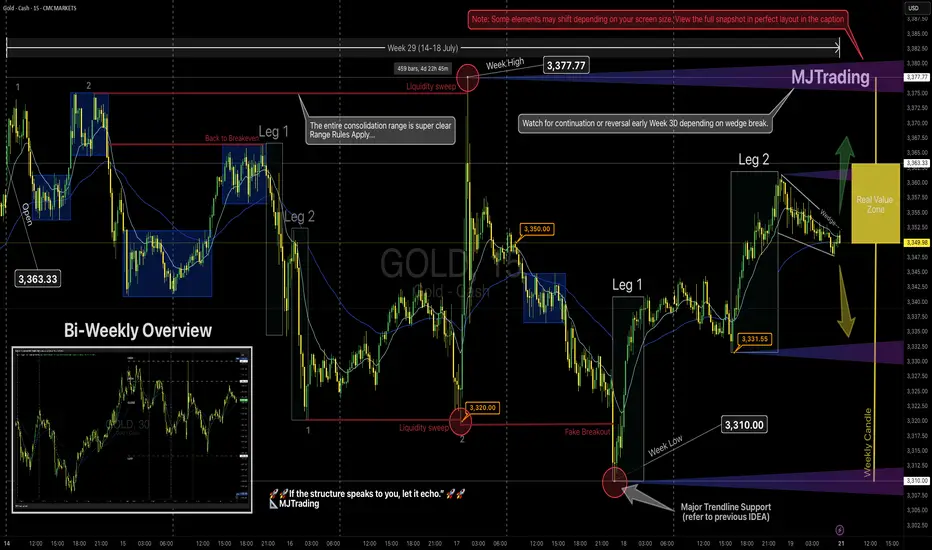
📈 GOLD Weekly Recap (Week 29) – MJTrading View
🕰 Timeframe: 15min chart with bi-weekly perspective
📅 Period Covered: July 14–18 (Week 29)
🎯 Visual Framework: Leg structure, range boundaries, liquidity sweeps, trendline holds, and Real Value Zone.
🔹 Weekly Summary
Open: 3,363.33
High: 3,377.77 (🔴 sweep: trapped buyers)
Low: 3,310.00 (🔴 sweep into key demand + touching the main ascending trendline )
Close: 3,349.98~3350 (lovely round level)
Structure: Entire week played inside a broad consolidation range, with sharp but failed breakouts on both extremes.
Range rules applied: traps, sweeps, compression — everything aligned for responsive trading.
📌 Key Observations
Early Week:
A double-top structure led to rejection from ~3,375 → slid into 3,350.
Price returned to breakeven but then flushed hard toward 3,320 via a clean 2-leg drop.
Midweek:
After forming a double bottom, price created a tiny liquidity sweep, then exploded to the weekly high.
The move above 3,377.77 was a textbook liquidity grab, immediately rejected.
This led to a slide toward the weekly low, tagging both the trendline and consolidation floor — forming a false breakout + reversal.
Late Week:
The low at 3,310 was swept cleanly (🔴), followed by a leg-based reversal:
Leg 1: Up to 3,331
Leg 2: Extended to ~3,360 before fading back inside the range.
Compression:
Price closed inside the Real Value Zone (weekly candle body) — just under the open, forming a tight wedge, hinting at breakout conditions for Week 30.
🟨 Weekly Candle Body
Open → Close of weekly candle reflects Real Value Zone .
Highs and lows were swept, but real commitment stayed within the body.
🧭 Key Levels to Watch – Week 30
Level Role
3,377.77 Weekly High / Liquidity Sweep (🔴 rejection)
3,363.33 Weekly Open (break & hold = bullish bias) / Previous Weekly High
3,350.00 Micro resistance / Mid-structure cap / Round Level
3,331-3 Leg 2 low & first reaction zone / Round Level
3,320.00 Breakdown support / Flush origin
3,310.00 Weekly Low / Major Demand (🔴 sweep)
3,400.00 Next possible main target
3,282.00 Previous Weekly Low
Dynamics: Both Uptrend and Downtrend Lines...
🧠 MJTrading Notes
Bias remains neutral inside the range.
A break & acceptance above 3,363 could trigger a re-test of the sweep zone (3,377+).
A breakdown below 3,331 puts 3,320 → 3,310 back on the map then 3,282.
Don’t force direction — let expansion confirm itself.
🧭 “If the structure speaks to you, let it echo.”
– MJTrading 🚀
#MJTrading #ChartDesigner #GOLD #LiquiditySweep #PriceAction #StructureTrading #Weekly #Chart #Consolidation #2legs
🧠 Psychology always matters:
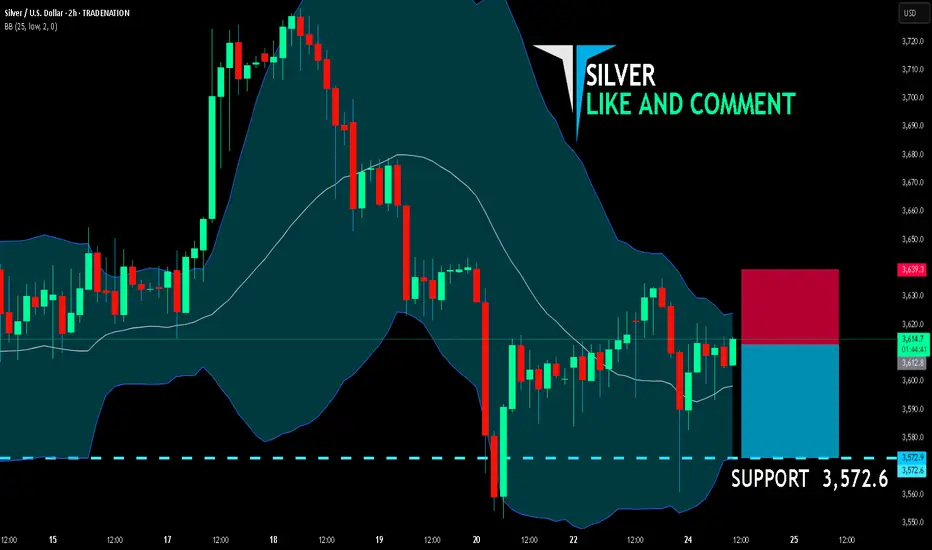
SILVER SELLERS WILL DOMINATE THE MARKET|SHORT
SILVER SIGNAL
Trade Direction: short
Entry Level: 3,612.8
Target Level: 3,572.6
Stop Loss: 3,639.3
RISK PROFILE
Risk level: medium
Suggested risk: 1%
Timeframe: 2h
Disclosure: I am part of Trade Nation's Influencer program and receive a monthly fee for using their TradingView charts in my analysis.
✅LIKE AND COMMENT MY IDEAS✅
XAUUSD ANALYSIS – JULY 18XAUUSD ANALYSIS – JULY 18: STRATEGY BASED ON FIBONACCI, TRENDLINE & STRUCTURE
1. XAUUSD Technical Overview (4H Chart)
Gold (XAUUSD) is currently trading around 3,343 USD, showing signs of a slight rebound from key support. On the 4H timeframe, the price structure is forming higher lows, maintaining above a short-term rising trendline – a technically bullish signal.
2. Key Support & Resistance Zones
Immediate Supports:
3,338 USD: aligning with the 0.618 Fibonacci retracement – a zone tested multiple times.
3,333 – 3,335 USD: strong support, overlapping with EMA and rising trendline.
3,327 USD: previous swing low – last defense for the bullish structure.
Immediate Resistances:
3,345 – 3,346 USD: frequently rejected zone in recent sessions.
3,350 USD: psychological and technical resistance.
3,358 USD: recent swing high – breakout confirmation level.
3. Price Action & Fibonacci Confluence
Price is currently hovering between Fibo 0.5 (3,343 USD) and Fibo 0.618 (3,338 USD) – a potential bounce zone if bullish momentum holds.
The pullback from 3,358 to 3,286 has respected standard Fibonacci retracement levels, confirming technical price behavior.
4. Trendline Analysis
The ascending trendline from the 3,275 USD low remains intact, providing solid dynamic support.
If the price continues to bounce from this trendline, it may form a bullish continuation pattern (flag/pennant).
5. Suggested Trading Strategies
Long
Entry: 3,338 – 3,340 USD
SL: 3,327 USD
TP: 3,345 – 3,350 – 3,358 USD
Note: Buying the dip near Fib & trendline
Short
Entry: Below 3,327 USD (breakdown)
SL: Above 3,340 USD
TP: 3,310 – 3,298 USD
Notes: Only if price breaks trendline & support
6. Supporting Technical Indicators
EMA20/EMA50 show slight upward momentum – early bullish bias.
RSI (14) hovers near 50 – neutral zone, awaiting breakout confirmation.
Conclusion:
Gold is consolidating around a critical support zone. The short-term bias leans bullish if the 3,338 – 3,333 USD region holds and price breaks above 3,346 – 3,350 USD.
This is a key moment to position early using Fibonacci and trendline confluence.
👉 Follow for more strategies in upcoming sessions. Save this if you find it useful!
Do you have a different view? Share your thoughts in the comments below!

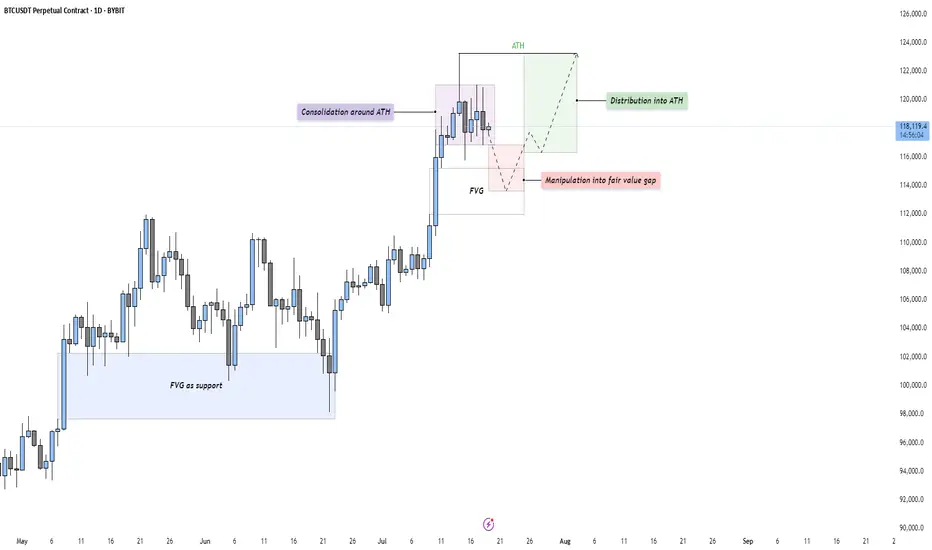
BTC - Consolidation, Manipulation & DistributionMarket Context
After a strong impulsive rally, Bitcoin is currently consolidating just beneath its All-Time High (ATH). This type of consolidation following an extended move higher often indicates indecision in the market — a pause that either leads to continuation or reversal. The current structure suggests that price is building energy for the next leg.
Consolidation and Liquidity Above ATH
The price action is tight and sideways around the ATH, which likely means liquidity is building above. Many stop-losses and breakout orders are sitting just overhead — classic conditions for a Buy Side Liquidity Sweep. This range may serve as a trap for early breakout traders, providing an opportunity for smart money to manipulate price lower before taking it higher.
Fair Value Gap Retest Scenario
Below the current range, we see a Daily Fair Value Gap that aligns with prior bullish imbalances. A move down into this Gap would represent a manipulation phase — shaking out weak longs before rebounding. The Gap also acts as a potential support level where buyers might be waiting. If price reaches into this zone and reacts strongly, it may offer a high-probability long setup.
Distribution or Reaccumulation?
While this could be interpreted as distribution beneath resistance, it’s equally valid to consider it a reaccumulation phase — a temporary markdown into demand before a fresh expansion. If the market dips into the Gap and quickly reclaims the range, it opens the door for a clean breakout above the ATH and continuation toward the 124,000–126,000 region.
Final Thoughts
Price rarely moves in a straight line. It pauses, retraces, and often tricks participants before making the real move. This type of consolidation presents opportunity — but also demands patience and clarity.
If you found this breakdown insightful, a like would be much appreciated! And I’d love to hear your thoughts in the comments — are we about to sweep down into demand, or is the rocket already on the launchpad?
Gold 30Min Engaged ( Bullish Reversal Entry Detected )————-
➕ Objective: Precision Volume Execution
Time Frame: 30-Minute Warfare
Entry Protocol: Only after volume-verified breakout
🩸 Bullish Reversal From : 3341.5 Zone
➗ Hanzo Protocol: Volume-Tiered Entry Authority
➕ Zone Activated: Dynamic market pressure detected.
The level isn’t just price — it’s a memory of where they moved size.
Volume is rising beneath the surface — not noise, but preparation.
🔥 Tactical Note:
We wait for the energy signature — when volume betrays intention.
The trap gets set. The weak follow. We execute.

DeGRAM | GOLD above the resistance level📊 Technical Analysis
● Bulls defended the channel base at 3 333, snapping the intraday falling wedge and reclaiming the broken trend-line; successive higher-lows since 17 Jul signal fresh upside momentum.
● A clean H1 close over the former pivot 3 355 flips the wedge crest into support and activates the measured-move target at the upper horizontal barrier 3 366, with the March swing cap 3 389 next.
💡 Fundamental Analysis
● Softer US jobless-claims trend and Fed speakers’ hints that “policy is restrictive enough” cooled two-year real yields, while PBoC’s June data showed net gold purchases for a fourth month—both underpinning spot demand.
✨ Summary
Long 3 345-3 355; hold above 3 355 targets 3 366 → 3 389. Bias void on an H1 close beneath 3 333.
-------------------
Share your opinion in the comments and support the idea with a like. Thanks for your support!

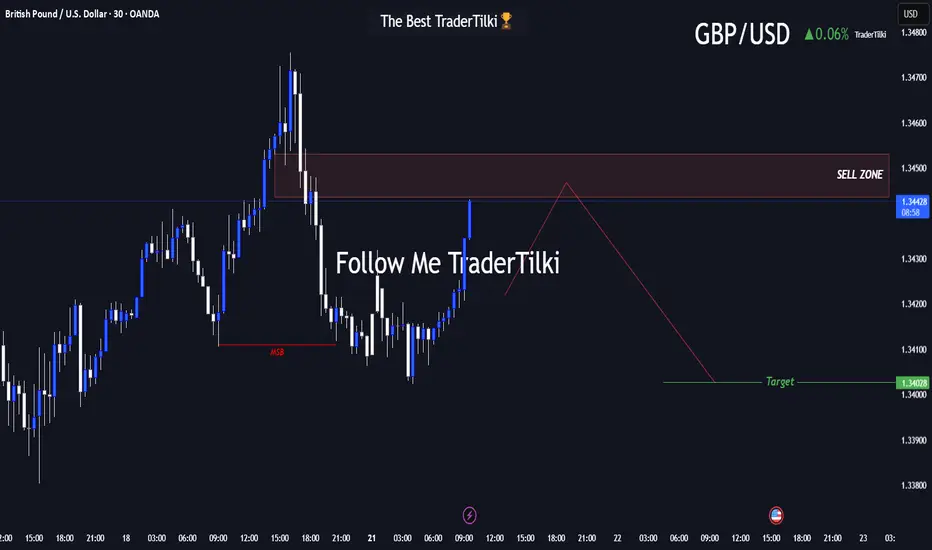
Major Levels Ahead: GBPUSD Trade Setup UnveiledHey friends, I’ve prepared a fresh GBPUSD analysis for you!
📍 Target level: 1.34028
🔻 SELL zone: Between 1.34532 and 1.34437
I expect the trade to reach its target during the London or New York session.
Every like and show of support fuels my motivation to share more analysis—thank you all for being part of this journey!
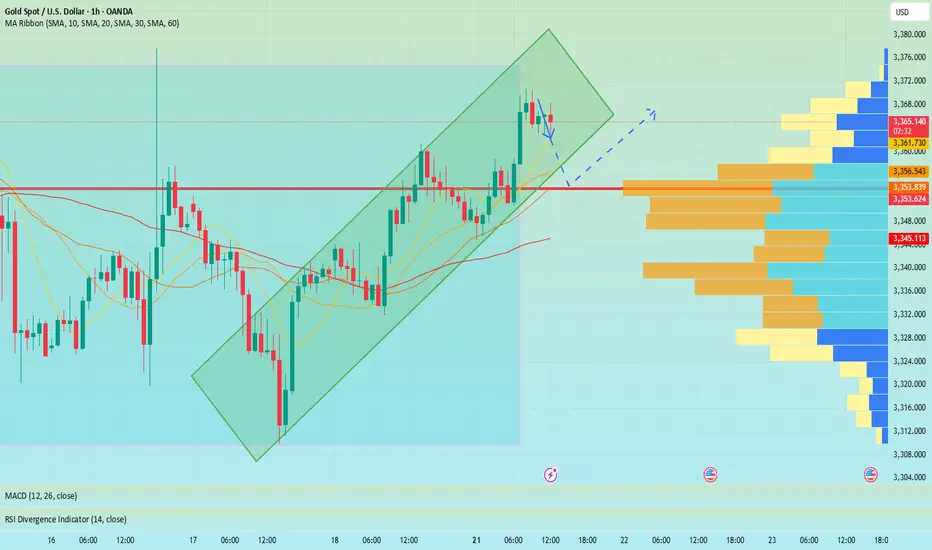
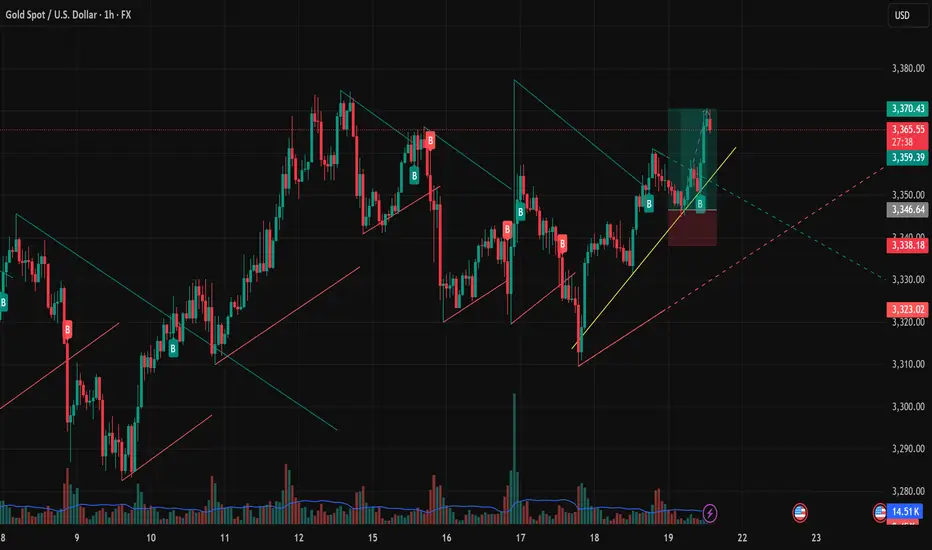
XAUUSD 21/07 - Will the Bullish Momentum Continue?In today’s session (July 21), the 1H chart of XAUUSD shows a confirmed breakout above the medium-term descending trendline. The bullish momentum originated from a strong rebound at the confluence zone of support, EMA, and ascending trendline — suggesting a high-probability continuation setup for the short term.
Technical Analysis Overview:
🔹 Price Action Structure:
Price broke out of a falling wedge / descending triangle with a strong bullish Marubozu candle, confirming the breakout move.
Breakout was supported by increased volume, indicating strong institutional buying near 3,346–3,350.
🔹 Trendlines and EMA Outlook:
Price is currently holding above the ascending yellow trendline.
Short-term EMAs (e.g., EMA20/50, not shown) are likely sloping upwards and sitting below price, confirming bullish market structure.
🔹 Key Support and Resistance Levels:
Immediate Resistance: 3,370 USD – recently tested previous swing high.
Major Resistance: 3,378 – 3,385 USD – Fibonacci projection and previous supply zone.
Short-term Support: 3,359 USD – minor pullback zone and EMA alignment.
Major Support: 3,346 USD – the breakout retest zone and price structure support.
Suggested Trading Strategies:
Scenario 1: Buy the Dip
Entry: Near 3,359 – 3,346 USD (on minor retracement)
Stop Loss: Below 3,338 USD (to invalidate the breakout zone)
Target 1: 3,370 USD
Target 2: 3,378 – 3,385 USD
Scenario 2: Breakout Continuation Buy
If price breaks above 3,370 with strong candle + volume:
Entry: Around 3,372 – 3,374 USD
Stop Loss: 3,359 USD
Target: 3,385 – 3,392 USD
Additional Indicators to Watch:
RSI (not shown): If approaching 70+, watch for bearish divergence or exhaustion signals.
Volume: Sustained or increasing volume will confirm strength of the uptrend.
Conclusion:
XAUUSD is showing strong bullish technical signals after breaking the descending trendline and successfully retesting the breakout level. As long as price holds above 3,346 – 3,350, the short-term bullish structure remains intact.
- Follow for more high-quality trading strategies and daily gold analysis. Save this idea if you find it useful for your trading setup!
What’s your view on this analysis? Let’s discuss more in the comments below!
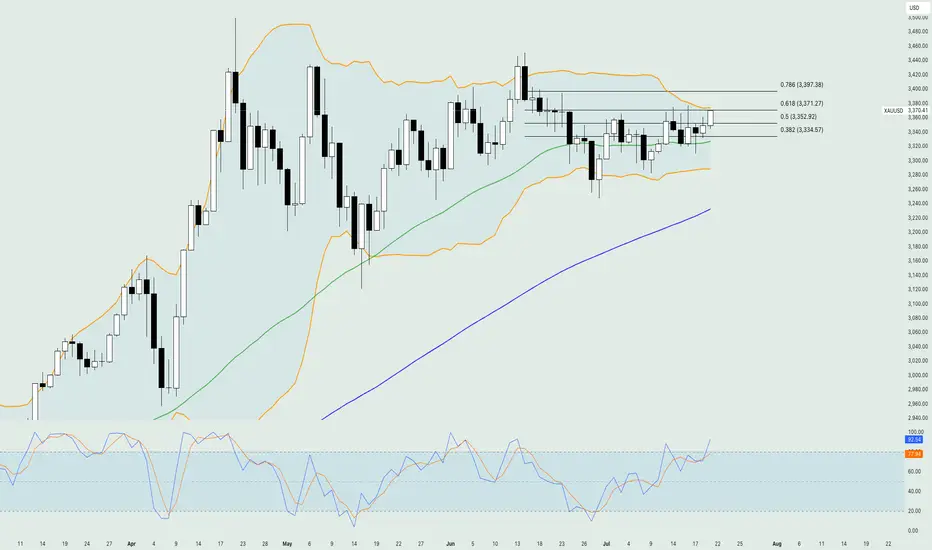
Gold - DAILY- 21.07.2025Gold held steady near $3,350 an ounce as markets opened Monday, with traders assessing mixed signals from Federal Reserve officials on the inflation impact of Trump’s tariff plans. Some Fed governors, like Waller and Bowman, signaled openness to rate cuts, while others remain cautious due to inflation risks. Trump continues pressuring the Fed to lower rates, with speculation about replacing Chair Jerome Powell. Meanwhile, EU officials are preparing for potential trade fallout as Trump’s Aug. 1 tariff deadline approaches. Gold is up over 25% this year, driven by geopolitical tensions and demand for safe-haven assets.
From a technical point of view, the price of gold found sufficient support on the 38.2% of the weekly Fibonacci retracement level and is currently testing the resistance on the 50% around $3,355. The moving averages are confirming the overall bullish trend in the market, while at the same time, the Stochastic oscillator is near the extreme overbought level, hinting at a potential bearish correction move in the upcoming sessions. The Bollinger bands are quite expanded, showing that volatility is there to support any short-term move to either side, while the level around $3,380 is the first major technical resistance area consisting of the upper band of the Bollinger bands and the 61.% of the weekly Fibonacci retracement level.
Disclaimer: The opinions in this article are personal to the writer and do not reflect those of Exness
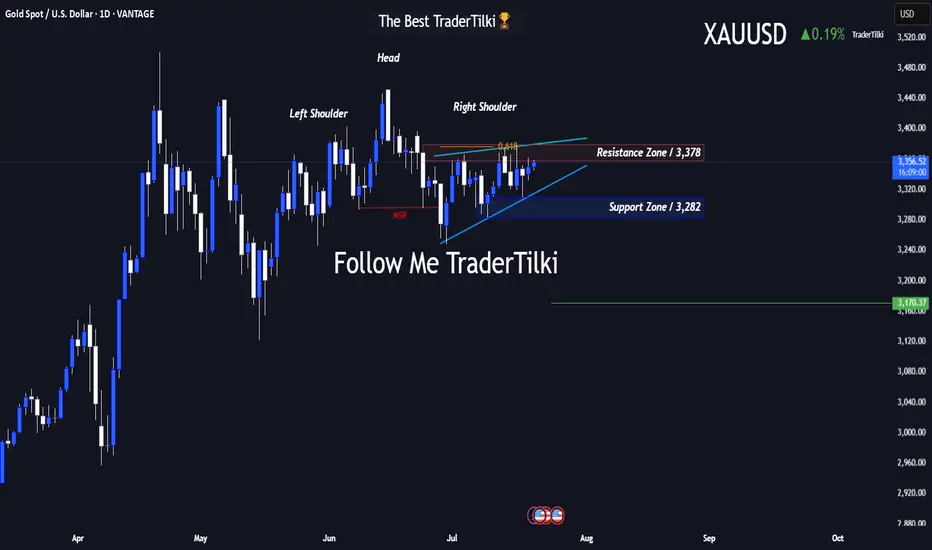
GOLD-XAUUSD vs. The FED: Technicals or Fundamentals?Good Morning Traders,
Let’s break down what gold is showing us on the 1-day chart:
- **Resistance:** 3,378
- **Support:** 3,282
- There’s a noticeable **head and shoulders pattern** on the chart. Under normal conditions, gold’s target sits at **3,170**.
Gold is highly sensitive to fundamental factors. Sudden war news or events like last week’s rumors about Trump firing the Fed Chair can trigger serious volatility.
That’s why I always combine **technical and fundamental analysis** in my approach.
For gold to reach the 3,170 target, the **3,282 support level must first be broken**. Since that hasn't happened yet, we can't confirm a bearish move—fundamentals play a key role here.
Keep in mind: this is a **swing trade** setup based on a 1-day chart. Reaching the target could take time.
I want to sincerely thank everyone who’s been supporting my analyses with likes—your support is
my biggest source of motivation when it comes to sharing content.
Much love and respect to you all.💛
Gold (XAU/USD) Technical Outlook — 21 July 20251. Market Overview & Live Price Confirmation
Gold is currently trading around $3,354, with a daily range of approximately $3,345–$3,359. This places it firmly within its broader uptrend, showing resilience amid recent macro uncertainties and consolidating its position above key support zones.
2. Four-Hour Technical Breakdown
Trend & Structure
The 4-hour chart reveals a strong bullish structure, marked by consistent higher highs and lows. A recent Break of Structure occurred near $3,324, reinforcing the upward bias. A minor Change of Character around $3,360–$3,358 reflects a healthy retracement, but the bigger picture remains strong.
Key SMC & ICT Zones
Supply Zone: $3,360–$3,362 — recent peak area likely to attract sellers and sweep above liquidity.
Demand Zone: $3,340–$3,344 — aligns perfectly with the 38.2% Fib from the $3,308–$3,362 swing, forming a prime area to buy from.
Order Block / FVG Zone: $3,336–$3,342 — open imbalance suggesting price may revisit for efficient entry.
Liquidity Context: Order flow patterns indicate stop hunts around established zones — part of classic Smart Money Concepts.
Fibonacci Levels
38.2% retrace at $3,340, offering medium-term confluence support.
Upside projections via Fibonacci:
1.272 extension: $3,378
1.618 extension: $3,389
3. One-Hour Intraday Trading Setups
Aligned with the 4-hour bullish bias, these setups offer scalable, structured entry opportunities.
Strategy Entry Zone Stop-Loss Take-Profit Risk:Reward
Aggressive Long $3,344 $3,338 $3,358 → $3,362 ~2:1
Conservative Long $3,340 $3,330 $3,362 → $3,378 ~2.5:1
Short Opportunity Rejection @ $3,362 $3,368 $3,344 ~2:1
🌟 The Golden Setup
Buy within $3,340–$3,344 (4H demand + Fib zone + FVG)
Stop-Loss: $3,330
Take-Profit 1: $3,362 (range high)
Take-Profit 2: $3,378 (Fib 1.272)
Why It Works: A confluence of structural support, liquidity zones, and retracement levels gives this setup high predictive quality.
4. Analyst Consensus Snapshot
Market commentary from professional analysts shows alignment with dip-buy strategies. Most recognize the $3,340 region as key support and express caution entering $3,360–$3,375 resistance. Weekly forecasts describe tight trading with potential for breakouts or retracements depending on economic data and Fed commentary, but the medium-term trend remains bullish.
5. Summary & Trading Blueprint
Price Range: $3,345–$3,359 (daily); $3,338–$3,378 (targets)
4-Hour Bias: Bullish, with defined demand and supply zones
Golden Trade: Buy $3,340–3,344 → SL $3,330 → TP1 $3,362 / TP2 $3,378
Catalysts to Watch: Federal Reserve speech, tariff developments, USD movements.
6. Final Thoughts
Gold continues to demonstrate bullish resilience, supported by both technical structure and macro tailwinds. The $3,340–3,344 zone offers a clear, high-probability entry confluence, while stop placement and profit targets are well-defined. Profit management around $3,360 ensures disciplined scaling or early exits if risk factors emerge.
By blending price action, Smart Money frameworks, ICT concepts, and Fibonacci confluence—all structured into actionable trade setups—you have a professional-grade playbook ready for deployment.

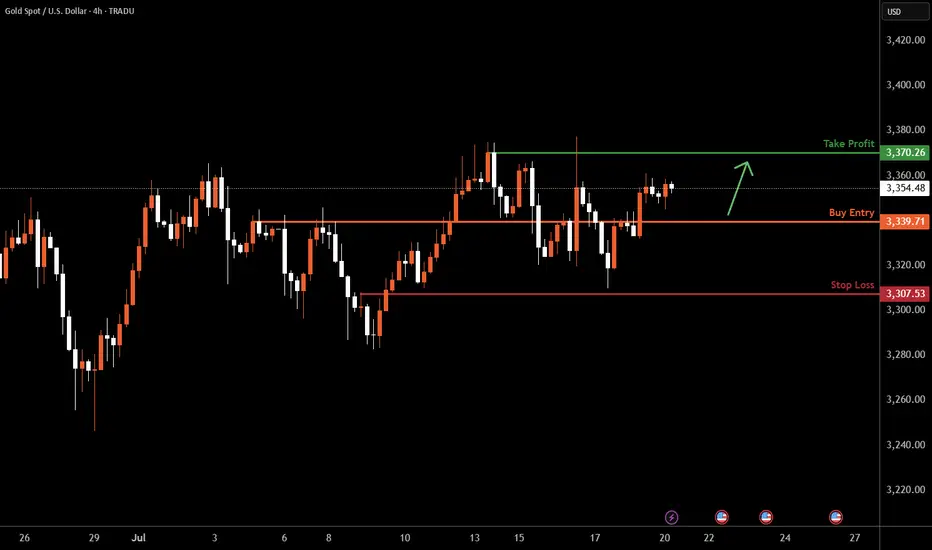
XAUUSD H4 I Bullish Bounce Off Based on the H4 chart analysis, the price is falling toward our buy entry level at 3339.71, a pullback support.
Our take profit is set at 3370.26, a swing high resistance.
The stop loss is placed at 3307.53, a pullback support.
High Risk Investment Warning
Trading Forex/CFDs on margin carries a high level of risk and may not be suitable for all investors. Leverage can work against you.
Stratos Markets Limited (tradu.com ):
CFDs are complex instruments and come with a high risk of losing money rapidly due to leverage. 66% of retail investor accounts lose money when trading CFDs with this provider. You should consider whether you understand how CFDs work and whether you can afford to take the high risk of losing your money.
Stratos Europe Ltd (tradu.com ):
CFDs are complex instruments and come with a high risk of losing money rapidly due to leverage. 66% of retail investor accounts lose money when trading CFDs with this provider. You should consider whether you understand how CFDs work and whether you can afford to take the high risk of losing your money.
Stratos Global LLC (tradu.com ):
Losses can exceed deposits.
Please be advised that the information presented on TradingView is provided to Tradu (‘Company’, ‘we’) by a third-party provider (‘TFA Global Pte Ltd’). Please be reminded that you are solely responsible for the trading decisions on your account. There is a very high degree of risk involved in trading. Any information and/or content is intended entirely for research, educational and informational purposes only and does not constitute investment or consultation advice or investment strategy. The information is not tailored to the investment needs of any specific person and therefore does not involve a consideration of any of the investment objectives, financial situation or needs of any viewer that may receive it. Kindly also note that past performance is not a reliable indicator of future results. Actual results may differ materially from those anticipated in forward-looking or past performance statements. We assume no liability as to the accuracy or completeness of any of the information and/or content provided herein and the Company cannot be held responsible for any omission, mistake nor for any loss or damage including without limitation to any loss of profit which may arise from reliance on any information supplied by TFA Global Pte Ltd.
The speaker(s) is neither an employee, agent nor representative of Tradu and is therefore acting independently. The opinions given are their own, constitute general market commentary, and do not constitute the opinion or advice of Tradu or any form of personal or investment advice. Tradu neither endorses nor guarantees offerings of third-party speakers, nor is Tradu responsible for the content, veracity or opinions of third-party speakers, presenters or participants.
Gold will make a Low for the Week before Pushing BullishOn my previous Update I mention that we should have support off this H4 Gap. My problem with it s it immediately reacted to it when the market opened back up. well before the killzone. So I feel like this is a fake out to go short for now. they will make a low for the week then we will see it set up for the bullish move.

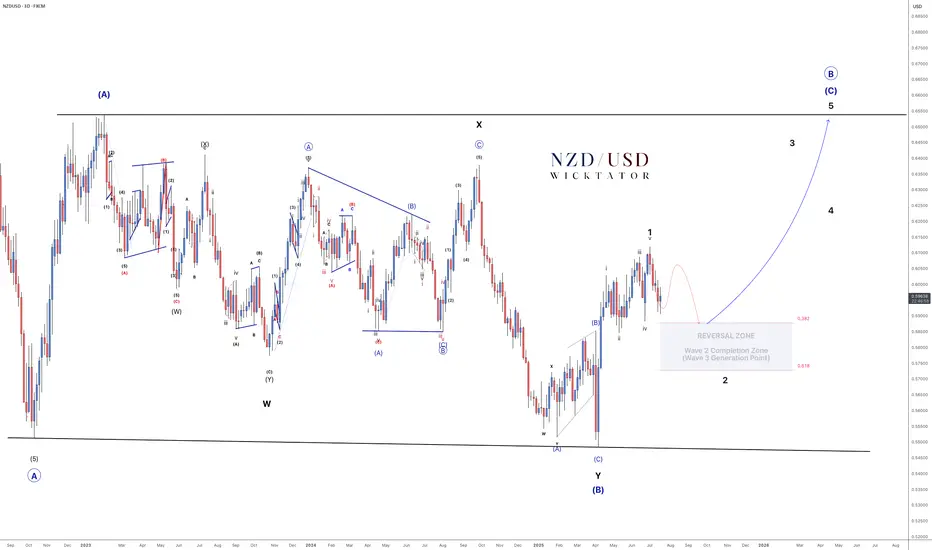
NZDUSD - Elliott Wave: High-Probability Reversal Zone Ahead!NZDUSD – Elliott Wave Roadmap
3Day Chart
Every move has been unfolding with precision — true to Elliott Wave Theory.
We're in the final leg of a massive A-B-C correction:
- Wave A and the complex Wave B (WXY) are complete.
- Wave C is now in play, targeting the highs of Wave A.
We’ve just seen a clean 5-wave advance (wave 1 leading diagonal).
Now expecting a classic ABC correction for wave 2, into our reversal zone (38.2–61.8% Fib).
🔍 Once price enters this zone, we’ll drop to lower timeframes and:
- Look for bullish confirmations (BOS, trendline break)
- Set entries with stops below corrective lows
- Targets: 0.63 (500 pips) and 0.65 (700 pips)
📌 Why is the buy zone so big?
It’s a higher timeframe zone. Once price enters, we zoom into lower timeframes for precise entries. The zone simply tells us when to focus, not where to blindly buy.
This is the Wave 3 generation point — and that’s where the real move begins.
Plan your trade. Watch for the setup. Execute with confidence.
Goodluck and as always, Trade Safe!
NZDUSD 12H Chart - Looking for this ABC correction for wave 2
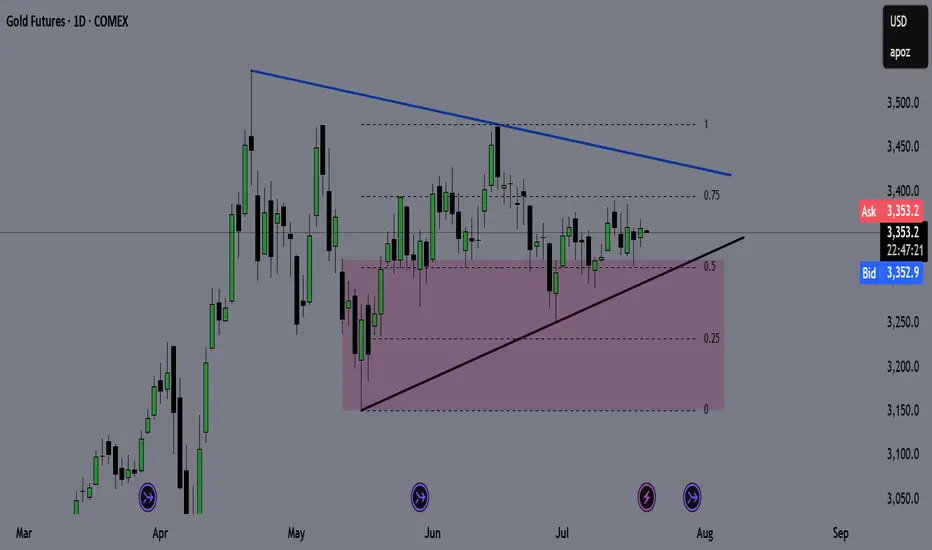
GOLD (GC) Weekly Recap & Game Plan 20/07/2025🪙 GOLD (GC) Weekly Recap & Game Plan
📊 Market Context:
Price is currently forming an accumulation pattern.
The purple zone marks a key weekly demand zone, and I expect a potential bounce from that level.
I'm closely watching for trendline deviations to determine the directional bias.
🎯 Game Plan:
If price drops below the trendline and bounces from the weekly demand, I’ll look for longs targeting the bearish trendline.
If price taps the bearish trendline and shows clear rejection, I’ll look for shorts targeting the bullish trendline.
I'll wait for LTF confirmations before entering any position.
✅ Follow for weekly recaps & actionable game plans.
Gold. - Bullish (structure still valid) • Daily: Maintaining higher lows along the trendline. Strong support at 3,300.
• 4H: Still respecting the diagonal, and showing strength despite short-term pullbacks.
• 1H: Breakout from descending trendline and now retesting the breakout zone at 3,350.
⚠️ Watch For:
• Clean bullish break above 3,365 confirms new impulse wave toward 3,400+.
• Support at 3,335 must hold to avoid flipping neutral.
• Patience required if price consolidates between 3,340–3,360.

Natural Gas | Oil | Dollar | Silver | Gold Price Forecast.Natural Gas | Oil | Dollar | Silver | Gold Price Forecast.
NYMEX:NG1! AMEX:UNG NYMEX:CL1! COMEX:GC1!

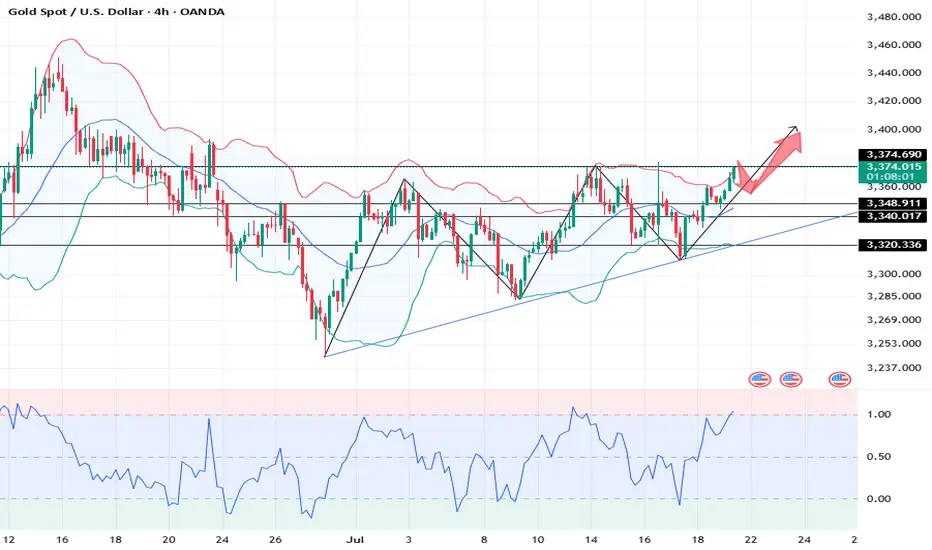
XAUUSD 4Hour TF - July 20th, 2025XAUUSD 7/20/2025
XAUUSD 4 hour Long Idea
Monthly - Bullish
Weekly - Bullish
Daily - Bullish
4hour - Bullish
GOLD,GOLD,GOLD. This thing has been bullish on all timeframes and doesn’t really show any signs of stopping just yet.
We can see two scenarios for the week ahead so let’s dive in:
Bullish continuation - Price action on gold is breaking out of a descending triangle pattern. This is a strong bullish move but for us to consider trades we want the confirmation.
Look for a retest of our 61.8% fib level and mostly recently broken structure. If we can spot bullish conviction coming off this level we can then consider targeting higher resistance levels like 3.395.000. Our -27% fib level lines up with this zone as well.
Bearish Reversal - For us to consider Gold bearish again we would need to see something very convincing. If we did see a break below 3,320.000 with a confirmed lower high I would then consider short scenarios.
Look to target toward major support levels on the way down to 3,225.000, our next monthly support zone.
