Gold prices fall in the short term – What's next?Hello everyone, what’s your take on gold?
Today, gold continues to attract short-term selling pressure as USD buying momentum returns and expectations for Fed rate cuts diminish. On the other hand, an overall positive risk sentiment is also seen as another factor weighing on the precious metal.
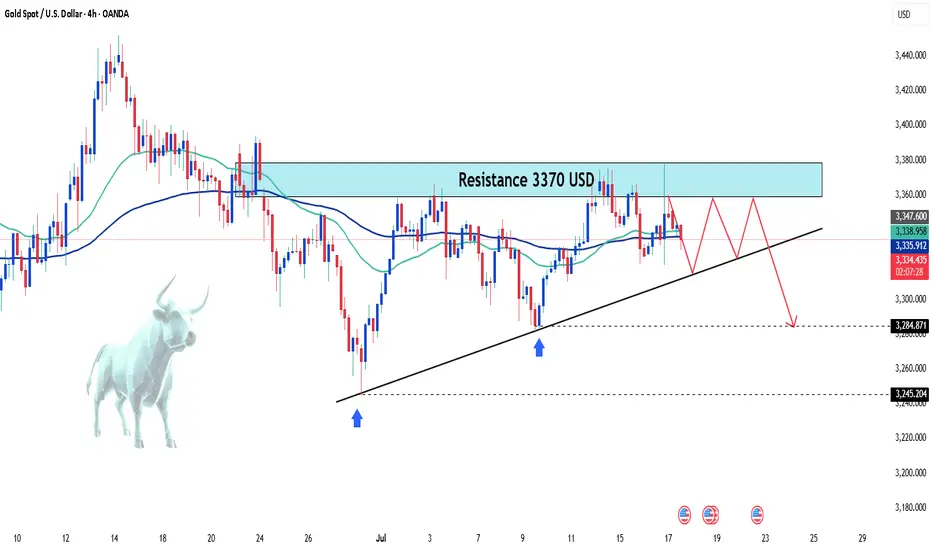
At the time of writing, gold is trading around the EMA 34 and 89 near 3,336 USD. With no major updates expected, the market is likely to remain steady throughout the day.
From a technical perspective, the bearish trend persists, with prices capped below the trendline. A series of lower highs and lower lows could push XAUUSD to retest deeper levels, potentially reaching the 3,300 USD mark. However, lingering trade uncertainties may limit losses for this safe-haven asset.
This is just my view on the market, not financial advice.
Metals

Gold's Short-Term Decline: What's Next?Hello everyone, what do you think about gold?
Today, gold continues its short-term downtrend. After new data was released at the end of yesterday’s trading session, the USD rose by 0.3%, and U.S. Treasury yields also increased, reducing the appeal of gold. Additionally, the latest unemployment claims data shows improvement in the U.S. economy, which has contributed to the drop in the precious metal.
As of writing, gold is trading around the EMA 34, 89 levels at 3,336 USD. With the recent news, the market is expected to maintain its current stance throughout the day, as no new significant updates are expected.
From a technical standpoint, the downtrend remains in place, with prices continuing to be capped below the trendline. The series of lower highs and lows could likely lead XAUUSD to test lower levels, with the possibility of reaching the 3,300 USD mark.
What do you think about the price of gold today? Let us know in the comments!

GOLD SELLERS WILL DOMINATE THE MARKET|SHORT
GOLD SIGNAL
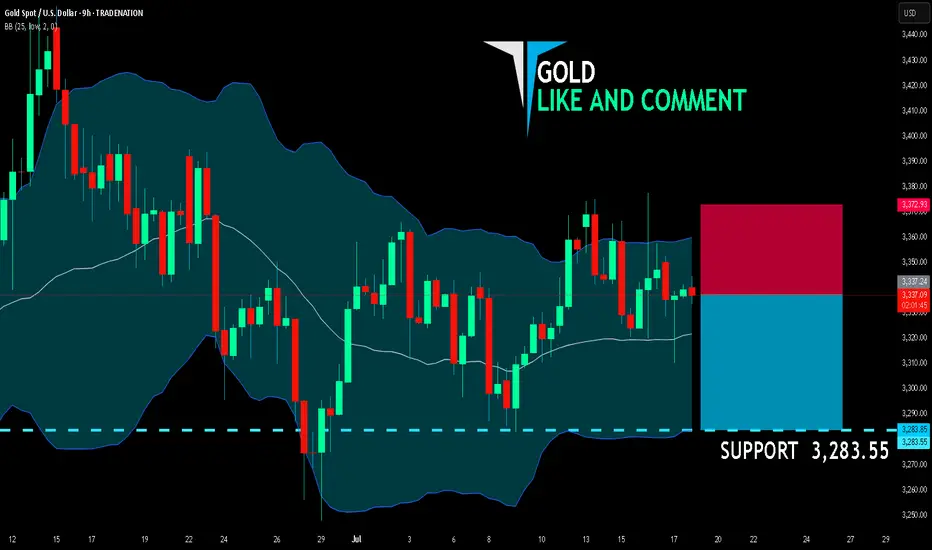
Trade Direction: short
Entry Level: 3,337.24
Target Level: 3,283.55
Stop Loss: 3,372.93
RISK PROFILE
Risk level: medium
Suggested risk: 1%
Timeframe: 9h
Disclosure: I am part of Trade Nation's Influencer program and receive a monthly fee for using their TradingView charts in my analysis.
✅LIKE AND COMMENT MY IDEAS✅
Gold (XAU/USD) Premium Technical Outlook - 18 July 2024As gold continues to trade near record highs, the market’s current price action around $3,336–3,340 demands a sharp, disciplined technical view. This premium analysis combines price action, Fibonacci techniques, institutional concepts (ICT and Smart Money Concepts), and advanced supply–demand dynamics to identify actionable trade opportunities.
We anchor on the 4-hour timeframe for directional bias and zoom into the 1-hour chart for precision intraday setups.
📊 4‑Hour Timeframe: Structure and Directional Bias
Gold remains in a clear bullish structure on the 4-hour chart, as evidenced by sustained higher highs and higher lows. The most recent bullish Break of Structure (BOS) occurred above the $3,320–3,325 level, confirming buyers’ control for now.
Currently, price hovers near equilibrium at the 61.8% Fibonacci retracement, testing prior resistance as potential support. This zone aligns with a small fair value gap (FVG), reinforcing it as an area of interest for smart money participants.
Key 4H Levels to Watch
Level Significance
$3,360–3,365 Major supply zone & bearish OB
$3,350–3,355 Minor resistance
$3,337–3,340 61.8% Fib / equilibrium
$3,330–3,333 BOS retest & key support
$3,300–3,310 Strong demand zone & bullish OB
$3,285–3,295 Secondary demand zone below BOS
The directional bias on 4H remains neutral-to-bullish, contingent on price holding above $3,300. A clean break and close above $3,360 could open a path to $3,400–3,420, while a sustained drop below $3,300 would mark a change of character (CHOCH) and shift bias to bearish.
🪙 Institutional Concepts in Play
Order Blocks (OB): Strong bullish OB sits at $3,300–3,310, while a bearish OB dominates at $3,355–3,365.
Fair Value Gaps (FVG): On the bullish side, $3,300–3,315 remains unfilled; on the bearish side, $3,330–3,345 caps rallies.
Liquidity Grabs: Dips toward $3,295–3,300 appear to sweep sell-side liquidity, while spikes above $3,360 tap into resting buy stops.
The area around $3,330 remains a key battleground where smart money likely accumulates positions before the next impulsive move.
⏳ 1‑Hour Timeframe: Intraday Trade Setups
On the 1-hour chart, the market is compressing between a bullish order block and bearish supply. Price action shows evidence of short-term liquidity sweeps and reactions to imbalances, offering two clear scenarios for intraday traders.
📈 Setup A – Bullish Zone Bounce
Entry: Buy limit at $3,332–3,333
Stop-loss: Below $3,328
Take-Profit 1: $3,345
Take-Profit 2: $3,355
Rationale: Confluence of 4H demand, Fib retracement, BOS retest, and 1H bullish order block.
📉 Setup B – Supply Rejection Short
Entry: Sell limit at $3,355–3,360
Stop-loss: Above $3,365
Take-Profit 1: $3,337
Take-Profit 2: $3,330
Rationale: Price into 4H bearish OB, aligning with supply and stop runs above recent highs.
🌟 The Golden Setup
Among these, the Bullish Zone Bounce at $3,332–3,333 stands out as the highest-probability trade. This level represents maximum confluence:
Retest of 4H BOS.
Bullish OB on 1H.
61.8% Fibonacci support.
Unmitigated fair value gap.
This setup offers a favorable risk–reward profile with clear invalidation and multiple upside targets.
🔎 Summary Table
Bias Key Support Zones Key Resistance Zones
Neutral-to-bullish $3,300–3,310, $3,330–3,333 $3,350–3,355, $3,360–3,365
Intraday Setups Entry Zone Stop-Loss Take-Profit Targets
Bullish Zone Bounce 🌟 $3,332–3,333 < $3,328 $3,345 / $3,355
Supply Rejection Short $3,355–3,360 > $3,365 $3,337 / $3,330
📣 Final Word
Gold maintains a structurally bullish outlook above $3,300, with strong institutional footprints evident in the $3,300–3,333 demand zones. Traders should remain vigilant around $3,360, where sell-side liquidity and supply are concentrated.
The Golden Setup — a bullish bounce from $3,332 — offers the best confluence and statistical edge intraday.

Fibonacci Retracement: The Hidden Key to Better EntriesIf you’ve ever wondered how professional traders predict where price might pull back before continuing... the secret lies in Fibonacci Retracement.
In this post, you’ll learn:
What Fibonacci retracement is
Why it works
How to use it on your charts (step-by-step)
Pro tips to increase accuracy in the market
🧠 What Is Fibonacci Retracement?:
Fibonacci Retracement is a technical analysis tool that helps traders identify potential support or resistance zones where price is likely to pause or reverse during a pullback.
It’s based on a mathematical sequence called the Fibonacci Sequence, found everywhere in nature — from galaxies to sunflowers — and yes, even in the markets.
The Fibonacci sequence is a series of numbers where each number is the sum of the two preceding ones, starting with 0 and 1. The sequence typically begins with 0, 1, 1, 2, 3, 5, 8, 13, and so on. This pattern can be expressed as a formula: F(n) = F(n-1) + F(n-2), where F(n) is the nth Fibonacci number.
The key Fibonacci levels traders use are:
23.6%
38.2%
50%
61.8%
78.6%
These levels represent percentages of a previous price move, and they give us reference points for where price might pull back before resuming its trend and where we can anticipate price to move before showing support or resistance to the trend you are following.
💡Breakdown of Each Fib Level:
💎 0.236 (23.6%) – Shallow Pullback
What it indicates:
Weak retracement, often signals strong trend momentum.
Buyers/sellers are aggressively holding the trend.
Best action:
Aggressive entry zone for continuation traders.
Look for momentum signals (break of minor structure, bullish/bearish candles). Stay out of the market until you see more confirmation.
💎 0.382 (38.2%) – First Strong Area of Interest
What it indicates:
Healthy pullback in a trending market.
Seen as a key area for trend followers to step in.
Best action:
Look for entry confirmation: bullish/bearish engulfing, pin bars, Elliott Waves, or break/retest setups.
Ideal for setting up trend continuation trades.
Stop Loss 0.618 Level
💎 0.500 (50.0%) – Neutral Ground
What it indicates:
Often marks the midpoint of a significant price move.
Market is undecided, can go either way.
Best action:
Wait for additional confirmation before entering.
Combine with support/resistance or a confluence zone.
Useful for re-entry on strong trends with good risk/reward.
Stop Loss 1.1 Fib Levels
💎 0.618 (61.8%) – The “Golden Ratio”
What it indicates:
Deep pullback, often seen as the last line of defense before trend reversal.
High-probability area for big players to enter or add to positions.
Best action:
Look for strong reversal patterns (double bottoms/tops, engulfing candles).
Excellent area for entering swing trades with tight risk and high reward.
Use confluence (structure zones, moving averages, psychological levels, Elliott Waves).
Wait for close above or below depending on the momentum of the market.
Stop Loss 1.1 Fib Level
💎 0.786 (78.6%) – Deep Correction Zone
What it indicates:
Very deep retracement. Often a final “trap” zone before price reverses.
Risk of trend failure is higher.
Best action:
Only trade if there's strong reversal evidence.
Use smaller position size or avoid unless other confluences are aligned.
Can act as an entry for counter-trend trades in weaker markets.
Stop Loss around 1.1 and 1.2 Fib Levels
⏱️Best Timeframe to Use Fibs for Day Traders and Swing Traders:
Day trading:
Day traders, focused on capturing short-term price movements and making quick decisions within a single day, typically utilize shorter timeframes for Fibonacci retracement analysis, such as 15-minute through hourly charts.
They may also use tighter Fibonacci levels (like 23.6%, 38.2%, and 50%) to identify more frequent signals and exploit short-term fluctuations.
Combining Fibonacci levels with other indicators such as moving averages, RSI, or MACD, and focusing on shorter timeframes (e.g., 5-minute or 15-minute charts) can enhance signal confirmation for day traders.
However, relying on very short timeframes for Fibonacci can lead to less reliable retracement levels due to increased volatility and potential for false signals.
Swing trading:
Swing traders aim to capture intermediate trends, which necessitates giving trades more room to fluctuate over several days or weeks.
They typically prefer utilizing broader Fibonacci levels (like 38.2%, 50%, and 61.8%) to identify significant retracement points for entering and exiting trades.
Swing traders often focus on 4-hour and daily charts for their analysis, and may even consult weekly charts for a broader market perspective.
🎯 Why Does Fibonacci Work?:
Fibonacci levels work because of:
Mass psychology – many traders use them
Natural rhythm – markets move in waves, not straight lines
Institutional footprint – smart money often scales in around key retracement zones
It's not magic — it's structure, and it's surprisingly reliable when used correctly.
🛠 How to Draw Fibonacci Retracement (Step-by-Step):
Let’s say you want to trade XAU/USD (Gold), and price just had a strong bullish run.
✏️ Follow These Steps:
Identify the swing low (start of move)
Identify the swing high (end of move)
Use your Fibonacci tool to draw from low to high (for a bullish move)
The tool will automatically mark levels like 38.2%, 50%, 61.8%, etc.
These levels act as pullback zones, and your job is to look for entry confirmation around them.
🔁 For bearish moves, draw from high to low. (I will show a bearish example later)
Now let’s throw some examples and pictures into play to get a better understanding.
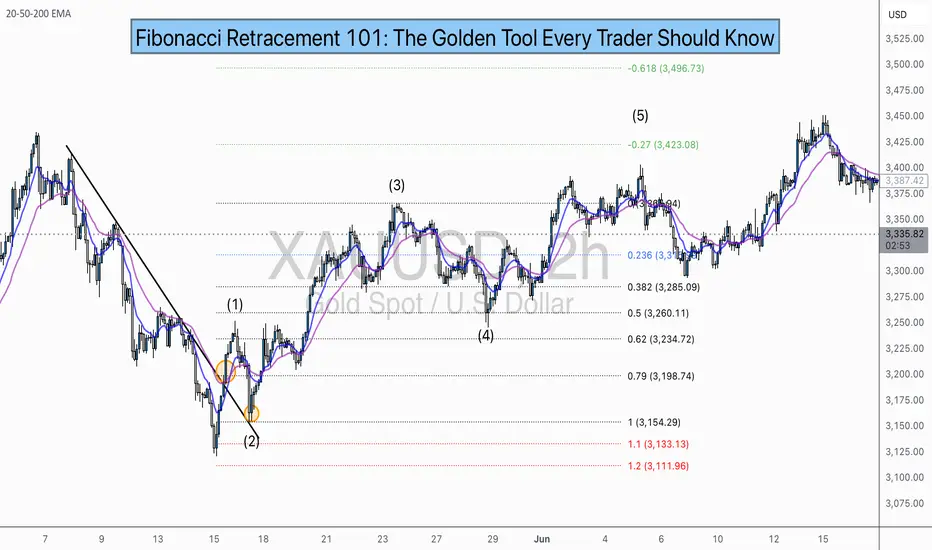
📈 XAU/USD BULLISH Example:
1.First we Identify the direction of the market:
2.Now we set our fibs by looking for confirmations to get possible entry point:
Lets zoom in a bit:
Now that we have a break of the trendline we wait for confirmation and look for confluence:
Now we set our fibs from the last low to the last high:
This will act as our entry point for the trade.
3. Now we can look for our stop loss and take profit levels:
Stop Loss:
For the stop loss I like to use the fib levels 1.1 and 1.2 when I make an entry based upon the 0.618 level. These levels to me typically indicate that the trade idea is invalid once crossed because it will usually violate the prior confirmations
Take Profit:
For the take profit I like to use the Fib levels 0.236, 0, -0.27, and -0.618. This is based upon your personal risk tolerance and overall analysis. You can use 0.236 and 0 level as areas to take partial profits.
Re-Entry Point Using Elliott Waves as Confluence Example:
This is an example of how I used Elliott Waves to enter the trade again from the prior entry point. If you don’t know what Elliott Waves are I will link my other educational post so you can read up on it and have a better understanding my explanation to follow.
After seeing all of our prior confirmations I am now confident that our trend is still strongly bullish so I will mark my Waves and look for an entry point.
As we can see price dipped into the 0.38-0.5 Fib level and rejected it nicely which is also in confluence with the Elliott Wave Theory for the creation of wave 5 which is the last impulse leg before correction.
🔻 In a downtrend:
Same steps, but reverse the direction — draw from high to low and look to short the pullback.
XAU/USD Example:
As you can see the same basic principles applied for bearish movement as well.
⚠️ Pro Tips for Accuracy:
✅ Always use Fib in confluence with:
Market structure (higher highs/lows or lower highs/lows)
Key support/resistance zones
Volume or momentum indicators
Candle Patterns
Elliott Waves, etc.
❌ Don’t trade Fib levels blindly — they are zones, not guarantees.
📊 Use higher timeframes for cleaner levels (4H, Daily)
💡 Final Thought
Fibonacci retracement doesn’t predict the future — it reveals probability zones where price is likely to react.
When combined with structure and confirmation, it becomes one of the most reliable tools for new and experienced traders alike.
🔥 Drop a comment if this helped — or if you want a Part 2 where I break down Fibonacci Extensions and how to use them for take-profit targets.
💬 Tag or share with a beginner who needs to see this!
GOLD tests $3,310 then recovers, continues sidewaysInternational OANDA:XAUUSD fell to the support level of 3,310 USD, then recovered and continued to stabilize sideways due to the stronger US Dollar and market tensions eased after US President Trump said it was "extremely unlikely" to fire Federal Reserve Chairman Powell.
As of the time of writing, spot OANDA:XAUUSD was trading at 3,339 USD/oz.
Reuters reported on Wednesday that Trump is still open to the possibility of firing Powell. However, Trump said on Wednesday that he has no intention of firing Powell at this time, but did not completely rule out the possibility and reiterated his criticism of the Fed chairman for not lowering interest rates.
Data showed US producer prices unexpectedly held steady in June, as the impact of higher import tariffs on goods was offset by weakness in the services sector.
The unchanged US PPI in June showed wholesale prices were stabilising, suggesting the economic impact of tariffs may be smaller than initially feared.
The lower-than-expected core CPI and core PPI data did not provide the boost that was expected, which could mean that the market is focusing on other aspects. More broadly, as the Fed gradually eases policy, real yields could continue to fall, and gold will maintain its upward trend. However, if the market continues to reprice expectations for a hawkish rate cut, this could trigger a short-term correction.
SPDR Gold Trust, the world's largest gold-backed exchange-traded fund (ETF), said its holdings rose 0.33% to 950.79 tonnes on Wednesday from 947.64 tonnes in the previous session.
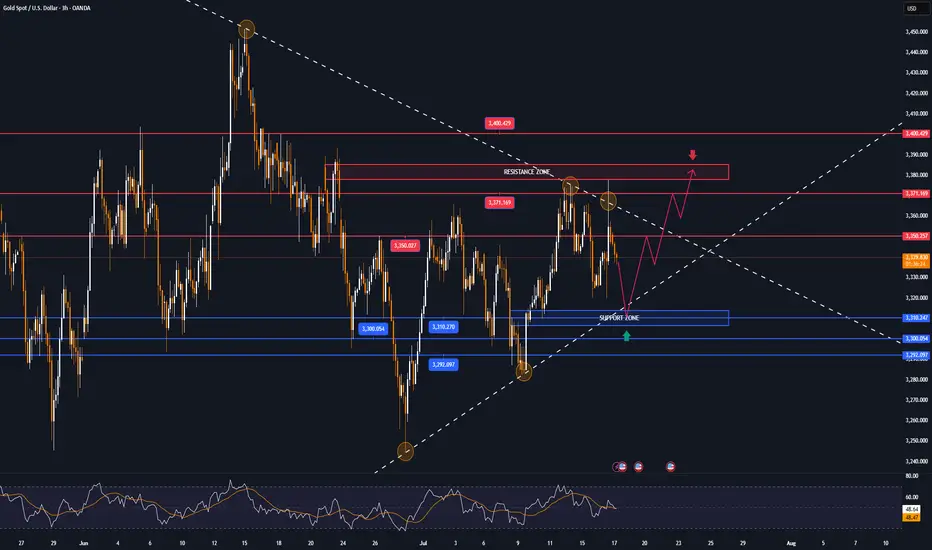
Technical Outlook Analysis OANDA:XAUUSD
On the daily chart, gold rebounded after falling and tested the support level noted by readers in yesterday's edition at 3,310 USD. The recovery brought gold prices back to work around the EMA21, continuing the sideways accumulation trend.
Structurally there is no change, as for gold to qualify for an upside move it needs to break resistance at the 0.236% Fibonacci retracement level then the short term target is the raw price point of $3,400. Meanwhile for gold to complete its bearish cycle it needs to sell below the 0.382% Fibonacci retracement level then the short term target would be around $3,246, more than the 0.50% Fibonacci retracement level.
The relative strength index (RSI) is also unchanged with the RSI activity around 50, indicating a hesitant market sentiment without leaning towards any particular trend.
Intraday, the technical outlook for gold prices continues to be a sideways accumulation trend, and the notable positions will be listed as follows.
Support: 3,310 – 3,300 – 3,292 USD
Resistance: 3,350 – 3,371 USD
SELL XAUUSD PRICE 3386 - 3384⚡️
↠↠ Stop Loss 3390
→Take Profit 1 3378
↨
→Take Profit 2 3372
BUY XAUUSD PRICE 3276 - 3278⚡️
↠↠ Stop Loss 3272
→Take Profit 1 3284
↨
→Take Profit 2 3290

Latest Gold Price Update TodayGold prices today continue to maintain a short-term uptrend, driven by trade tensions and U.S. inflation data.
The weakening of the USD and the drop in U.S. Treasury yields have increased gold's appeal as a safe-haven asset. The trade tensions between the U.S. and the EU, along with new tariff measures, further boost the demand for gold.
Additionally, the U.S. PPI for June rose by 2.3%, lower than the forecast and May’s increase, suggesting that inflation could decrease in the future. The market expects the Fed to cut interest rates in September, weakening the USD and supporting gold's uptrend.
With factors like trade tensions, a weaker USD, and positive inflation data, gold prices may continue to rise. Investors need to closely monitor these factors to devise an appropriate strategy.
Sweep On levels and Confirmation of Bullish pressure! Now that we have a sweep on levels we are looking for bullish pressure to continue. They have closed the 4Hr bullish. Being that it is Friday keeping expectation low cause price can break out and push hard or it can end up being Rotational. I feel there is a move here. We just have to wait for it to line up inside of the killzone. NOFOMO Mayn!

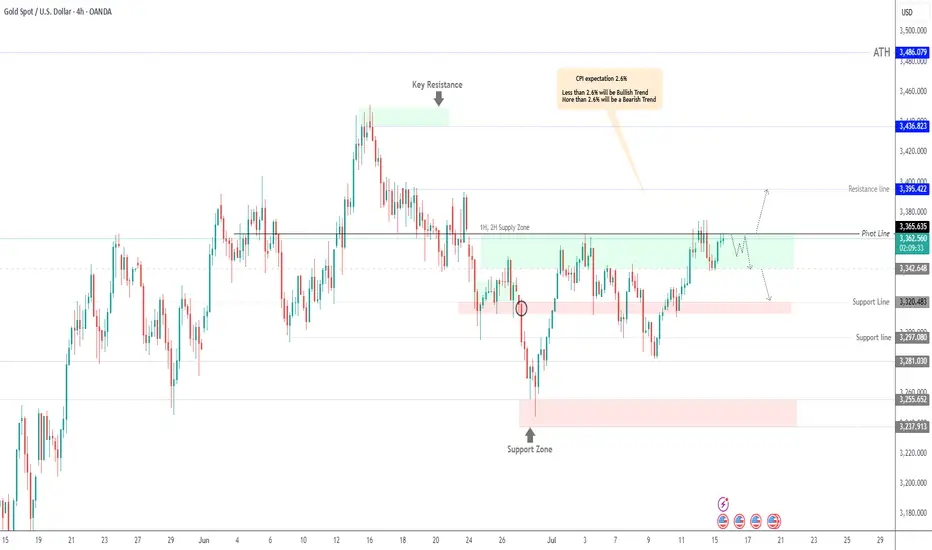
GOLD Under Pressure – CPI to Drive the Next MoveGOLD Outlook – Bearish Below 3365, CPI in Focus
Gold is showing bearish momentum while trading below 3365, with a likely move toward 3342.
However, if the price closes a 1H or 4H candle above 3365, it may shift to a bullish trend targeting 3395.
CPI data will be the key factor in determining the next move.
The market expects a print of 2.6%, which would signal no Fed rate cuts this year due to rising tariff pressures.
That said, we expect a 2.7% release, which would likely support a bearish trend for gold.
But if the release is less than 2.6% that will support the bullish trend.
Pivot Line: 3365
Support: 3342 – 3320
Resistance: 3375 – 3395
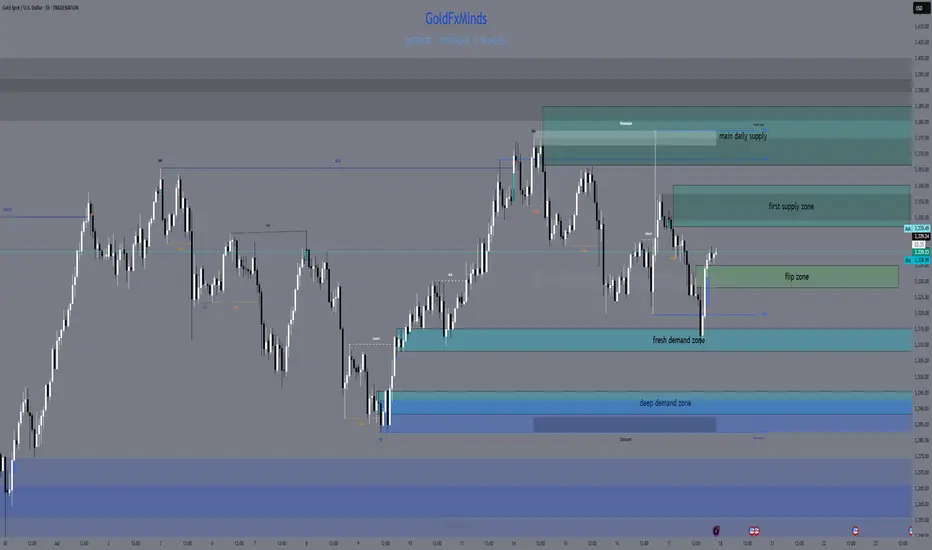
XAUUSD Daily Sniper Plan – July 17-18, 2025Hello traders!
After yesterday’s high-volatility trap and NY session recovery, we now stand at a major structural junction. Buyers reclaimed 3310–3314 with precision, but price is pressing into multi-timeframe supply. Let’s break it down clearly
🔸 HTF Bias
Daily Bias: Bullish correction inside a larger range. Demand at 3310–3305 was swept and respected, but supply at 3347–3360 caps upside.
H4 Bias: Bullish flow into supply. Structure printed clean HLs from 3295–3310. However, current zone is full of short-term profit-taking risk.
H1 Bias: Bullish short-term trend. Price built higher lows from 3310, but now sits at 3340–3347 — reactive zone where momentum could fade if no breakout.
🔸 Key Structural Zones (with role)
🔺 Supply Zones (Above Price):
3347–3360 (D1/H4/H1 Supply)
🔹 Multi-timeframe confluence
🔹 Previous reaction + NY trap zone
🔹 Expect heavy rejection or false breakout wicks
3366–3385 (D1 Supply)
🔹 Final liquidity shelf for buyers
🔹 Only valid if 3347 breaks clean
🔹 Longs must wait for confirmation after breakout
⚔️ Decision Zones (Middle):
3335–3328 (Intraday Flip Zone)
🔹 M15-M30 structure control
🔹 Buyers can reload here on clean bounce
🔹 If price closes below, opens door for bearish momentum
🔻 Demand Zones (Below Price):
3314–3310 (H1/H4 Demand – Key Buy Area)
🔹 Institutional demand origin
🔹 Price tapped, swept, and reclaimed
🔹 Ideal sniper buys only on retest with bullish M15 BOS
3305–3295 (Deep Reversal Demand)
🔹 Extreme discount
🔹 Valid only if 3310 fails
🔹 High RR buys if liquidity sweep appears
🔸 Sniper Battle Plan 🎯
Scenario 1 – Fade from 3347–3360:
🔹 If rejection signs (M15 FVG + RSI divergence), short toward 3335, 3314
🔹 Only enter if NY open confirms exhaustion
Scenario 2 – Pullback to 3335–3328:
🔹 Ideal quick buys on bounce with confirmation
🔹 Watch for BOS on LTF for sniper entry
Today’s zones require real discipline: no rush, no panic — just clear steps, sharp entries, and clean rejections or retests. You already saw what 3310–3305 reacted. The next move? You plan it. You take it. You own it.
✨ Which zone are you watching for your next move?
Drop a comment, leave a 🚀🚀🚀and follow for more sniper-level clarity — every single day.
Let’s keep mastering this market. Together.
Disclosure: All plans are built on Trade Nation live feed. Educational only.
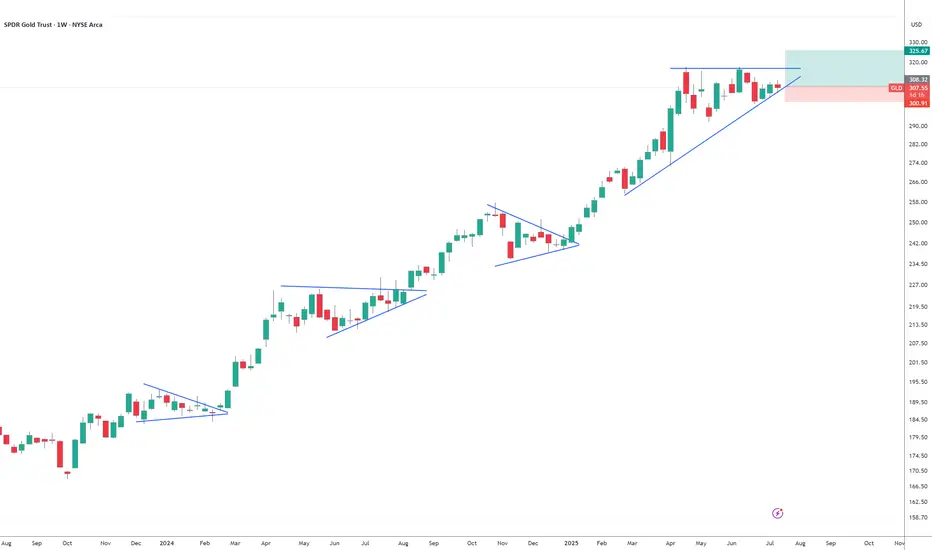
Gold!!!!!Looks like GLD is setting up for a big move to the upside. It likes to consolidate for a few weeks before a massive breakout. I have some GLD calls strike 310 for September 19. My SL triggers if a weekly candle closes under trendline. TP 325 ish.
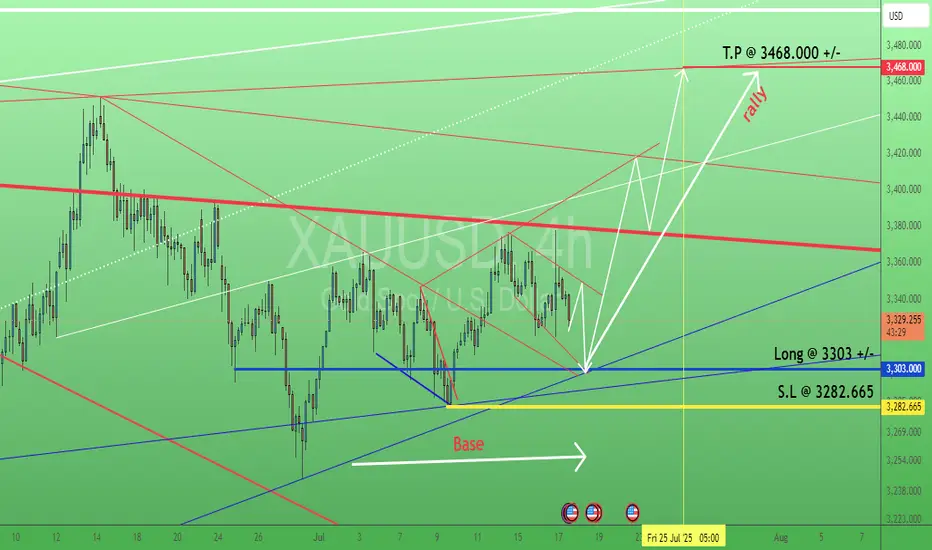
Gold. Swing Signal ONLY no detail. 17/July/25XAUSD.. For the past I try to give as detailed as possible on my chart for learning purpose BUT end up fewer likes and "complicated" to understand comments.. I hope this time you are not getting signals only But nothings to learn...
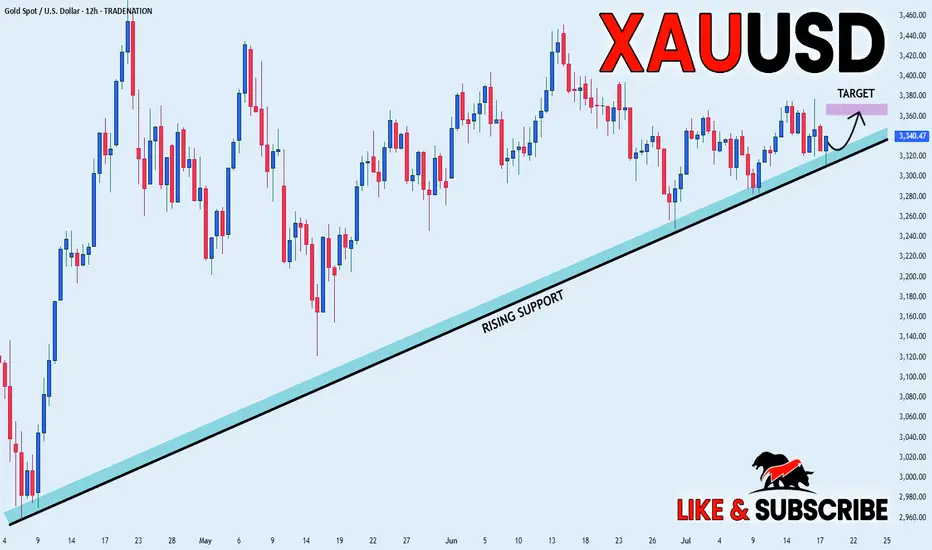
GOLD LONG FROM RISING SUPPORT|
✅GOLD is trading in an uptrend
And the bullish bias is confirmed
By the rebound we are seeing
After the price retested the support
So I think the growth will continue
LONG🚀
✅Like and subscribe to never miss a new idea!✅
Disclosure: I am part of Trade Nation's Influencer program and receive a monthly fee for using their TradingView charts in my analysis.
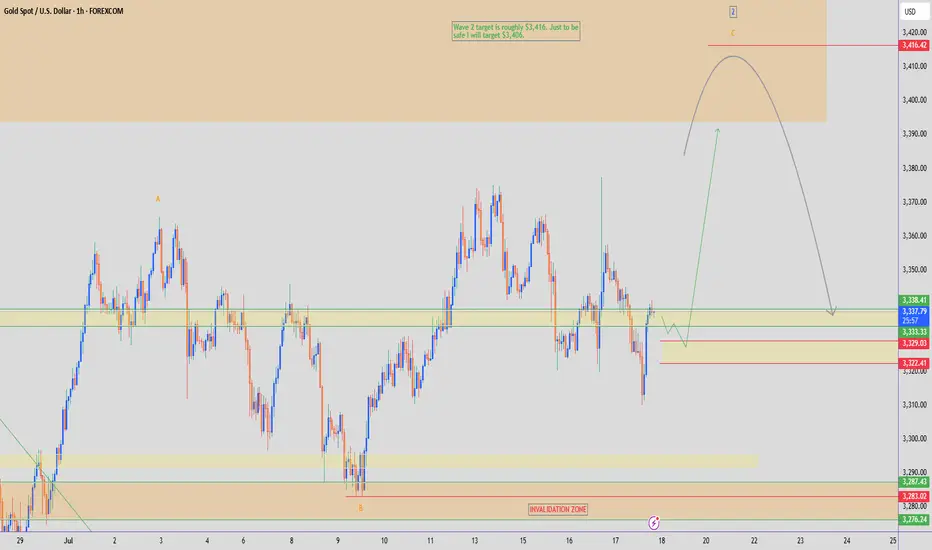
GOLD - Wave 2 Bullish Towards $3,406 (1H UPDATE)I see a possible buy opportunity towards $3,406 on Gold, as part of its bigger Wave 2 correction, before we can consider selling again.
Confluences👇
⭕️Wave 2 Correction Not Complete (2 Sub-Waves So Far).
⭕️Distribution Schematic Forming.
⭕️Early Sellers ($3,377) & Buyers ($3,310) Liquidated In Past 2 Days.
Now we've seen both buyers & sellers liquidated, we can expect to see a cleaner move back towards $3,400 where there is a lot of pending liquidity.
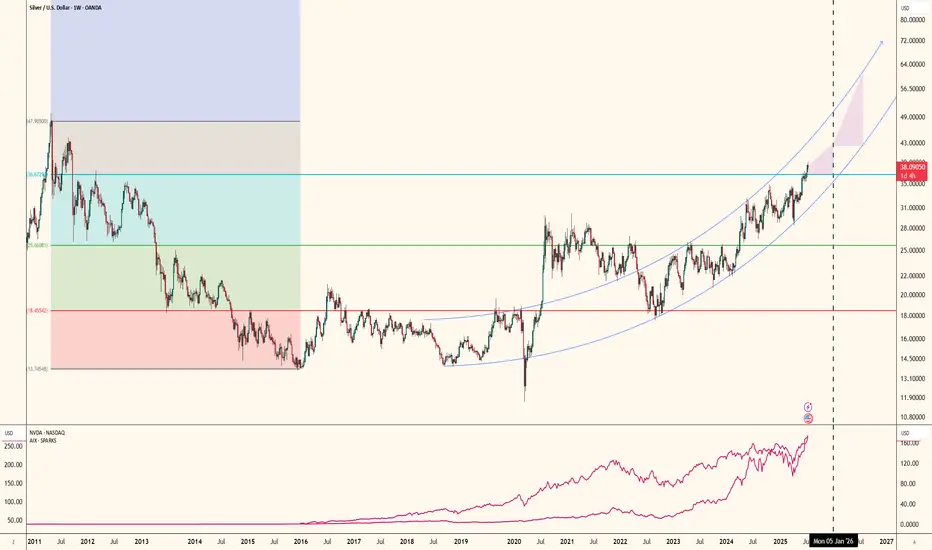
The AI Boom's Unsung HeroThe rise of artificial intelligence isn’t just shaking up tech companies it’s quietly transforming the global silver market in a big way. As major players like NVIDIA, Google and others ramp up their AI infrastructure silver is becoming more critical than ever. Why? Because silver, thanks to its unmatched electrical conductivity, plays a key role in powering the hardware behind AI.
Silver is the most conductive metal on Earth. That makes it perfect for high-performance computing something AI needs a lot of. It’s especially important in data centers and advanced semiconductors, where both electrical and thermal performance are mission-critical.
What’s really interesting is that AI servers tend to use two to three times more silver than traditional data center servers. That’s because AI workloads are more power-hungry, generate more heat and require more complex cooling and electrical systems. Simply put, more AI means more silver.
If there’s one company at the heart of this trend it’s NVIDIA. Analysts at Morgan Stanley expect NVIDIA to consume a staggering 77% of all silicon wafers used for AI accelerators in 2025 up from 51% in 2024. That adds up to around 535,000 300-mm wafers a year each of which contains silver in key components.
All of this AI growth is showing up in the numbers. Industrial silver demand hit an all-time high of 680.5 million ounces in 2024. The electronics industry alone uses around 250 million ounces per year and AI is now the fastest-growing part of that.
Despite all this demand, silver supply just isn’t keeping up. The market’s been in deficit for four straight years, with a total shortfall of 678 million ounces between 2021 and 2024. That’s roughly ten months of global mine output gone missing from the balance sheet.
It’s no surprise, then, that silver prices have been climbing fast. As of July 2025 silver’s up nearly 30% for the year. Looking further ahead I see room for silver to keep climbing:
In the short term (2025): $36–$42 per ounce seems realistic
By 2026: Potential for $50+ as more AI growth stays strong
AI isn’t just changing how we work, communicate, or compute—it’s literally reshaping the commodities that make this technology possible. Silver, once thought of mainly in the context of jewelry or coins, is now a backbone material for the AI revolution.
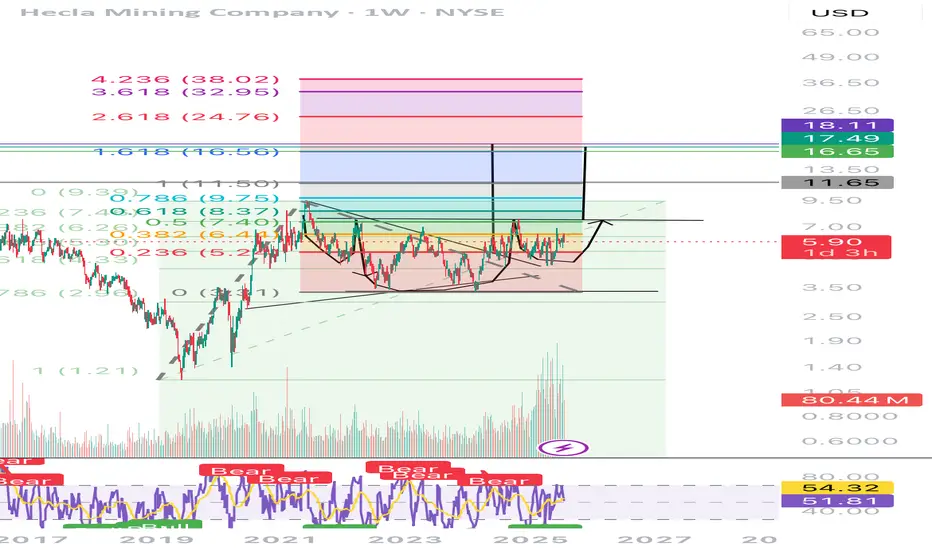
HL-Insane Confluence HereChart speaks for itself.
Confluence on many indicators suggests a hard bottom here
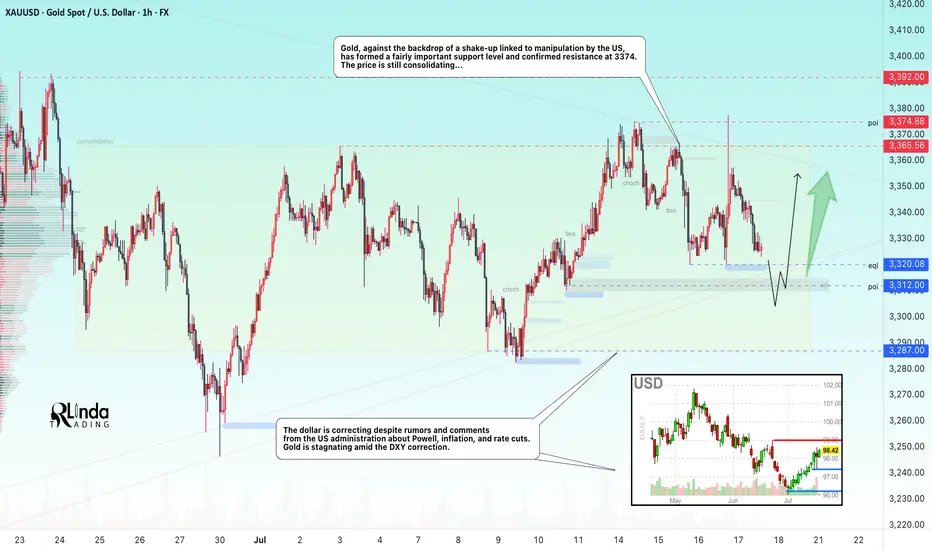
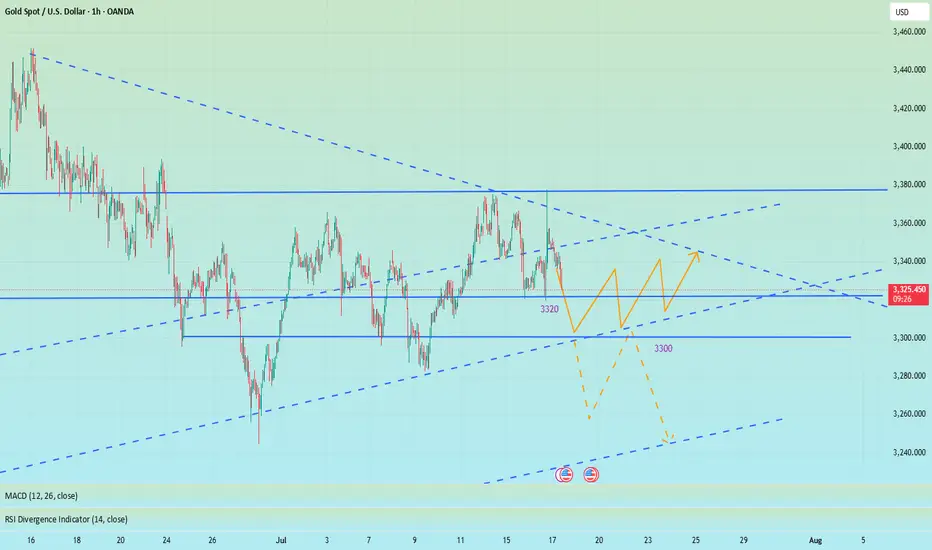
GOLD → The triangle is contracting. Retest of support...FX:XAUUSD tested a local high of 3375 but quickly returned to consolidation. The reason is manipulation by the US administration related to Powell, inflation, and interest rates...
Demand for gold has risen sharply amid global risks: Trump's aggressive tariff plans, strong inflation, and uncertainty about the Fed's actions have increased interest in defensive assets. Despite the temporary strengthening of the dollar, gold remains a popular hedging instrument. Technical analysis also points to a bullish outlook. However, growth potential is limited until the Fed clarifies its interest rate policy
Technically, on the D1 chart, it is clear that the price is consolidating, with the range continuing to narrow. Due to the bullish factors listed above, we can expect growth to continue. However, it is difficult to say where and when the growth will begin due to the uncertainty factor. All attention is on the support at 3320-3312, the triangle support, as well as the consolidation support at 3287.
Resistance levels: 3365, 3375
Support levels: 3320, 3312, 3287
Since the opening of the session, the price has spent part of its daily range, so there may not be enough potential for the decline to continue. A false breakdown of support and consolidation of the price above the key zone may attract buyers, which will trigger growth towards resistance.
Best regards, R. Linda!
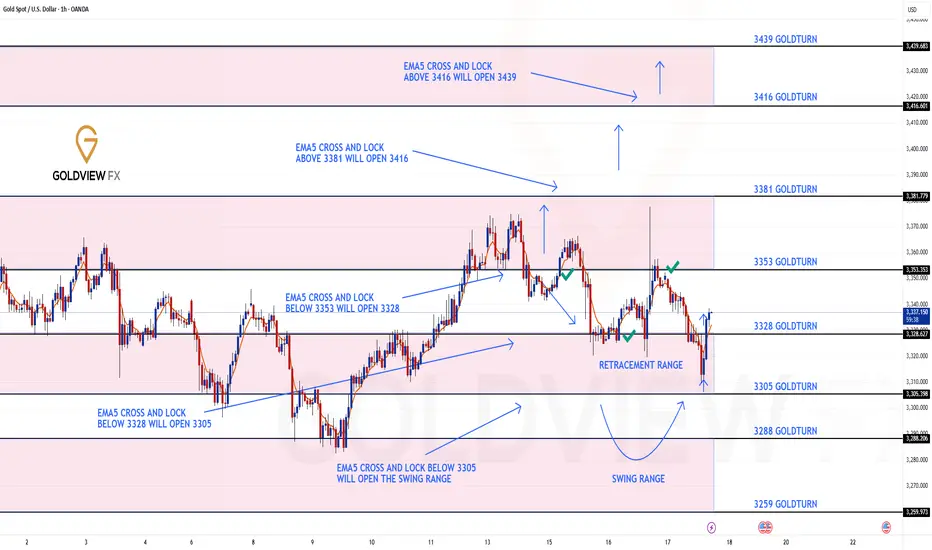
GOLD ROUTE MAP UPDATEHey Everyone,
Quick follow-up on yesterday’s 1H chart update
After hitting 3353, we did not see an EMA5 cross and lock above this level. That lack of confirmation was key and it validated a rejection right at 3353, leading to another drop into the retracement zone.
As per plan, that retracement provided yet another clean bounce, perfectly in line with our dip buying strategy.
We are once again looking toward 3353, and just like before, we will be closely watching for an EMA5 cross and lock confirmation to validate any continuation.
This kind of movement continues to confirm the power of patience, structure, and disciplined execution. No chasing just clean planned executions with high probability setups based on our EMA5 methodology.
We’re also still watching the 3381 gap a key magnet above, and a level we’ve been tracking since the Monday outlook. The roadmap remains unchanged. We’re trading the structure, managing risk, and letting confirmations guide the execution.
Updated Reminder of Key Levels:
BULLISH TARGET
3381
EMA5 CROSS & LOCK ABOVE 3381 opens
3416
EMA5 CROSS & LOCK ABOVE 3416 opens
3439
BEARISH TARGETS
3353 ✅ HIT
EMA5 CROSS & LOCK BELOW 3353 opens
3328 ✅ HIT
EMA5 CROSS & LOCK BELOW 3328 opens
3305
EMA5 CROSS & LOCK BELOW 3305 opens Swing Range:
3288
3259
As always, we’ll continue monitoring and sharing updates, as price reacts around these zones. Thank you all for the continued support, your likes, comments, and follows are genuinely appreciated!
Mr Gold
GoldViewFX
Treat it as a long-short wash-out shock, and go long on pullback📰 News information:
1. Initial jobless claims data
2. June retail data
3. Beware of Trump's remarks about firing Powell
📈 Technical Analysis:
Last night, the daily line closed at around 3347. The current short-term daily line range is 3355-3300. The short-term support below is still 3320. Once it falls below 3320, it will look to 3310-3300. Short-term trading is still volatile. If the intraday retracement reaches 3320-3310, consider going long, and the defense is 3300, with the target at 3340-3350. Under the current rhythm of long and short wash, don't chase the rise and sell the fall, look at it rationally, and brothers who trade independently must bring SL.
🎯 Trading Points:
BUY 3320-3310
TP 3340-3350
In addition to investment, life also includes poetry, distant places, and Allen. Facing the market is actually facing yourself, correcting your shortcomings, facing your mistakes, and exercising strict self-discipline. I share free trading strategies and analysis ideas every day for reference by brothers. I hope my analysis can help you.
FXOPEN:XAUUSD OANDA:XAUUSD FX:XAUUSD FOREXCOM:XAUUSD PEPPERSTONE:XAUUSD TVC:GOLD
ETH - If You Know ...... You Know whats Coming
NYSE:BLK $BUIDL tokenized U.S.-Treasury fund launched on COINBASE:ETHUSD in Mar 2024—Wall Street is already settling real dollars on-chain.
NYSE:JPM JPMD stablecoin just went live on Base (an COINBASE:ETHUSD L2), piping wholesale payments from a $4 T balance-sheet straight through COINBASE:ETHUSD rails.
COINBASE:ETHUSD isn’t just riding the next crypto cycle—it’s becoming Wall Street’s settlement layer. From BlackRock’s on-chain Treasury fund to JPMorgan’s and soon Bank of America’s dollar tokens, a tidal wave of institutional stable-coin flows is lining up behind ETH. Fewer coins, more real-world volume—if you know, you know what’s coming.
NYSE:BAC CEO says they’ll issue a dollar-backed token the moment regulators nod—another tier-1 bank boarding the Ethereum train.
Stablecoin cap has blasted past $230 B , with 80 %+ of all on-chain transfers riding Ethereum (plus BSC) blocks.
Corporate settlements via stablecoins grew 25 % YoY in 2024 as multinationals replaced SWIFT with instant on-chain clearing.
Daily stablecoin throughput averages $7 B—each hop burning ETH and tightening supply.
BCG projects tokenized real-world assets to exceed $16 T by 2030 , with EVM chains as the default plumbing.
Over 500 M wallets already interact with stablecoins , a 30 % YoY surge led by emerging-market demand.
L2s like BINANCE:ARBUSDT & BINANCE:OPUSDT cut transaction fees 35 % yet still settle back to mainnet—meaning ETH captures the fee stream and the burn.
Bottom line: a tidal wave of bank-grade stablecoins + tokenized assets is lining up behind ETH; supply shrinks, demand soars—if you know, you know what’s coming.
quote] Marty Boots | 17-Year Trader — smash that , hit LIKE & SUBSCRIBE, and share your views in the comments below so we can make better trades & grow together!
GOLD's narrowing range, tariffs, Trump's political dramaOANDA:XAUUSD is still trading in a narrowing range, affected by the tariff game and the political drama that Trump is building. Currently, the price of gold is trading around 3,339 USD/oz, equivalent to a small decrease of about 7 dollars on the day.
Tariff Game
On July 16, US President Donald Trump announced that he would send letters to more than 150 countries, with tariffs expected to be 10% or 15%, to promote trade. He said these countries are not major US partners and will be treated equally, but left open the possibility of negotiating exemptions. The tariffs are similar to those proposed in April but were postponed due to concerns about market volatility. The resumption of the tariffs continues to destabilize financial markets and surprised partners such as the European Union, as they hoped to reach an early agreement with the US.
Political Play
Also on July 16, global financial markets were shaken by rumors that President Trump intended to fire Federal Reserve Chairman Jerome Powell. Many major news agencies such as the New York Times, Bloomberg and Reuters reported that Trump had prepared a letter of dismissal and consulted with Republican lawmakers, receiving positive feedback. Removing Powell before his term was believed to undermine confidence in the US financial system and the safe haven status of the USD. Trump later denied the plan, saying it was unlikely to happen unless there was serious wrongdoing. Markets reacted strongly: the USD fell and then recovered after Trump's statement, while gold lost most of its previous gains by the end of the session.
The gold market in particular, and the financial economy in general, are being affected by the activities of Trump, the creator of the global trade war, and the plays of Trump and the FED leading the market. Therefore, the basic formula in the current market context is best to follow Trump, and make sure not to miss any of Trump's status lines.
Technical outlook analysis of OANDA:XAUUSD
On the daily chart, the technical structure has not changed with the trend not yet clear and the price action clinging to the EMA21.
The technical conditions do not favor an uptrend or a downtrend, typically the RSI moves around the 50 level, indicating a hesitant market sentiment.
On the upside, gold needs to achieve the condition of breaking above the 0.236% Fibonacci retracement level of the price point of 3,371 USD then the target level will be around 3,400 USD in the short term, more than 3,430 USD.
Meanwhile, on the downside, gold needs to break below the 0.382% Fibonacci retracement, which would confirm a loss of the $3,300 level, then target around $3,246 in the short term, more than the 0.50% Fibonacci retracement.
Intraday, the sideways trend of gold price accumulation will be noticed by the following technical positions.
Support: $3,310 – $3,300 – $3,292
Resistance: $3,350 – $3,371 – $3,400
SELL XAUUSD PRICE 3381 - 3379⚡️
↠↠ Stop Loss 3385
→Take Profit 1 3373
↨
→Take Profit 2 3387
BUY XAUUSD PRICE 3309 - 3311⚡️
↠↠ Stop Loss 3305
→Take Profit 1 3317
↨
→Take Profit 2 3323
XAUUSD: Market analysis and strategy for July 17.Gold technical analysis
Daily chart resistance: 3382, support below 3300
Four-hour chart resistance: 3375, support below 3320
One-hour chart resistance: 3352, support below 3320.
Trump's remarks in the NY market on Wednesday ignited the market. First, it was reported that Powell would be fired, and then it was reported that Trump denied the news. Gold quickly rose to 3375 and then quickly fell back. Under the impact of the news, the price fluctuated very quickly, jumping up and down quickly.
From the current market trend, the day before yesterday, it fell to 3319 and stopped falling and rebounded. Yesterday, it tested 3319 again and quickly pulled up. Yesterday, the price hit the high point of this week near 3375 again and fell back quickly. There is support below and resistance above. If it approaches the 3320 support for the third time today, it is likely to fall below, and then trigger a long stop loss, and it may fall rapidly at that time.
If it falls below 3319, it will look at the 3280~3300 range.
SELL:3319 SL:3324
SELL:3352 SL:3357
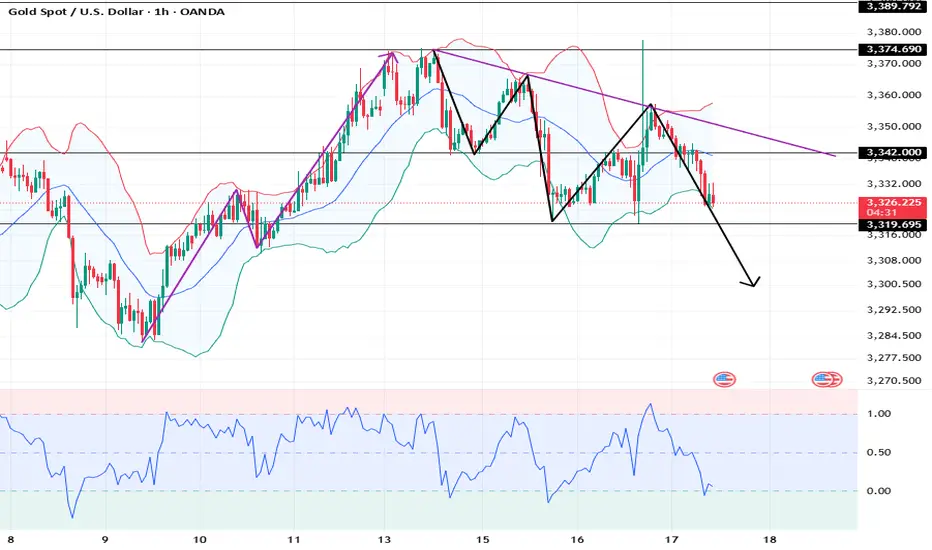
Market Volatile Amid Geopolitical Tensions & Fed Rumors Gold 17/07 – Market Volatile Amid Geopolitical Tensions & Fed Rumors
🌍 Macro Sentiment: Uncertainty Continues
The global gold market opened Thursday with high volatility following headlines that former U.S. President Donald Trump was considering firing Fed Chair Jerome Powell. Though Trump later denied the claim, the initial rumor spiked fear in financial markets.
At the same time:
🇮🇱 Israel launched airstrikes on Syria, escalating regional tensions.
🇪🇺 The EU proposed new tariffs on U.S. imports, increasing global economic friction.
🏦 Inflation concerns persist as BlackRock warns about delayed price pressures from earlier tariff hikes.
📉 These factors have turned gold into a temporary safe haven, but investors should remain cautious as the market is still undecided about direction.
🔎 Technical Outlook – Key Patterns to Watch
The H1 chart reveals price action respecting a wide consolidation range with visible liquidity sweeps on both ends. The market is forming a clean structure of lower highs, hinting at bearish bias unless bulls reclaim upper resistance zones.
Sell-side liquidity has been swept around the 3,320 level.
Order Block Sell Zone remains active at 3,342 – 3,344, potentially leading to a short-term drop.
If price breaks above 3,357 – 3,363 (VPOC & OB zone), a new bullish leg may form.
🎯 Trade Plan for Today
🟩 Buy Opportunity Zone
Entry: 3,312 – 3,310
Stop Loss: 3,306
Take Profits:
→ 3,316 → 3,320 → 3,324 → 3,328 → 3,335 → 3,340 → 3,350
📌 This zone has shown strong demand historically. Look for bullish candle confirmation on the lower timeframe (M15–H1).
🟥 Sell Opportunity Zone
Entry: 3,362 – 3,364
Stop Loss: 3,368
Take Profits:
→ 3,358 → 3,354 → 3,350 → 3,345 → 3,340
📌 This area overlaps with a VPOC level and prior order block – watch for price rejection patterns (e.g., bearish engulfing, fake breakouts).
⚠️ Risk Note
With geopolitical and monetary policy headlines dominating sentiment, price may spike erratically. Avoid overleveraging and always respect your SL/TP.
💬 What’s Your Take?
Do you think gold will break below 3,300 and head toward deeper FVG zones?
Or will bulls regain control and aim for 3,377 liquidity?
👇 Drop your analysis and let’s build the best gold trading community together!
