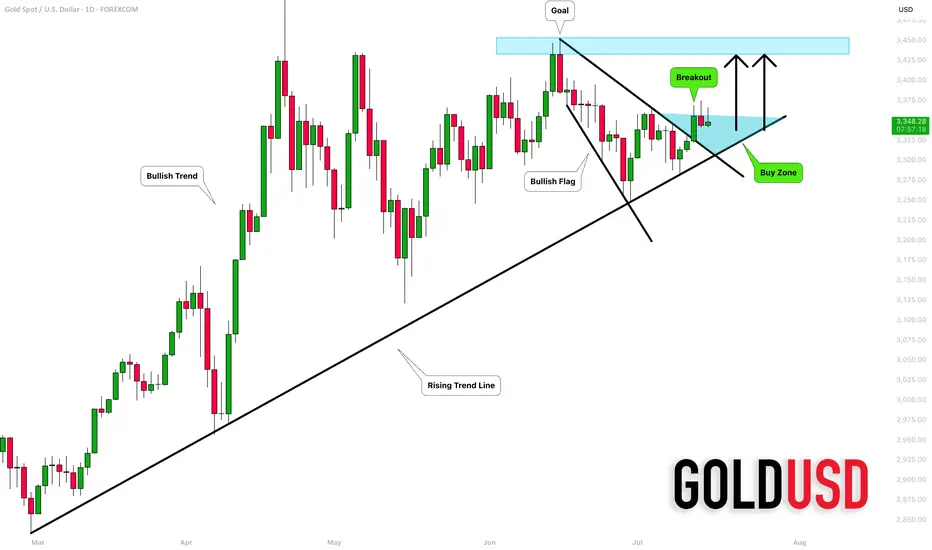
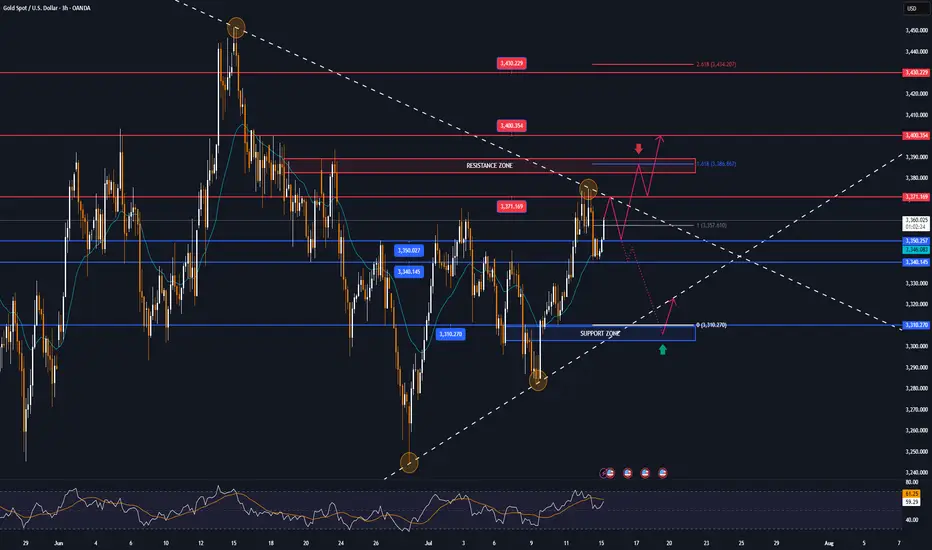
GOLD (XAUUSD): Mid-Term Outlook
Analysing a price action on Gold since March,
I see a couple of reliable bullish signals to consider.
As you can see, for the last 4 month, the market is respecting
a rising trend line as a support.
The last 4 Higher Lows are based on that vertical support.
The last test of a trend line triggered a strong bullish reaction.
The price successfully violated a resistance line of a bullish flag pattern,
where the market was correcting for almost a month.
A strong reaction to a trend line and a breakout of a resistance of the flag
provide 2 strong bullish signals.
I think that the market may grow more soon and reach at least 3430 resistance.
An underlined blue area will be a demand zone where buying orders will most likely accumulate.
❤️Please, support my work with like, thank you!❤️
Metals
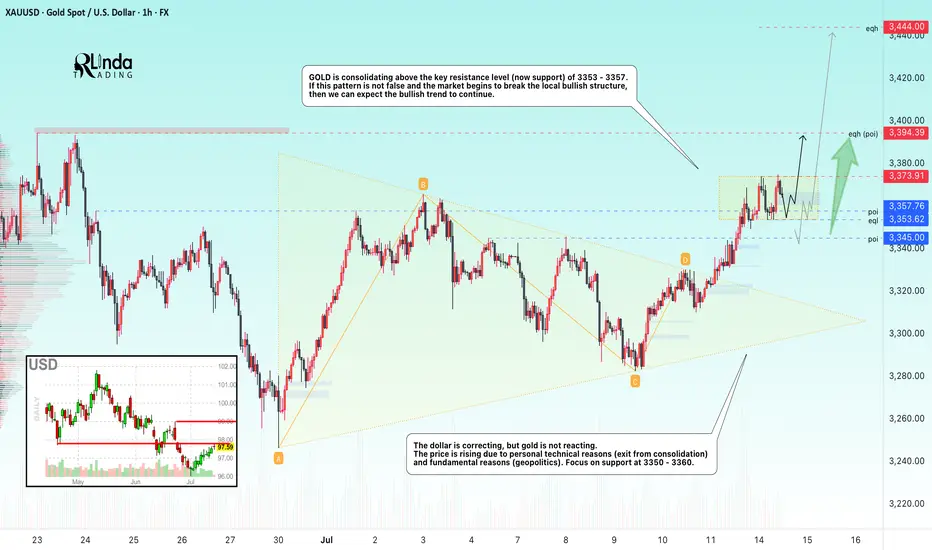
US CPIs came out. Gold is at an interesting spot.TVC:GOLD is currently struggling with one of its key resistance barriers, at around 3365. We need a clear break above that area in order to aim for higher areas. However, we are not getting bearish yet. Let's dig in!
MARKETSCOM:GOLD
Let us know what you think in the comments below.
Thank you.
75.2% of retail investor accounts lose money when trading CFDs with this provider. You should consider whether you understand how CFDs work and whether you can afford to take the high risk of losing your money. Past performance is not necessarily indicative of future results. The value of investments may fall as well as rise and the investor may not get back the amount initially invested. This content is not intended for nor applicable to residents of the UK. Cryptocurrency CFDs and spread bets are restricted in the UK for all retail clients.

It is expected to fluctuate and fall before CPI data📰 News information:
1. Focus on tomorrow's CPI data
2. Bowman's speech at the Federal Reserve
3. Tariff information outflows and countries' responses to tariff issues
📈 Technical Analysis:
The 1H chart shows that the gold price continued to pull back last night and then fluctuated at the bottom, and continued the rebound trend this morning. The key pressure level is the top and bottom conversion level. The current rebound in gold is only a secondary confirmation of the top structure at the 30-minute level. After reaching 3365, it has shown signs of short-term pressure. In a volatile market, if the price begins to consolidate horizontally, it may indicate the end of this round of volatile upward trend, and it will enter a downward phase later. Considering the market sensitivity before the release of CPI data, it is recommended to focus on the volatile decline trend. After today's rebound, it is necessary to focus on the 3365-3368 area as a short-selling range, and the long-short defense position is set at yesterday's intraday high of 3375. The support below focuses on the 3350-3340 range.
🎯 Trading Points:
SELL 3358-3368
TP 3345-3333
In addition to investment, life also includes poetry, distant places, and Allen. Facing the market is actually facing yourself, correcting your shortcomings, facing your mistakes, and exercising strict self-discipline. I share free trading strategies and analysis ideas every day for reference by brothers. I hope my analysis can help you.
FXOPEN:XAUUSD TVC:GOLD FX:XAUUSD FOREXCOM:XAUUSD PEPPERSTONE:XAUUSD OANDA:XAUUSD
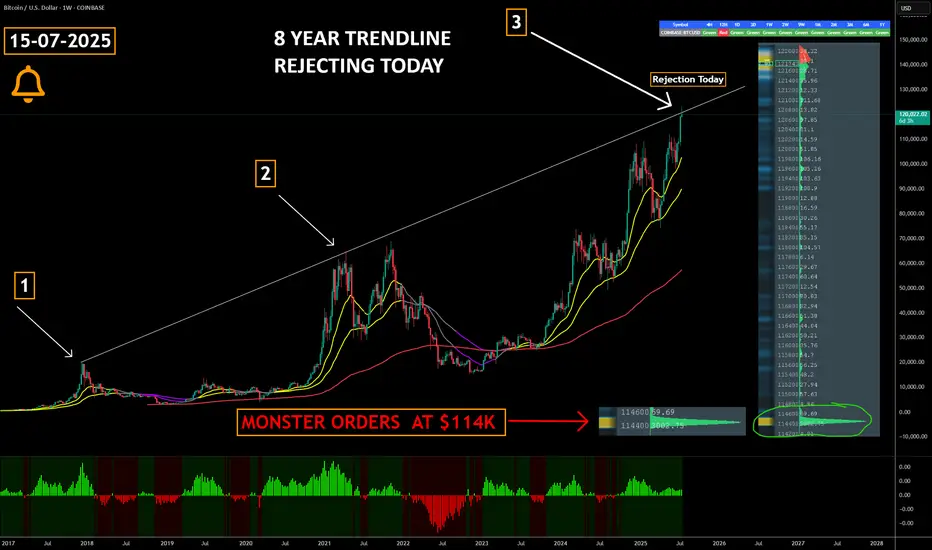
Did Bitcoin Just TOP OUT ??????
COINBASE:BTCUSD has just collided with an 8-year rising trendline that capped the market’s last two cyclical peaks—historically, this level has triggered multi-month corrections and Bear Markets.
Triple-test significance : a third touch of a long-term trendline ➜ heightened odds of a reaction; failure to break cleanly often confirms a major top.
Watch for confirmation signals —weekly bearish RSI divergence, waning volume, or rejection wicks can validate a reversal scenario.
Breakout = regime change : a decisive close and hold above the line flips it to support, opening the door to fresh price discovery and potential parabolic upside.
Large Orders at $114k create a visible demand wall in the order book, signalling that whales / institutions are ready to absorb a dip and accumulate at that level.
Risk-management alert : consider tightening stops, reducing leverage, or hedging until trendline fate is resolved.
The buy pressure has been relentless but this is always worth paying attention to
Marty Boots | 17-Year Trader — smash that , hit LIKE & SUBSCRIBE, and share your views in the comments below so we can make better trades & grow together!
DeGRAM | GOLD broke the trend line📊 Technical Analysis
● The break of the July descending cap at 3 355 has held as support; price is stair-stepping along a steep intraday channel whose lower rail coincides with the 3 350 pivot.
● Momentum is pressing the 3 368–3 393 supply; clearing that band opens the March swing objective at 3 430, while pullbacks into 3 350-3 355 are buffered by the former trend-line.
💡 Fundamental Analysis
● A second straight downside surprise in US PPI cooled 2-yr yields and the DXY, restoring carry appeal for non-yielding gold.
● World Gold Council notes June central-bank net purchases rose 6 % m/m, signalling persistent official demand.
✨ Summary
Long 3 350-3 360; hold above 3 355 targets 3 393 → 3 430. Bias void on an H1 close below 3 325.
-------------------
Share your opinion in the comments and support the idea with a like. Thanks for your support!
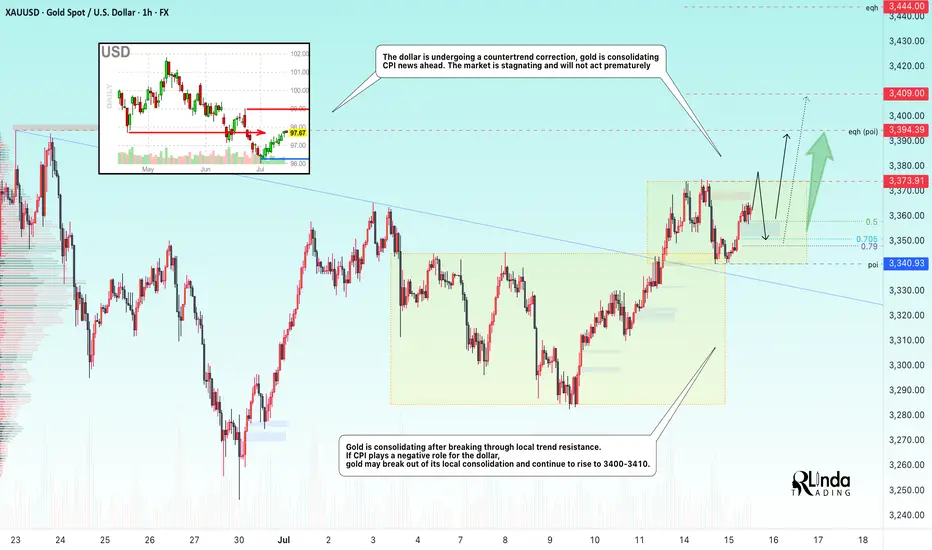
GOLD → Consolidation ahead of CPI. Chances for growth?FX:XAUUSD Gold is consolidating amid a correction in the dollar ahead of important news. Consumer price index data is due later today. The market is stagnant and will not move prematurely.
On Tuesday, gold rose slightly amid profit-taking ahead of the US CPI release. Investors are waiting for a signal from inflation: weaker data could strengthen bets on a Fed rate cut and support gold, while strong inflation would strengthen the dollar and put pressure on the metal. The situation is exacerbated by Trump's new tariff threats and his criticism of the Fed chair. Let me remind you of Trump's pressure on regulators regarding inflation and interest rate cuts.
Technically, gold is trading above the previously broken “symmetrical triangle” consolidation. Bulls are trying to hold their ground above 3340-3350. Focus on the current range of 3340-3373
Resistance levels: 3373, 3394
Support levels: 3350, 3340
Favorable news for gold could boost interest in the metal, which would generally lead to growth. However, there is a factor of unpredictability, and against this backdrop, gold may test support at 3350-3340. If the bulls manage to keep the price above this zone, we may see growth in the medium term. Otherwise, the price may drop to 3310-3280.
Best regards, R. Linda!
SILVER: Next Move Is Down! Short!
My dear friends,
Today we will analyse SILVER together☺️
The recent price action suggests a shift in mid-term momentum. A break above the current local range around 38.253 will confirm the new direction upwards with the target being the next key level of 38.151 and a reconvened placement of a stop-loss beyond the range.
❤️Sending you lots of Love and Hugs❤️

GOLD: Target Is Up! Long!
My dear friends,
Today we will analyse GOLD together☺️
The in-trend continuation seems likely as the current long-term trend appears to be strong, and price is holding above a key level of 3,363.43 So a bullish continuation seems plausible, targeting the next high. We should enter on confirmation, and place a stop-loss beyond the recent swing level.
❤️Sending you lots of Love and Hugs❤️
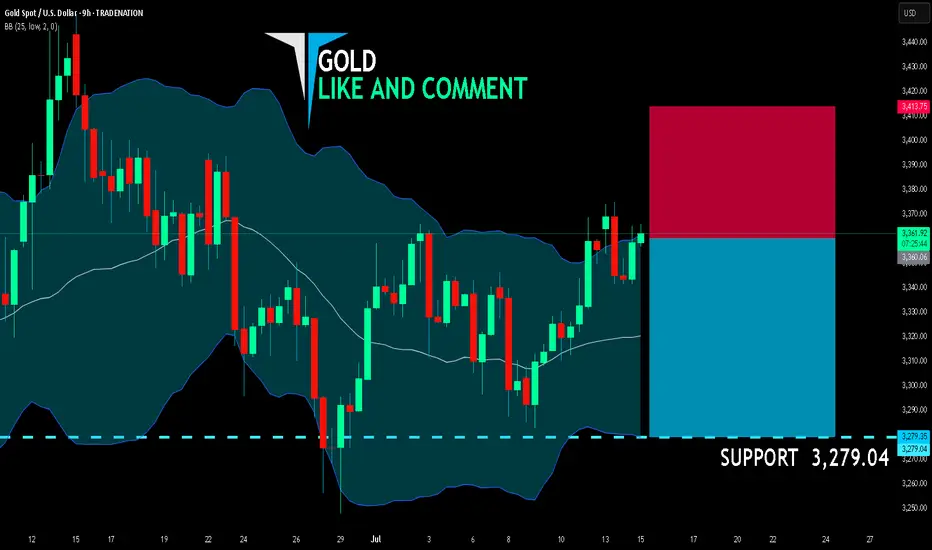
GOLD SHORT FROM RESISTANCE
GOLD SIGNAL
Trade Direction: short
Entry Level: 3,360.06
Target Level: 3,279.04
Stop Loss: 3,413.75
RISK PROFILE
Risk level: medium
Suggested risk: 1%
Timeframe: 9h
Disclosure: I am part of Trade Nation's Influencer program and receive a monthly fee for using their TradingView charts in my analysis.
✅LIKE AND COMMENT MY IDEAS✅
Gold 30Min Engaged ( Dual Entry's Detected )Time Frame: 30-Minute Warfare
Entry Protocol: Only after volume-verified breakout
🩸Bullish Reversal 3357 Zone
🩸Bearish Reversal 3357 Zone
➗ Hanzo Protocol: Volume-Tiered Entry Authority
➕ Zone Activated: Dynamic market pressure detected.
The level isn’t just price — it’s a memory of where they moved size.
Volume is rising beneath the surface — not noise, but preparation.
🔥 Tactical Note:
We wait for the energy signature — when volume betrays intention.
The trap gets set. The weak follow. We execute.
Converging triangle, may rise again in the short termUnder the influence of recent tariffs and the Federal Reserve's interest rate cuts, the main trend of the gold market remains bullish, but from the weekly and monthly level analysis, there is a high probability that it will pull back again after this round of highs and maintain a large range of fluctuations at a high level. Technical analysis shows that gold currently does not have the conditions for a unilateral surge at the daily level. Although the key level of 3345 has been broken, the continuity of the market is extremely poor, and volatility is still the main theme. At present, the trend of gold has formed a converging triangle pattern, and it may rise again in the short term. However, we need to be vigilant that the weekly line may form a high-rise and fall pattern, and the price of gold may fall back to 3300! Therefore, in today's late trading, you can consider retreating to the 3335-3330 area to go long
OANDA:XAUUSD
Silver H4 | Pullback support at 50% Fibonacci retracementSilver (XAG/USD) is falling towards a pullback support and could potentially bounce off this level to climb higher.
Buy entry is at 37.27 which is a pullback support that aligns with the 50% Fibonacci retracement.
Stop loss is at 36.60 which is a level that lies underneath a pullback support and the 61.8% Fibonacci retracement.
Take profit is at 38.32 which is a swing-high resistance.
High Risk Investment Warning
Trading Forex/CFDs on margin carries a high level of risk and may not be suitable for all investors. Leverage can work against you.
Stratos Markets Limited (tradu.com ):
CFDs are complex instruments and come with a high risk of losing money rapidly due to leverage. 63% of retail investor accounts lose money when trading CFDs with this provider. You should consider whether you understand how CFDs work and whether you can afford to take the high risk of losing your money.
Stratos Europe Ltd (tradu.com ):
CFDs are complex instruments and come with a high risk of losing money rapidly due to leverage. 63% of retail investor accounts lose money when trading CFDs with this provider. You should consider whether you understand how CFDs work and whether you can afford to take the high risk of losing your money.
Stratos Global LLC (tradu.com ):
Losses can exceed deposits.
Please be advised that the information presented on TradingView is provided to Tradu (‘Company’, ‘we’) by a third-party provider (‘TFA Global Pte Ltd’). Please be reminded that you are solely responsible for the trading decisions on your account. There is a very high degree of risk involved in trading. Any information and/or content is intended entirely for research, educational and informational purposes only and does not constitute investment or consultation advice or investment strategy. The information is not tailored to the investment needs of any specific person and therefore does not involve a consideration of any of the investment objectives, financial situation or needs of any viewer that may receive it. Kindly also note that past performance is not a reliable indicator of future results. Actual results may differ materially from those anticipated in forward-looking or past performance statements. We assume no liability as to the accuracy or completeness of any of the information and/or content provided herein and the Company cannot be held responsible for any omission, mistake nor for any loss or damage including without limitation to any loss of profit which may arise from reliance on any information supplied by TFA Global Pte Ltd.
The speaker(s) is neither an employee, agent nor representative of Tradu and is therefore acting independently. The opinions given are their own, constitute general market commentary, and do not constitute the opinion or advice of Tradu or any form of personal or investment advice. Tradu neither endorses nor guarantees offerings of third-party speakers, nor is Tradu responsible for the content, veracity or opinions of third-party speakers, presenters or participants.

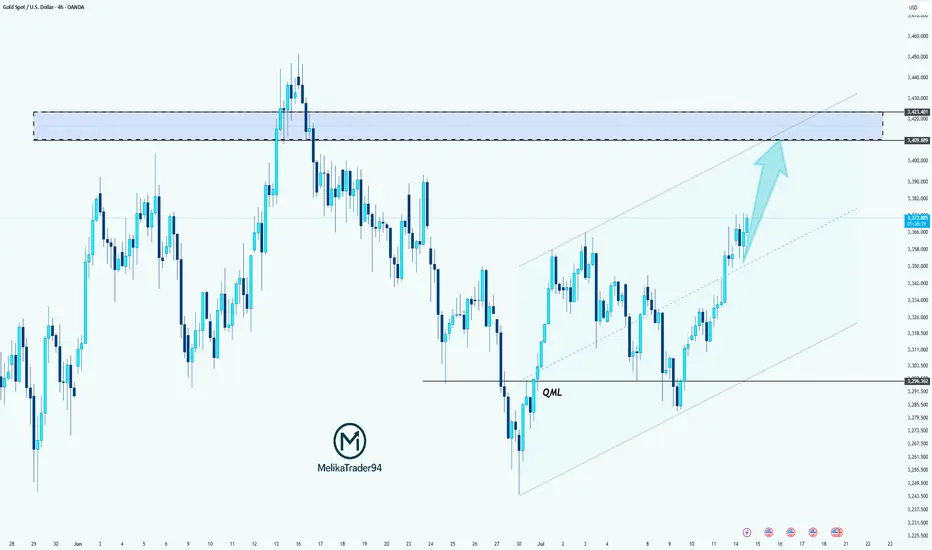
Gold Aiming Higher: Bullish Momentum Toward Key S&D ZoneHello guys!
The main bullish trend remains intact on Gold. After forming a solid base near the QML level, price has been respecting the ascending channel structure and is now pushing toward the upper boundary of that channel.
The current price action shows strength and momentum, and with the recent breakout above the midline of the channel, it signals that buyers are likely to push price toward the next key area of interest.
The target is clearly defined: the supply zone around 3409–3423, which has previously acted as a major resistance area.
Core idea:
Main trend: Bullish
Structure: Ascending channel
Support confirmed: QML zone bounce
Current behavior: Price moving along the top of the channel
Target: 3409–3423 supply zone
GOLD → Consolidation. Long squeeze before growth to 3400FX:XAUUSD has broken through resistance at 3353-3357 since the session opened, and bulls are currently trying to keep the market in the buying zone. Should we expect a long squeeze before growth?
Gold is in local consolidation after breaking through a key level. The price is still in the consolidation phase formed during a week-and-a-half correction. The price reached a three-week high of $3,374 on Monday but fell after the EU's conciliatory statements. Investors are awaiting US inflation data and Chinese GDP figures as they assess the prospects for a Fed rate cut. Heightened geopolitical and trade tensions are keeping demand for safe-haven assets high.
Technically, gold has entered a local buying zone, but there is a fairly complex resistance zone above it, and consolidation is needed to break through it. Such patterns could include a retest of support and a liquidity grab before growth.
Resistance levels: 3373, 3394
Support levels: 3357, 3353, 3345
There is a possibility of a retest of eql 3353 in a long squeeze format and a return to resistance at 3373 for a breakout. I also do not rule out a retest of the key level of 3345. The global trend is bullish, with the price locally in a fairly wide range, with an emphasis on the support zone of 3345-3355. If the bulls can hold this zone overall, the market will have a good chance of rising to 3400-3450
Best regards, R. Linda!
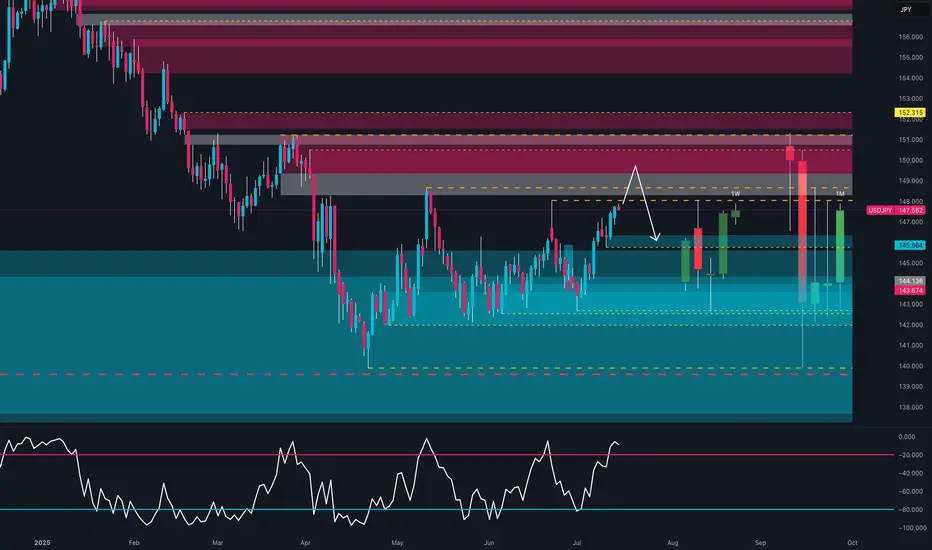
USDJPY – Tactical Short in Weekly Supply or Bullish Breakout?COT & MACRO FLOW (Commitment of Traders)
USD INDEX
Non-commercials still biased short: Longs 16,208 vs Shorts 20,194 (slightly improved, but still negative).
Commercials remain net long, but the open interest is declining → no strong conviction from smart money.
JPY
Non-commercials added significantly to their short exposure (+6,751), while cutting longs (-4,432).
Commercials also cut long exposure heavily (-20,405).
The structure shows institutional bias is clearly bearish on JPY.
Conclusion: JPY weakness confirmed by both commercial and non-commercial flows. USD slightly weaker, but JPY is weaker → supports USDJPY bullish bias.
SEASONALITY (JULY)
USD/JPY tends to be weak in July across most historical averages (5y, 10y, 15y, 20y).
July is historically bearish for USDJPY, especially in the second half of the month.
This seasonality contrasts with COT flows → mixed bias.
RETAIL SENTIMENT
60% of retail traders are SHORT → supports contrarian long view.
Retail volume shows imbalance in positioning, another contrarian bullish signal.
📈 TECHNICAL ANALYSIS (DAILY CHART)
Price is testing a key weekly FVG zone between 148.4 and 149.2.
RSI has re-entered the overbought region, suggesting potential exhaustion.
Price bounced from the monthly bullish order block (143.5–144.0).
A clear move above 149.50 could invalidate short setups.
🧩 TRADE IDEA (SETUP)
Watch for price to retest 148.4–149.50 zone and react.
RSI divergence + seasonality could offer a short opportunity with confirmation (e.g. engulfing on Daily/H4).
If price breaks above 149.5 with volume → look for continuation to 152.00.
✅ FINAL BIAS
Macro and institutional flows remain in favor of USDJPY longs, but:
Seasonality turns bearish in the second half of July
Price is reaching strong resistance
Retail sentiment supports the long thesis
→ Tactical Short from 149-150 only with confirmation. Otherwise, long continuation above 150.
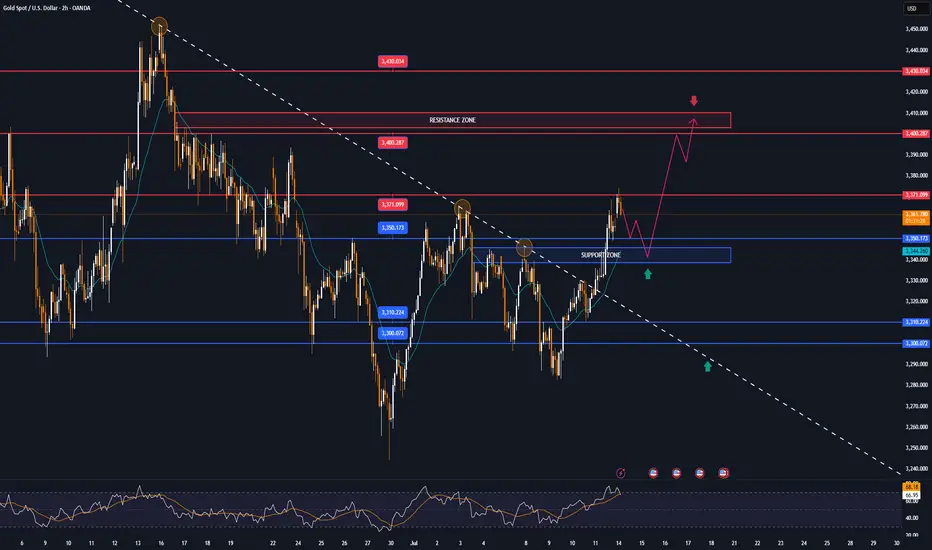
GOLD again targets $3,371, new bullish cycle conditionToday (Tuesday, July 15), in the Asian market, the spot OANDA:XAUUSD maintained a slight recovery trend, currently at around 3,360 USD/ounce.
The spot OANDA:XAUUSD rose to a 3-week high on Monday, but quickly fell back and finally closed lower. Trump's open attitude towards trade negotiations has improved the market's risk-on sentiment and negatively impacted gold, a safe-haven asset. But gold still has a lot of potential risks for price increases, and personally, the fundamental trend for gold has not changed.
The US Bureau of Labor Statistics will release its June Consumer Price Index (CPI) report today (Tuesday).
According to a Reuters survey, economists expect the US CPI to increase year-on-year in June to 2.7% from 2.4% the previous month, while the core CPI is expected to increase year-on-year to 3% from 2.8%.
The survey also showed that the US CPI is expected to increase 0.3% month-on-month in June, and the core CPI is also expected to increase 0.3% month-on-month.
According to the Chicago Mercantile Exchange's "FedWatch Tool", the market believes that the Fed is unlikely to cut interest rates in July and the probability of keeping interest rates unchanged in September is about 30%.
If the US core CPI rises by 0.4% or more in June, this could prompt market participants to reassess the possibility of a rate cut in September. In this case, the US Dollar could hold steady and push gold prices lower. On the other hand, if the data is lower than expected, gold will become more attractive while a weaker Dollar will be positive for gold prices.
Technical Outlook Analysis OANDA:XAUUSD
After gold reached the resistance target of attention to readers in the weekly publication at 3,371 USD, which is the location of the 0.236% Fibonacci retracement, it fell slightly but is now recovering positively.
Currently, gold is trading in the range of 3,360 USD, the price action above the lower edge of the long-term rising price channel with support from the EMA21, gold is now likely to continue to retest the 0.236% Fibonacci retracement level.
If gold breaks above $3,371 it will be eligible for a new bullish cycle, with the target then being around $3,400 in the short term, more so than $3,430.
On the other hand, the RSI is pointing up, maintaining activity above 50, and this should be considered a positive signal in terms of momentum. It shows that there is still a lot of room for growth ahead.
However, as of now, gold is still neutral in terms of trend, with conditions gradually tilting towards the possibility of price increase.
Along with that, the notable positions will be listed as follows.
Support: $3,350 – $3,340 – $3,310
Resistance: $3,371 – $3,400 – $3,430
SELL XAUUSD PRICE 3390 - 3388⚡️
↠↠ Stop Loss 3394
→Take Profit 1 3382
↨
→Take Profit 2 3376
BUY XAUUSD PRICE 3304 - 3306⚡️
↠↠ Stop Loss 3300
→Take Profit 1 3312
↨
→Take Profit 2 3318
Gold (XAU/USD) 4H: Bullish Continuation Play- 15 July 20244‑Hour Technical Outlook — Bullish Bias Above Key BOS Zone
Gold remains in a strong structural uptrend on the 4‑hour chart, carving out a sequence of higher highs and higher lows. Price is consolidating just below recent swing highs around $3,360, suggesting accumulation after last week’s impulsive rally.
We saw a Break of Structure (BOS) above $3,340, confirming bullish control and establishing that area as a critical flip zone. Unless price closes decisively below that BOS, the directional bias remains bullish.
📐 Key Confluences & Zones on 4‑Hour
🔹 Fibonacci Retracement (Swing: $3,280 → $3,360):
38.2%: ~$3,331 — aligns perfectly with BOS & prior resistance turned support.
61.8%: ~$3,313 — deeper, but still within bullish context.
🔹 Supply & Demand Zones:
Supply (Resistance): $3,355–$3,360 — recent highs, likely containing resting sell‑side liquidity.
Demand (Support): $3,331–$3,335 — a bullish order block and fair value gap (imbalance) reside here.
Deeper Demand: $3,313–$3,315 — secondary buy zone if the market hunts liquidity deeper.
🔹 Liquidity Profile:
Buy‑side stops likely rest above $3,360 — breakout target.
Sell‑side liquidity below $3,331 could trigger a shakeout before higher.
🧠 ICT/SMC Concepts Observed:
✅ BOS confirmed at $3,340, favoring longs.
✅ FVG/imbalance between $3,338–$3,342 suggests price may “fill” before next impulse.
✅ Recent wick above $3,355 hints at minor buy‑side liquidity grab — but no confirmed CHoCH (change of character) yet.
✅ Bullish order block formed at $3,331–$3,333, acting as strong support.
📈 1‑Hour Intraday Playbook — Aligned With Bullish Bias
On the 1‑hour chart, momentum remains constructive above $3,331. Intraday traders can look for these setups:
1️⃣ Buy the Retest
Entry: $3,335 (within 4H OB & FVG)
Stop‑loss: $3,327 (below demand)
Targets:
🔸 T1: $3,355
🔸 T2: $3,380 (next resistance)
2️⃣ Breakout Long
Entry: Break and close above $3,360
Stop‑loss: $3,350
Targets:
🔸 T1: $3,380
🔸 T2: $3,406 (1.272 Fib ext.)
3️⃣ Deeper Pullback Buy
Entry: $3,313–$3,315 (61.8% Fib + deeper demand)
Stop‑loss: $3,305
Targets: back toward $3,355–$3,380
🎯 The Golden Setup:
✅ Long from $3,335, stop‑loss $3,327, targeting $3,355–$3,380.
Why? This setup aligns BOS, bullish OB, FVG, 38.2% Fib, and current trend structure — highest confluence and best risk/reward ratio (~1:3).
🔎 Summary Table — Key Levels for Today
📈 Bullish Continuation Above $3,331
🟢 Strong Buy Zone $3,331–$3,335
🟢 Deeper Demand $3,313–$3,315
🔴 Resistance / Supply $3,355–$3,360
🚨 Bullish Invalidation Below $3,331
Bias remains bullish as long as $3,331 holds. Look for reaction in the $3,331–$3,335 zone to join institutional flows.

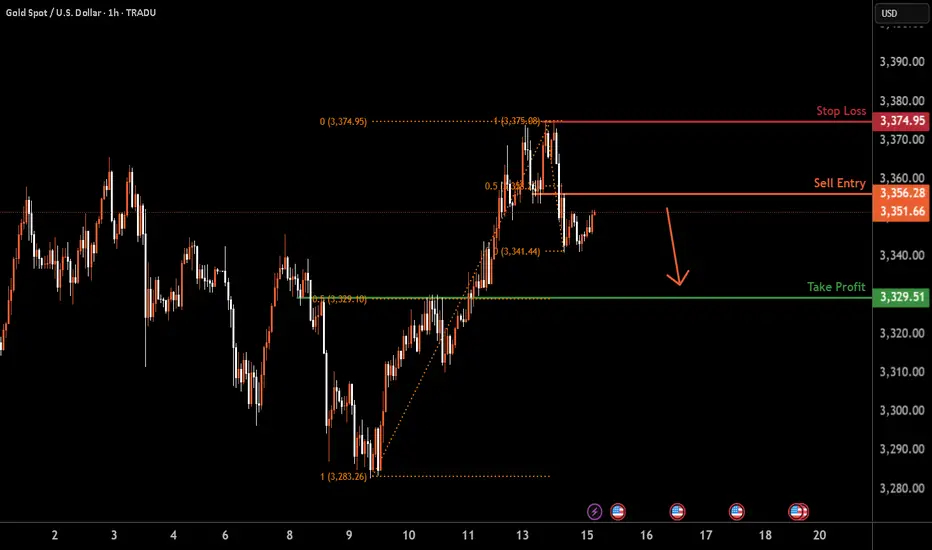
XAUUSD H1 I Bearish Reversal Off Based on the H1 chart analysis, we can see that the price is rising toward our sell entry at 3356.28, which is a pullback resistance that aligns closely with the 50% FIb retracement.
Our take profit will be at 3329.51, a pullback support level that aligns with the 50% Fib retracement.
The stop loss will be placed at 3374.95, a swing-high resistance level.
High Risk Investment Warning
Trading Forex/CFDs on margin carries a high level of risk and may not be suitable for all investors. Leverage can work against you.
Stratos Markets Limited (tradu.com ):
CFDs are complex instruments and come with a high risk of losing money rapidly due to leverage. 63% of retail investor accounts lose money when trading CFDs with this provider. You should consider whether you understand how CFDs work and whether you can afford to take the high risk of losing your money.
Stratos Europe Ltd (tradu.com ):
CFDs are complex instruments and come with a high risk of losing money rapidly due to leverage. 63% of retail investor accounts lose money when trading CFDs with this provider. You should consider whether you understand how CFDs work and whether you can afford to take the high risk of losing your money.
Stratos Global LLC (tradu.com ):
Losses can exceed deposits.
Please be advised that the information presented on TradingView is provided to Tradu (‘Company’, ‘we’) by a third-party provider (‘TFA Global Pte Ltd’). Please be reminded that you are solely responsible for the trading decisions on your account. There is a very high degree of risk involved in trading. Any information and/or content is intended entirely for research, educational and informational purposes only and does not constitute investment or consultation advice or investment strategy. The information is not tailored to the investment needs of any specific person and therefore does not involve a consideration of any of the investment objectives, financial situation or needs of any viewer that may receive it. Kindly also note that past performance is not a reliable indicator of future results. Actual results may differ materially from those anticipated in forward-looking or past performance statements. We assume no liability as to the accuracy or completeness of any of the information and/or content provided herein and the Company cannot be held responsible for any omission, mistake nor for any loss or damage including without limitation to any loss of profit which may arise from reliance on any information supplied by TFA Global Pte Ltd.
The speaker(s) is neither an employee, agent nor representative of Tradu and is therefore acting independently. The opinions given are their own, constitute general market commentary, and do not constitute the opinion or advice of Tradu or any form of personal or investment advice. Tradu neither endorses nor guarantees offerings of third-party speakers, nor is Tradu responsible for the content, veracity or opinions of third-party speakers, presenters or participants.
GOLD Local Rebound Ahead! Buy!
Hello,Traders!
GOLD made a retest of
The horizontal support
Level of 3343$ and as
We are locally bullish
Biases we will be expecting
A local bullish rebound
Buy!
Comment and subscribe to help us grow!
Check out other forecasts below too!
Disclosure: I am part of Trade Nation's Influencer program and receive a monthly fee for using their TradingView charts in my analysis.
Back above $3,300, GOLD may remain neutral, tax focusOANDA:XAUUSD reclaimed the psychologically important level of $3,300/ounce last week, but while gold is still receiving some support as a safe haven amid economic and geopolitical risks, its upside momentum may be limited as the market shifts its attention to other commodities.
Gold prices ended last week on a generally bullish note, rising back above $3,300 an ounce after US President Trump unexpectedly announced a series of new trade policies. Spot gold prices rose about 0.5% last week on Friday.
Although the market initially doubted Trump’s self-imposed July 9 deadline, the overall market reaction remained steady and the renewed risk appetite helped the S&P 500 hit a new record high, somewhat undermining gold’s safe-haven appeal. The July deadline has been pushed back to August 1, but the global trade conflict is far from over. Gold has regained support after initial pressure after Trump announced a new trade policy on copper imports, along with a series of news stories about the relationship between Trump and the FED sent to readers throughout the past week.
A sharp rise in copper prices will also add to inflationary pressures, exacerbate economic uncertainty and raise concerns about recession and stagflation. In this context, gold is expected to continue to receive support from potential risks.
In addition to fierce competition in the commodity market, gold may remain fundamentally neutral in the short term, as economic data will support the Fed's neutral monetary policy. The key market focus next week will be the June Consumer Price Index (CPI). The Fed has made it clear that it is in no rush to raise interest rates while inflation risks remain high.
However, traders still need to be cautious and closely monitor the situation surrounding the tariff war initiated by Trump, which will directly affect the price of gold. In case of negative news, the gold price will receive support and vice versa if positive news appears in the market.
Over the weekend, US President Trump once again used the tariff tactic, announcing that he would impose a 30% tax on imports from the EU and Mexico, causing a strong reaction from the international community. This move not only casts a shadow over the relationship between Europe and the United States, as well as between the United States and Mexico, but also adds further uncertainty to the global trade model. EU politicians, businesses and academics were quick to respond, calling for unity to protect their interests, while Mexico stressed the need to maintain national sovereignty and pledged to respond calmly.
Technical Outlook Analysis OANDA:XAUUSD
On the daily chart, gold has a 3-day rally, and the upside momentum has reached the important target resistance at the 0.236% Fibonacci retracement level. Gold's upside momentum is also limited by this Fibonacci retracement level, specifically it has slightly dropped to $3,355/oz.
But overall, gold is still not in a position to form a specific trend, and the indicators and positions are mainly showing the possibility of continuing to accumulate sideways.
For gold to have the conditions for a new bullish cycle, it needs to bring price activity above the 0.236% Fibonacci retracement level, then the target will be around $3,400 in the short term, more than $3,430.
Meanwhile, a pullback, which sees gold sell below the 0.382% Fibonacci retracement, would open the door to a bearish cycle, with a target of around $3,246 in the short term, rather than the 0.50% Fibonacci retracement.
RSI hovering around 50 also suggests a hesitant market sentiment, so the short-term bias for gold is neutral.
Along with that, notable positions will also be listed as follows.
Support: $3,350 – $3,310 – $3,300
Resistance: $3,371 – $3,400 – $3,430
SELL XAUUSD PRICE 3406 - 3404⚡️
↠↠ Stop Loss 3410
→Take Profit 1 3398
↨
→Take Profit 2 3392
BUY XAUUSD PRICE 3340 - 3342⚡️
↠↠ Stop Loss 3336
→Take Profit 1 3348
↨
→Take Profit 2 3354
Market Watch UPDATES! Stock Indices, Gold, Silver, US OILWelcome to the Market Watch Updates for Monday, July 14th.
In this video, we will give the forecast updates for the following markets:
S&P500, NASDAQ, DOW JONES, GOLD, SILVER and US OIL.
Enjoy!
May profits be upon you.
Leave any questions or comments in the comment section.
I appreciate any feedback from my viewers!
Like and/or subscribe if you want more accurate analysis.
Thank you so much!
Disclaimer:
I do not provide personal investment advice and I am not a qualified licensed investment advisor.
All information found here, including any ideas, opinions, views, predictions, forecasts, commentaries, suggestions, expressed or implied herein, are for informational, entertainment or educational purposes only and should not be construed as personal investment advice. While the information provided is believed to be accurate, it may include errors or inaccuracies.
I will not and cannot be held liable for any actions you take as a result of anything you read here.
Conduct your own due diligence, or consult a licensed financial advisor or broker before making any and all investment decisions. Any investments, trades, speculations, or decisions made on the basis of any information found on this channel, expressed or implied herein, are committed at your own risk, financial or otherwise.

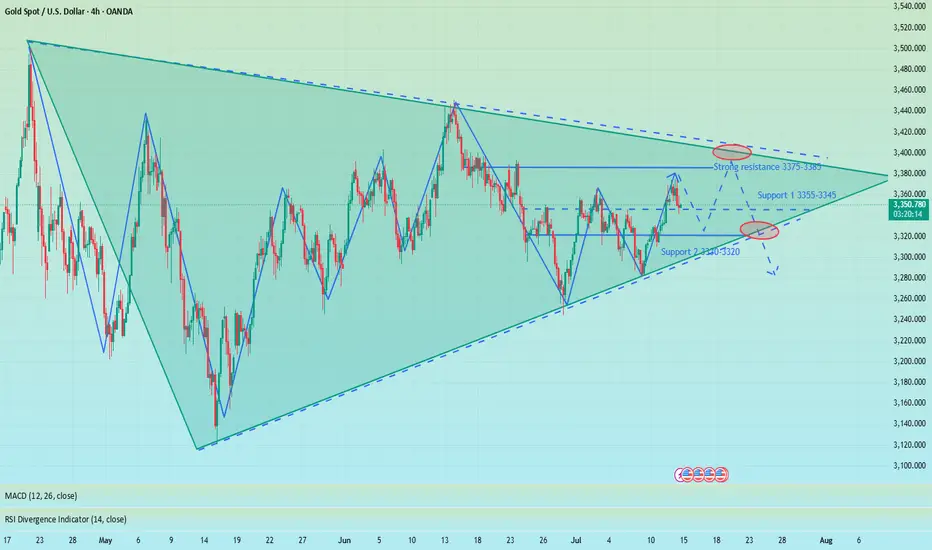
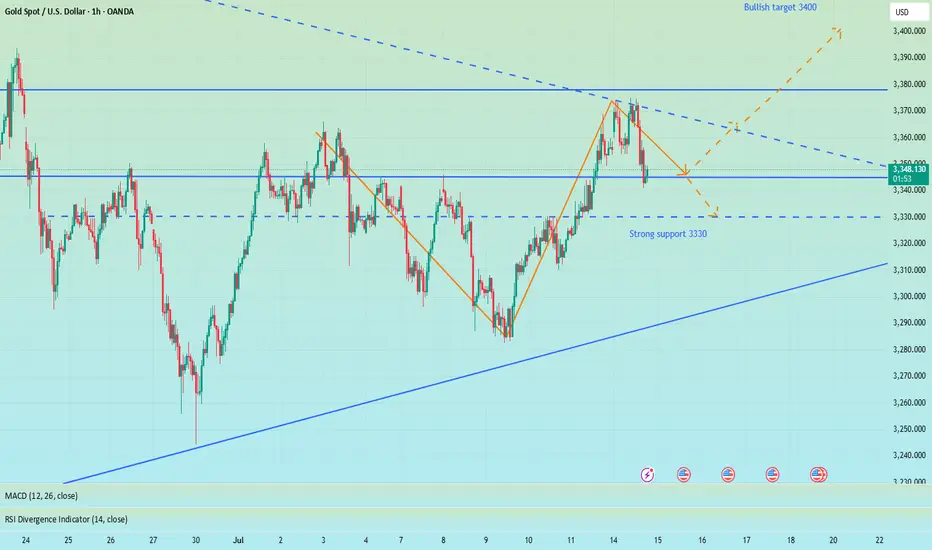
Today's summary and tomorrow's market forecast📰 News information:
1. Focus on tomorrow's CPI data
2. Bowman's speech at the Federal Reserve
3. Tariff information outflows and countries' responses to tariff issues
📈 Technical Analysis:
Bros, I had some things to deal with just now so I went out for a while. Now I come back to share my ideas. When the market is blindly chasing longs, I chose to give a bearish trading opportunity. I know that after I proposed the idea of shorting to test the support level of 3340-3330 below, many people were skeptical and even looked at it with a sarcastic attitude. After all, most people in the market are long. But facts and results have proved that only by following the trend can there be better room for operation. When doing transactions, you must first have a clear goal. Those who follow the crowd will often only blame their mistakes on others or luck.
Regarding the arrangements for future trading, first of all, 3375-3385 above is still an important short-term resistance. If today's closing is above 3360, then 3375 will most likely be tested again during the Asia-Europe trading session. Once it goes up again, it is very likely to break through the resistance area of 3375-3385. Before the US data, the price may stay at 3390 or 3400. On the contrary, if today's closing is below 3360, then the price still has room for adjustment. In this way, 3340 will not be the low point of this week. The bearish volatility in the Asian and European sessions will also test the strong support of 3330-3320.
In addition to investment, life also includes poetry, distant places, and Allen. Facing the market is actually facing yourself, correcting your shortcomings, facing your mistakes, and exercising strict self-discipline. I share free trading strategies and analysis ideas every day for reference by brothers. I hope my analysis can help you.
OANDA:XAUUSD PEPPERSTONE:XAUUSD FOREXCOM:XAUUSD FX:XAUUSD TVC:GOLD FXOPEN:XAUUSD
The Gold Retrace for Ultimate Entry!looking for price to continue with its pullback to find where exactly support is. Once we see price establish support we should get some type of signal for entry and price can continue with this bullish price action to make new highs. If we get a full 71.8% pullback that should make for a nice bull run. Just need to wait for the confirmations first before reacting cause we might get a lot of chop until then.
