Gold 30Min Engaged ( Reversal Entry's Detected )Time Frame: 30-Minute Warfare
Entry Protocol: Only after volume-verified breakout
🩸Bullish Reversal 3285 : 3272 Zone
🩸Bearish Reversal 3326 : 3334 Zone
➗ Hanzo Protocol: Volume-Tiered Entry Authority
➕ Zone Activated: Dynamic market pressure detected.
The level isn’t just price — it’s a memory of where they moved size.
Volume is rising beneath the surface — not noise, but preparation.
🔥 Tactical Note:
We wait for the energy signature — when volume betrays intention.
The trap gets set. The weak follow. We execute.
Gold 30Min Engaged ( Reversal Entry's Detected )
Metals

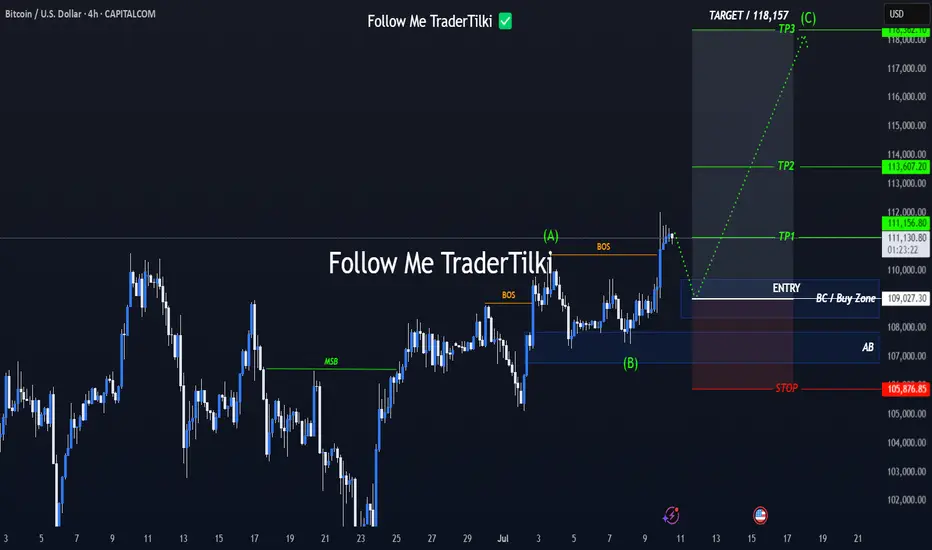
109K Launch Zone? Bitcoin Update Now LiveHey everyone,
Here's my latest Bitcoin analysis for you. The current price action is unfolding within an ABC corrective wave.
🔍 I've identified the optimal buy zone between 108,349 and 109,682.
📉 Once the price pulls back into this range, my limit orders will be triggered and the position will open.
🎯 In this scenario, my target level is 118,157.
Below are the exact levels for my entry, targets, and stop-loss:
- 🟩 Entry Level: 109,027
- 🟥 Stop-Loss: 105,876
- 🎯 TP1: 111,156
- 🎯 TP2: 113,607
- 🎯 TP3: 118,362
- ⚖️ Risk/Reward Ratio: 3.00
(This is based on a swing trade model, so reaching this level may take some time)
--------
Your likes and support are what keep me motivated to share these analyses consistently.
Huge thanks to everyone who shows love and appreciation! 🙏
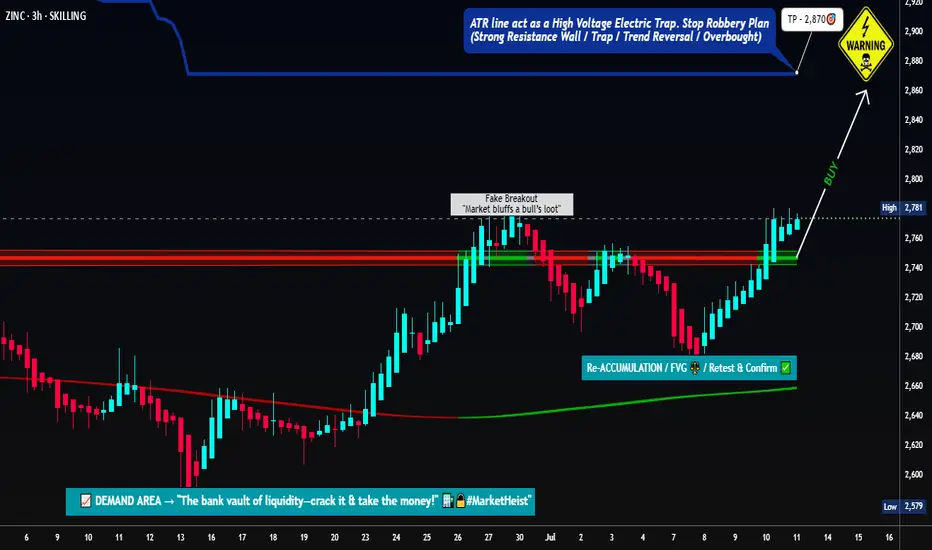
"XZN/USD: Last Chance to Buy Before Rally!"🚨 "The Zinc Heist" – XZN/USD Master Looting Plan (Thief Trading Style) 🚨
💰 Steal Like a Pro – Bullish Breakout Strategy for Maximum Profit! 💰
🔥 THIEF TRADING ALERT: XZN/USD METAL MARKET ROBBERY IN PROGRESS! 🔥
🚨 Attention, Money Makers & Market Robbers! 🚨
Based on the 🔥Thief Trading Method🔥, we’ve cracked the code for XZN/USD ("The Zinc") – and the vault is WIDE OPEN! 🏦💎 This is your chance to join the heist and escape with massive profits!
📜 THE MASTER HEIST PLAN (Day/Swing Trade) 📜
🎯 Mission: LONG ENTRY – Swipe the bullish loot before the market reverses!
⚠️ Danger Zone: Overbought market, consolidation, and Electric Trap where bears lurk! Escape before they strike!
🔑 ENTRY STRATEGY (How to Loot Like a Pro):
"The vault is open!" – Enter at any price, but smart thieves use limit orders!
Best Heist Tactics:
Buy Limit Orders within 15-30 min near swing lows/highs (pullback entries).
DCA / Layering Strategy – Multiple limit orders for maximum loot!
🛑 STOP-LOSS (Escape Plan If the Heist Goes Wrong):
Thief SL: Nearest swing low (candle body/wick) on 3H TF (2700).
Risk Management: Adjust SL based on your trade size, risk tolerance, and number of orders.
🎯 TARGETS (Where to Cash Out & Flee!):
First Escape: 2870 (or exit early if the market turns risky!).
Scalpers’ Quick Loot: Only trade LONG! Use trailing SL to protect profits!
📡 WHY THIS HEIST WILL WORK (Bullish Triggers!):
✅ Strong Bullish Momentum – Market is primed for a breakout!
✅ Fundamental Backing – Macro trends, COT data, and sentiment favor bulls!
✅ Intermarket Confirmation – Metals sector heating up!
🔗 Want the FULL robbery blueprint?
👉 Check Fundamental Reports, COT Data, Sentiment Analysis & More!
🚨 TRADING ALERT: NEWS & POSITION SAFETY! 🚨
⚠️ WARNING: High-impact news can wreck the heist! Protect your loot:
Avoid new trades during news!
Use TRAILING SL to lock profits & dodge volatility!
💥 BOOST THIS HEIST! 💥
🚀 Hit the LIKE & BOOST button to strengthen our robbery squad!
💸 More likes = More heists = More profits for YOU!
🎉 Stay tuned – Next heist coming soon! 🎉
⚠️ DISCLAIMER (Stay Out of Jail!):
📌 Not financial advice! Your money, your risk.
📌 Markets change FAST! Always DYOR before trading.
🔥 Ready to Rob the Market? Let’s Get That Bag! 🔥
🚀 LIKE, SHARE & FOLLOW FOR MORE HEISTS! 🚀
#Trading #XZNUSD #ZincHeist #ThiefTrading #BullishBreakout #MarketRobbery #ProfitPlan
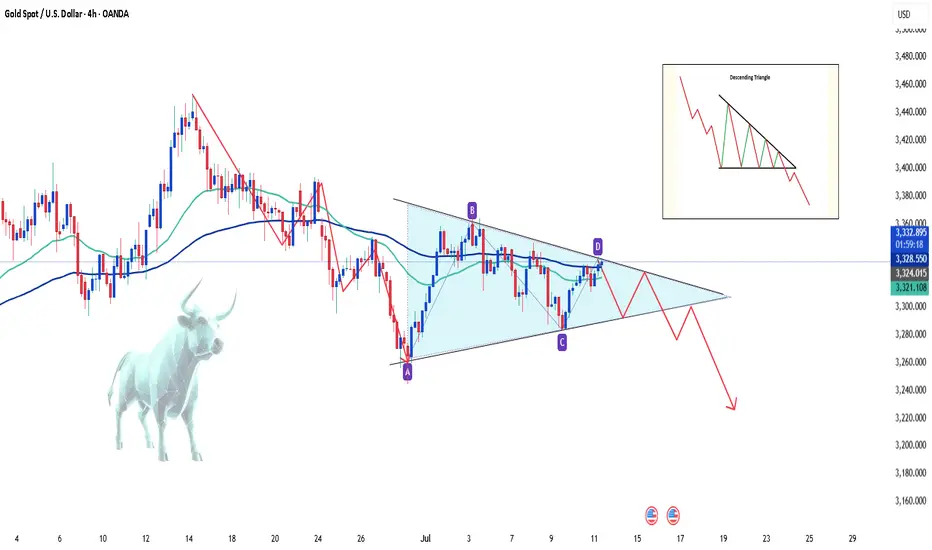
XAUUSD - Sell or Buy ? Hello everyone, great to see you again!
Today, OANDA:XAUUSD remains under notable pressure as the U.S. continues to signal a tougher trade stance. The latest move: the U.S. President announced a 50% import tariff on copper and a potential 200% tariff on pharmaceuticals, following a previous tariff notice ranging from 25% to 40% sent to 14 countries — including Japan, South Korea, Thailand, and Malaysia.
This isn’t just about protectionism. These measures fuel fears of global inflation, supply chain disruptions, and a broader economic slowdown. With surging prices in raw materials and essential goods, consumers may be forced to cut back spending, a classic warning sign for future growth.
In this environment, investors had hoped gold would shine again as a safe haven asset. However, the recent bullish momentum has been underwhelming, signaling ongoing market hesitation.
📉 On the H4 chart, XAUUSD is being squeezed into a descending pattern, which typically carries a high probability of a downside breakout. If the current support fails, the next target could fall below the 32xx area.
On the flip side, if supportive news emerges — such as a hint of rate cuts from the Fed — gold must break above the $3,335 level to revive bullish sentiment.
🔎 What do you think? Will gold break lower — or bounce back? Drop your thoughts below!
Everybody loves Gold Part 7Great trading last week. Gold really pushing deep into blues.
This week takes a downturn with possibilities highlighted on the chart; all pointing towards LOS (Level of significance). This level is calculated based on previous week high-low values.
Trade parameters:
1. SL: 50-100pips
2. TP: 3-4x SL
3. double tops/bottom (around LOS) are direction changers.
As always price action determines trades
GOLD continues to recover, tariff war changes unpredictablyInternational OANDA:XAUUSD continued to rise, boosted by a slight decline in the US Dollar and US Treasury yields. At the same time, investors are closely monitoring the developments in trade negotiations as US President Trump expands the tariff war.
As of the time of writing, spot OANDA:XAUUSD increased by 0.3% to 3,333 USD/oz. The general weakness of the US Dollar, the decline in US Treasury yields and renewed concerns about the escalation of the trade war have helped stabilize gold prices.
On Thursday evening (July 10) local time, US President Donald Trump once again increased pressure on trading partners. He announced that he would impose a 35% tariff on imported goods from Canada, and the USD/CAD exchange rate rose sharply in the short term.
Trump posted on his social media platform Truth Social that a 35% tariff would be imposed on imported goods from Canada, effective from August 1, 2025.
It is still unclear whether the current exemptions for goods traded under the United States-Mexico-Canada Agreement (USMCA) will be extended or terminated.
Due to the impact of escalating trade tensions, spot gold prices also rose by more than 10 dollars in the short term at the beginning of the Asian trading session on Friday, and the current high price of gold has reached around 3,336 USD/ounce.
In an interview with NBC News on Thursday, Trump said he was also considering imposing a flat tariff of 15% to 20% on most of his trading partners, adding that the exact tariff rate was being worked out. The current flat tariff rate is 10%.
Trump sent letters to trading partners this week, announcing that the new tariffs would take effect on August 1 if they could not negotiate more favorable terms. He is expected to send letters to European Union member states soon.
Trump sent the first batch of tariff letters to 14 countries, including Japan and South Korea, on July 7, with tariffs ranging from 25% to 40%. He also said he would send more similar letters this week.
Minutes from the Fed's June 17-18 meeting showed that only a "few" Fed officials thought a rate cut was possible as early as this month, while most preferred to hold off until later in the year due to inflation concerns caused by Trump's tariffs.
The Federal Open Market Committee (FOMC) voted unanimously to leave interest rates unchanged at its June meeting. The next policy meeting is scheduled for July 29-30.
Markets will focus on progress in Trump's tariff negotiations, key US economic data and speeches by Federal Reserve officials later in the day for fresh trading direction for gold prices.
Technical Outlook Analysis OANDA:XAUUSD
Gold has had 2 sessions of recovery from the area around the 0.382% Fibonacci retracement, but the temporary upside momentum is still limited and does not qualify for a new bullish cycle.
In the short term, the EMA21 with the 0.236% Fibonacci retracement will act as the nearest resistance, if gold takes the price action to break above the 0.236% Fibonacci retracement level it will qualify for a new bullish cycle with the target then being around $3,400 in the short term, more so than $3,430.
On the other hand, with the current neutral trend, once gold is sold below the 0.382% Fibonacci retracement level again, it will have conditions to decline, and the target then is around 3,246 USD in the short term, more than the 0.50% Fibonacci retracement level.
The RSI index is hovering around 50, also showing that the market sentiment is still hesitant to have a specific direction.
During the day, the sideways trend of gold prices will be noticed by the following positions.
Support: 3,300 - 3,292 USD
Resistance: 3,340 - 3,350 - 3,371 USD
SELL XAUUSD PRICE 3388 - 3386⚡️
↠↠ Stop Loss 3392
→Take Profit 1 3380
↨
→Take Profit 2 3372
BUY XAUUSD PRICE 3296 - 3298⚡️
↠↠ Stop Loss 3292
→Take Profit 1 3304
↨
→Take Profit 2 3310
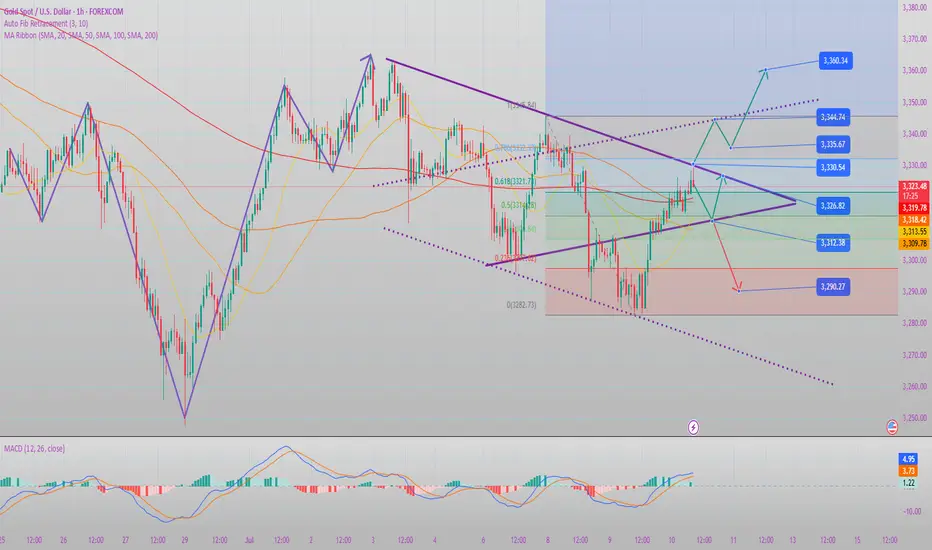
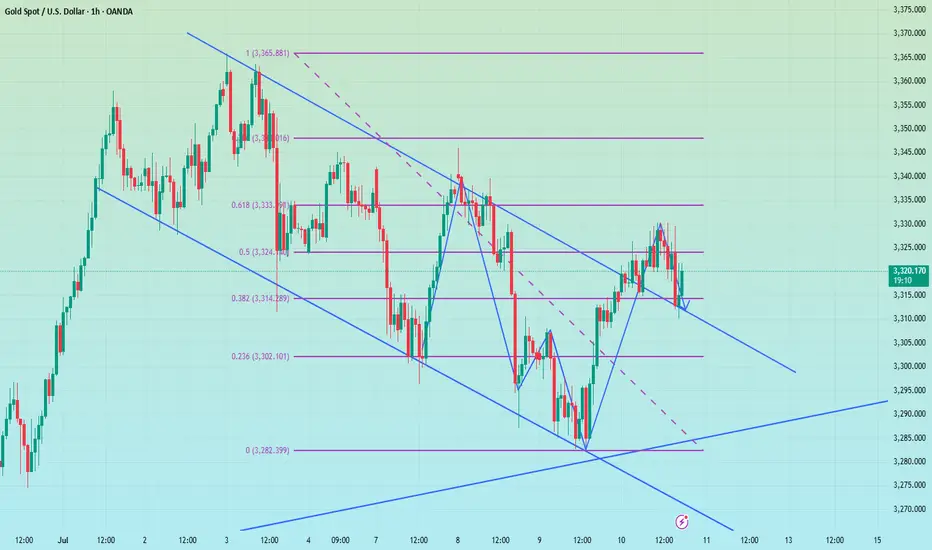
Gold. Swing trade setup 11/July/25XAUUSD. Based on latest 'speed' of chart "touching" those trendlines, gold probably having a triangle base now..before moving toward 3460 +/-...

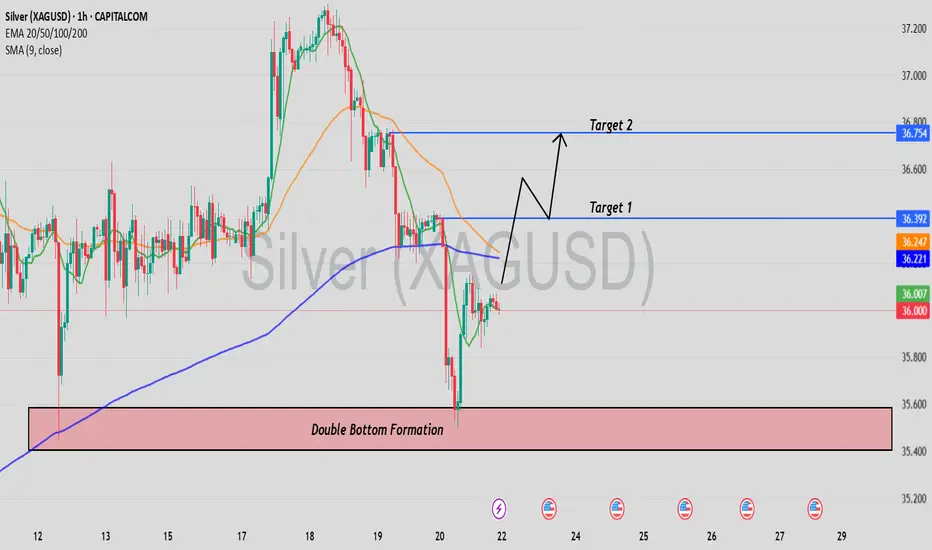
XAG/USD (Silver) - Triangle Breakout (09.07.2025)The XAG/USD (Silver) pair on the M30 timeframe presents a Potential Buying Opportunity due to a recent Formation of a Wedge Breakout Pattern. This suggests a shift in momentum towards the upside and a higher likelihood of further advances in the coming hours.
Possible Long Trade:
Entry: Consider Entering A Long Position around Trendline Of The Pattern.
Target Levels:
1st Resistance – 3749
2nd Resistance – 3781
🎁 Please hit the like button and
🎁 Leave a comment to support for My Post !
Your likes and comments are incredibly motivating and will encourage me to share more analysis with you.
Best Regards, KABHI_TA_TRADING
Thank you.
Disclosure: I am part of Trade Nation's Influencer program and receive a monthly fee for using their TradingView charts in my analysis

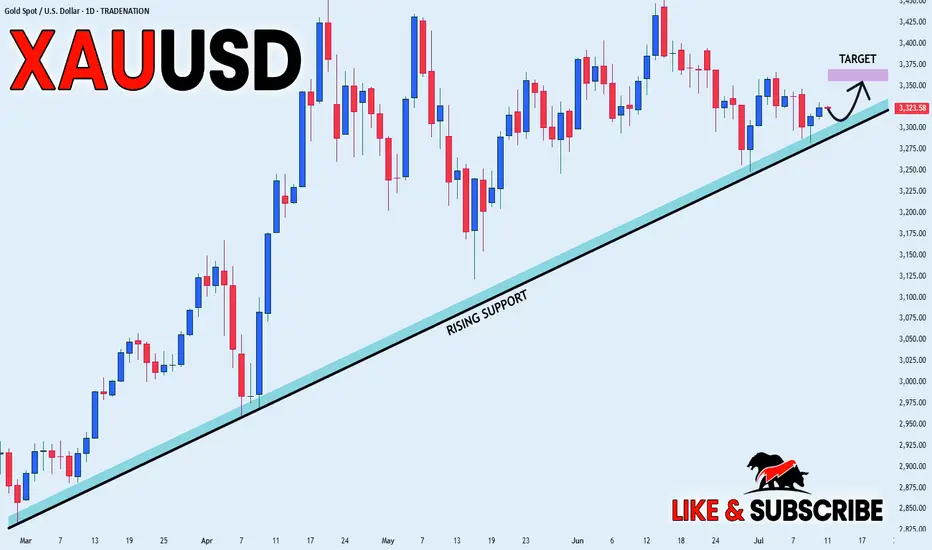
GOLD SWING LONG|
✅GOLD is trading in a strong
Long-term uptrend along the
Rising support line so we are
Bullish biased and after the price
Breakout of the local opening wedge
We we will be expecting a
Further bullish move up
LONG🚀
✅Like and subscribe to never miss a new idea!✅
Disclosure: I am part of Trade Nation's Influencer program and receive a monthly fee for using their TradingView charts in my analysis.
Silver is Again in the Bullish directionHello Traders
In This Chart XAGUSD HOURLY Forex Forecast By FOREX PLANET
today XAGUSD analysis 👆
🟢This Chart includes_ (XAGUSD market update)
🟢What is The Next Opportunity on XAGUSD Market
🟢how to Enter to the Valid Entry With Assurance Profit
This CHART is For Trader's that Want to Improve Their Technical Analysis Skills and Their Trading By Understanding How To Analyze The Market Using Multiple Timeframes and Understanding The Bigger Picture on the Charts
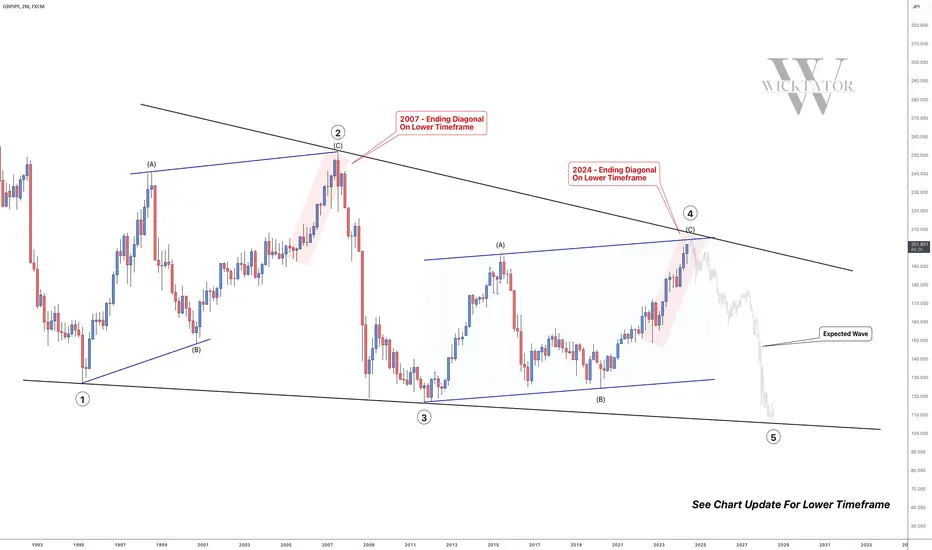
GBPJPY - Multi Year SHORTS Coming! (Over 10,000pips)Here we have the 2 month chart of GBPJPY. We can see that we're in a massive ending diagonal made up of 5 waves.
We are currently on wave 4 and have almost completed. At the moment we are working within the parameters of a channel however we must be aware that we may exceed the channel. The channel is just there for us to use as a guideline.
In 2007, we have a really nice ending diagonal (expanding) before we made that ridiculous +13k pip drop.
See below for the 2D GBPJPY chart from 2007:
We can see that the lower timeframe diagonal broke down beautifully.
We are anticipating something similar this time round!
See below for the 2D GBPJPY chart of the current diagonal:
We've got an almost identical price action as 2007. We just got to wait a little and watch for the break of the red trendline and enter and hold.
See below for the 2week chart of GBPJPY:
Trade Idea:
- Watch for a break of the ending diagonal
- Alternatively, you can wait for a pullback after the ending diagonal breaks
- stop loss above highs once entry trendline breaks
- Swing Target: 100 (10,000pips)
What do you guys think?
Goodluck and as always, trade safe!
GBPJPY - Multi-Year Short Update! In our last setup for GBPJPY, we identified a massive diagonal pattern, with price completing wave 4 and preparing for a multi-year drop into wave 5.
Since then, price has played out exactly as forecasted — we've seen a clean impulse lower for wave 1, followed by an ABC correction for wave 2, which looks to have now completed.
This sets the stage for the next major leg — wave 3 of 5 — which historically carries the most power and momentum.
📉 See monthly chart here:
📊 GBP/JPY Wave‑3 Trade Idea
Background:
We’ve completed wave 1 down and wave 2 up (ABC correction).
GBPJPY is now positioned to start a powerful wave 3 down — the most impulsive leg in an Elliott sequence.
🔍 Current Price Action:
Price is rejecting major resistance (previous wave A high + shaded zone)
Structure shows a completed 5-wave move up within C, suggesting exhaustion.
A clean ascending trendline (red) has formed under wave v — a break here signals the first confirmation.
Option 1 – Aggressive Entry:
- Trigger: Break and close below the red trendline (~198.00–197.80 zone) on the daily.
- Entry: On candle close below trendline
- Stop Loss: Above recent high ~199.80 and then breakeven once we move lower
Option 2 – Conservative Entry (preferred):
- Trigger: Trendline break + correction
- Entry: On bearish confirmation and then a correction to indicate further downside
- Stop Loss: Above recent high ~199.80 and then breakeven once we move lower
Take Profit Levels:
- TP1: 192
- TP2: 180
- TP3: 175
- Final Target: Trail for extended move toward wave (3) lows (could be 10,000+ pips over long term)
🔐 Invalidation:
Daily close back above 200.00 or impulsive rally beyond the pink resistance zone invalidates the short bias in the short term.
✅ Summary:
This is a high-conviction, structure-backed setup with:
- Wave count + Fib confluence
- Bearish structure at key resistance
- Confirmation-based trigger (trendline break + retest)
- Excellent long-term risk-to-reward profile
📂 Previous GBPJPY Setups (Track Record):
📌 Free Setup (Big Picture Outlook) – Multi-Year Shorts Incoming (Wave 4 Completion)
✅ Swing 1 – 1,200 Pips (VIP GBPJPY Long)
✅ Swing 2 – 1,000 Pips (VIP GBPJPY Short)
✅ Swing 3 – 1,100 Pips (VIP GBPJPY Short)
✅ Swing 4 – 700 Pips (VIP GBPJPY Short)

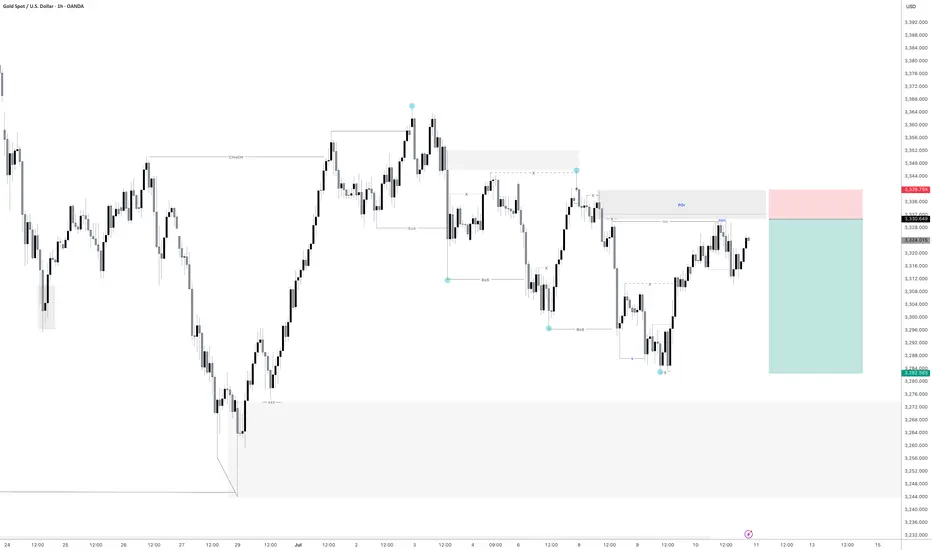
Gold - Sell inboundGold is looking very promising for another sell off. we are already showing signs that price has intent to move lower with some lower timeframe break of structure.
Just waiting for a manipulation now of the most recent highs put in before price moves lower.
Let's see if we get an entry tonight.
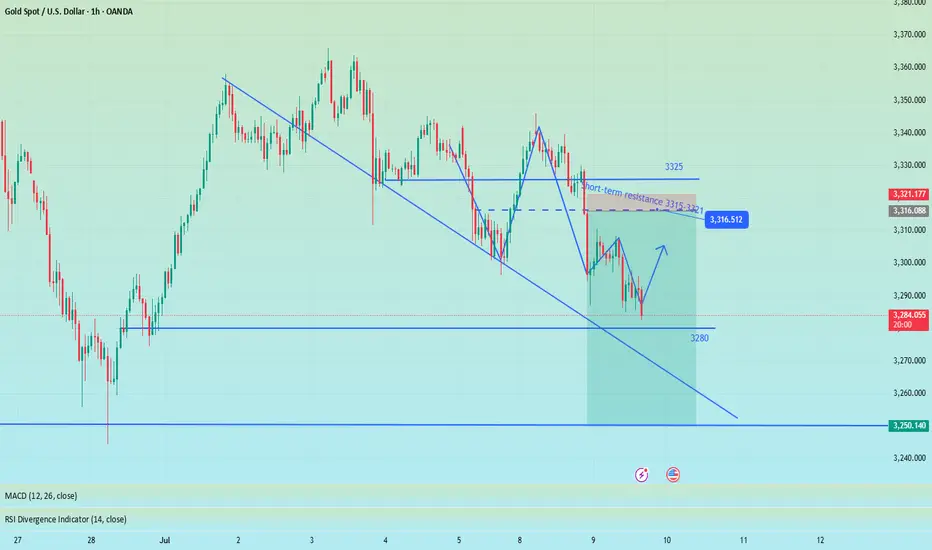
The latest gold analysis and strategy on July 10:
Core logic of the market
Risk aversion supports gold prices: Trump postponed tariffs but threatened to increase them in the future. Market concerns about trade frictions remain, and gold is still supported as a safe-haven asset.
Impact of the US dollar trend: If trade tensions escalate, the US dollar may be under pressure, which is further beneficial to gold.
Technical side is bullish and volatile: The daily line closed positive and stabilized the lower Bollinger track. The H4 cycle rebounded with consecutive positives, but it has not yet broken through the key resistance of 3345. Be wary of repeated fluctuations.
Key point analysis
Support level: 3310-3300 (short-term), 3285 (strong support)
Resistance level: 3340-3345 (Daily Bollinger middle track), 3365 (target after breakthrough)
Key day of change: The rebound may continue on Thursday. If it breaks through 3345, it may further attack 3365-3400 on Friday.
Trading strategy
1. Low-to-long (main strategy)
Entry point: 3310-3315 (retracement support area)
Stop loss: 3305 (prevent false breakthrough)
Target: 3325 (short-term), 3335-3345 (key resistance area)
Logic: H4 cycle continuous positive shows bullish momentum, and it is expected to continue to rebound after retracement support.
2. High-level short-selling auxiliary trading strategy (if key resistance is touched)
Entry point: 3340-3345 (first test resistance area)
Stop loss: 3350 (prevent breakout and upward movement)
Target: 3325-3320 (short-term correction)
Logic: 3345 is a strong pressure from the middle track of the daily Bollinger. You can short before breaking through, but you need to enter and exit quickly.
Key observation points
3345 breakthrough situation:
If it stands firmly at 3345, you can go long with a light position after the correction (target 3365, 3400).
If it falls under pressure, it may return to the 3310-3340 oscillation range.
3300 defense situation:
If it falls below 3300, it may fall back to 3285, and we need to be alert to short-term weakness.
Summary
Main idea: Low-long (3310-3315) as the main, target 3345, and look at 3365+ after breaking through.
Auxiliary strategy: 3340-3345 short, fast in and fast out.
Risk control: Strictly stop loss, avoid chasing up and selling down, and pay attention to the changes in the momentum of the US market.
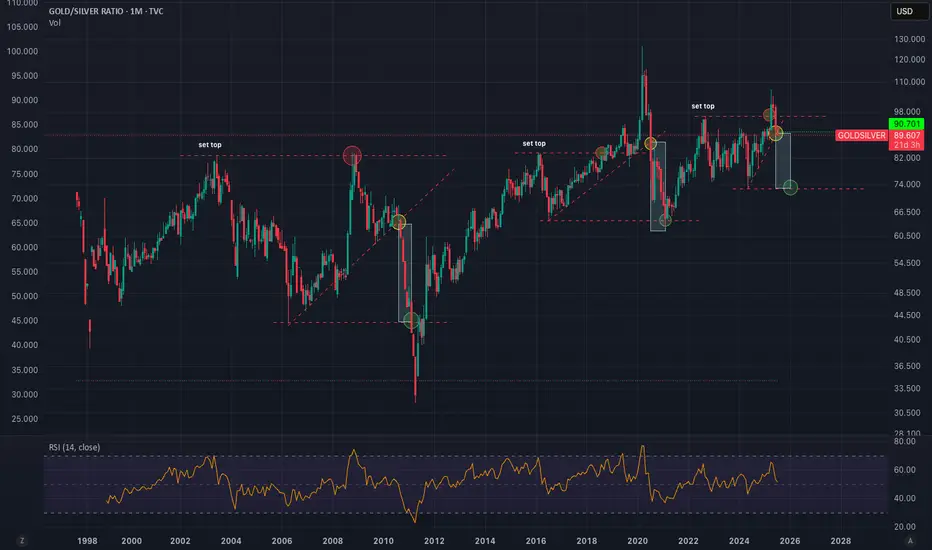
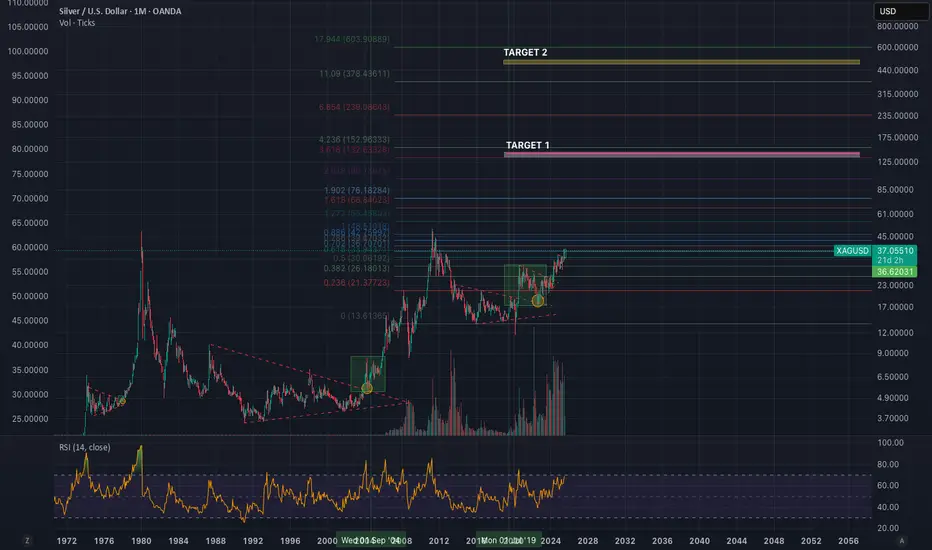
Gold/Silver Ratio to 72 Minimum - Imminent Silver BreakoutGoldSilver Ratio is following a clear pattern of behavior. We can expect a return to mean conservatively hitting 72 at a minimum. This puts silver at $46-58 if Gold doesn't move higher. I think we will see silver 5-10X over the next few years. Easy 25-50% in the short term (6-12 months).
Silver Spot to $136/oz then $477/ozThis could take multiple years to play out, my gold call 2-3 years ago was dead on. All I'm using are multi-fib confluences and the assumption that currency debasement and global liquidity will continue to increase over time. I am riding silver for the long haul. Watch Gold and for DXY bottoming pattern. Silver and Crypto move when DXY enters a momentum shift to the upside. Silver to $136-150 then $477-500 eventually.
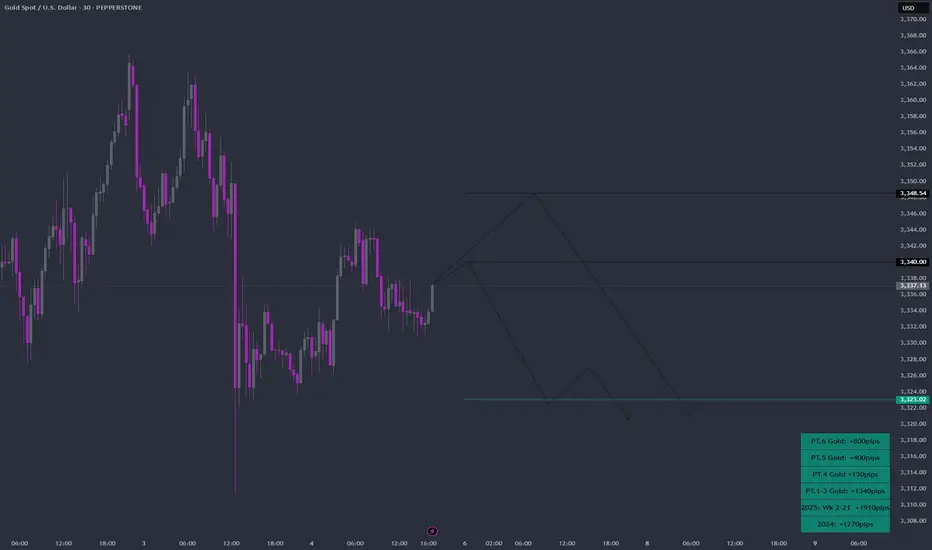
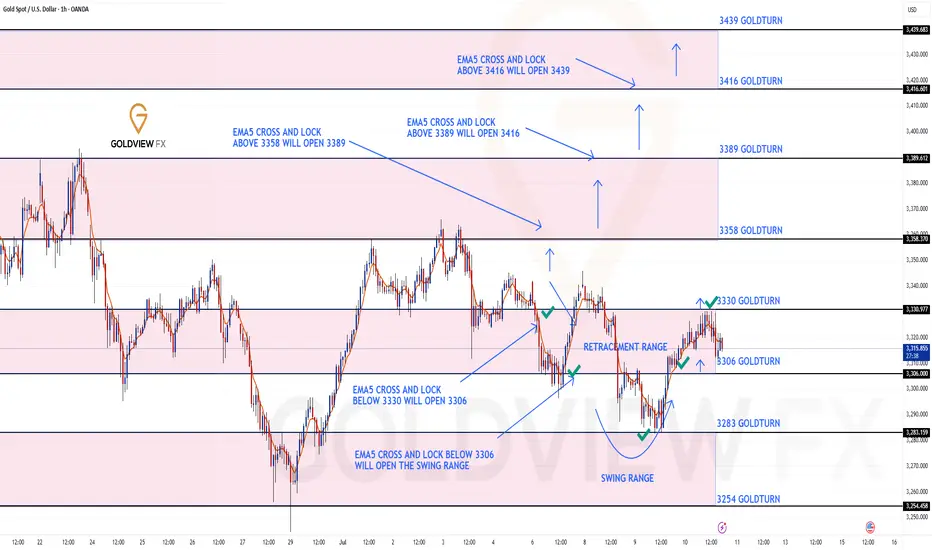
GOLD ROUTE MAP UPDATEHey Everyone,
Another PIPTASTRIC day on the markets with our chart idea and levels playing out and being respected, as analysed.
After completing the swing range test and full swing into 3306, we stated yesterday that we will now look for ema5 cross and lock above 3306 to open 3330. This was locked and loaded and completed the 3330 target today.
We will now continue to look for ema5 lock above 3330 for a continuation into the bullish targets above or failure to lock will see rejections into the lower Goldturns for support and bounce inline with our plans to buy dips.
We will keep the above in mind when taking buys from dips. Our updated levels and weighted levels will allow us to track the movement down and then catch bounces up.
We will continue to buy dips using our support levels taking 20 to 40 pips. As stated before each of our level structures give 20 to 40 pip bounces, which is enough for a nice entry and exit. If you back test the levels we shared every week for the past 24 months, you can see how effectively they were used to trade with or against short/mid term swings and trends.
The swing range give bigger bounces then our weighted levels that's the difference between weighted levels and swing ranges.
BULLISH TARGET
3358
EMA5 CROSS AND LOCK ABOVE 3358 WILL OPEN THE FOLLOWING BULLISH TARGETS
3389
EMA5 CROSS AND LOCK ABOVE 3389 WILL OPEN THE FOLLOWING BULLISH TARGET
3416
EMA5 CROSS AND LOCK ABOVE 3416 WILL OPEN THE FOLLOWING BULLISH TARGET
3439
BEARISH TARGETS
3330 - DONE
EMA5 CROSS AND LOCK BELOW 3330 WILL OPEN THE FOLLOWING BEARISH TARGET
3306 - DONE
EMA5 CROSS AND LOCK BELOW 3306 WILL OPEN THE SWING RANGE
3283 - DONE
3254
As always, we will keep you all updated with regular updates throughout the week and how we manage the active ideas and setups. Thank you all for your likes, comments and follows, we really appreciate it!
Mr Gold
GoldViewFX
Night range operation, technical outlook is still bearishGold fell as expected after repeated battles at 3330. Currently, gold has returned to around 3320. This shows that the rebound was mainly driven by short-term risk aversion. As market news calms down and sentiment stabilizes, the market will most likely return to the technical trend. If it unexpectedly breaks through 3330, it is expected to touch the 3345 line I mentioned this morning. The short-term 3310 line currently has certain support. From a technical point of view, I prefer to short. Once it falls below 3310, the subsequent support will move to 3295-3285. Therefore, I think it is a good choice to short again at 3320-3330.
OANDA:XAUUSD
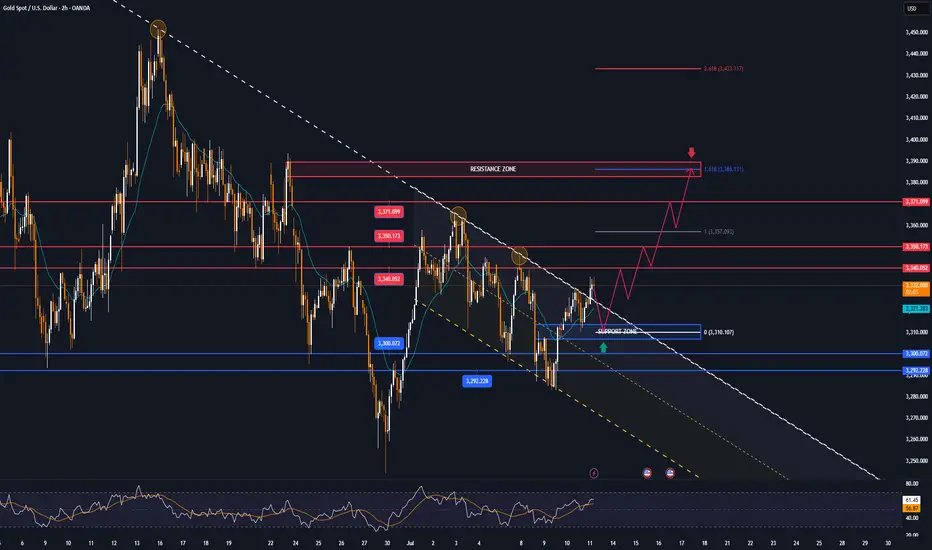
Gold Coils Beneath Resistance – Breakout Setup Brewing Above $3,Gold remains in a consolidation phase after its sharp rally earlier this year, but the broader uptrend remains intact. Price action continues to respect the ascending trendline that has been active since late 2024, as well as the 50-day SMA which currently offers dynamic support around the $3,323 level.
The key horizontal resistance at $3,430 continues to cap upside attempts. Price has formed a series of higher lows while facing rejection at this ceiling, suggesting a potential ascending triangle pattern—a bullish continuation setup.
Indicators:
MACD remains below the zero line and has flattened, reflecting the lack of momentum and confirming the consolidation.
RSI hovers near 47, showing neutral momentum. However, it has started to curl up slightly, which could hint at a developing bullish bias if price breaks higher.
Key Levels to Watch:
A confirmed breakout above $3,430 could open the door to fresh highs.
On the downside, a break below the ascending trendline and 50-day SMA could trigger a deeper correction toward the 200-day SMA near $2,950.
Conclusion:
Gold is currently coiling within a tightening range. While momentum is subdued, the technical structure favors a potential bullish breakout if resistance at $3,430 gives way. Traders should watch for a daily close above this level for confirmation of renewed bullish momentum.
-MW

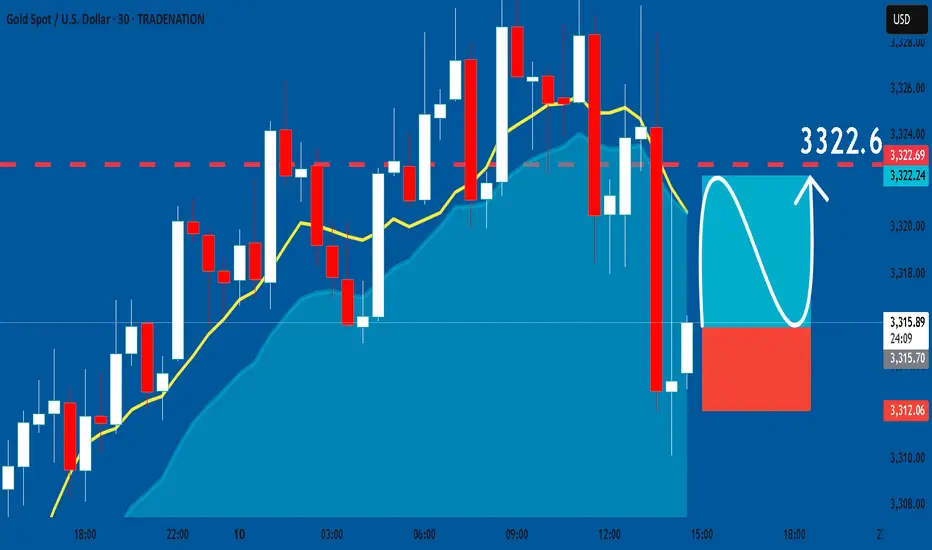
GOLD: Long Trade with Entry/SL/TP
GOLD
- Classic bullish formation
- Our team expects pullback
SUGGESTED TRADE:
Swing Trade
Long GOLD
Entry - 3315.7
Sl - 3312.0
Tp - 3322.6
Our Risk - 1%
Start protection of your profits from lower levels
Disclosure: I am part of Trade Nation's Influencer program and receive a monthly fee for using their TradingView charts in my analysis.
❤️ Please, support our work with like & comment! ❤️
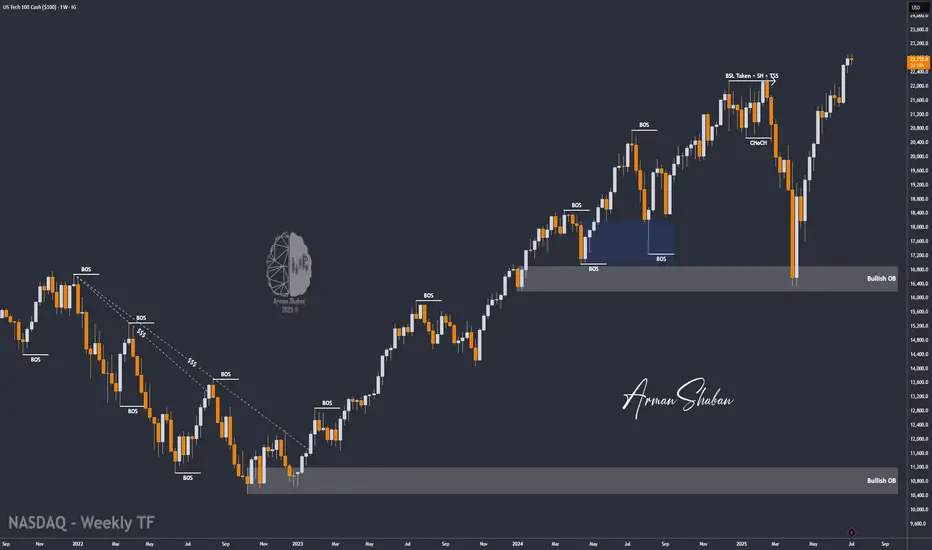
Nasdaq Surges to New Highs – 23,200 and 24,000 in Sight? (READ)By analyzing the Nasdaq chart on the weekly timeframe, we can see that the index is currently trading around the 22,700 zone and has followed the main analysis perfectly so far — continuing to print new all-time highs.
According to the original outlook, as long as the index holds above 22,150, we can expect further bullish continuation toward the next targets at 23,200 and 24,000.
Please support me with your likes and comments to motivate me to share more analysis with you and share your opinion about the possible trend of this chart with me !
Best Regards , Arman Shaban
Bearish is still the main trend, first test 3250 supportYesterday, as the market expected a trade agreement to be reached between the US and its trading partners, risk sentiment was boosted. The strengthening of DXY and the rise in US Treasury yields put some pressure on gold.
On Monday, gold rebounded to 3320, and on Tuesday it touched above 3320 and began to fall sharply. In the short term, 3320 is a key trading position that we need to pay attention to. From the daily chart, the support line of 3320 has been completely broken, and the two major support points below are 3250 and 3200 respectively. Judging from the 4H chart, the decline may have just begun. Next, we may first face a test of the 3250 support line. If the 3250 support can be maintained, gold will maintain a volatile consolidation in the short term. Otherwise, if it falls below 3250, it will test the 3200 mark.
OANDA:XAUUSD
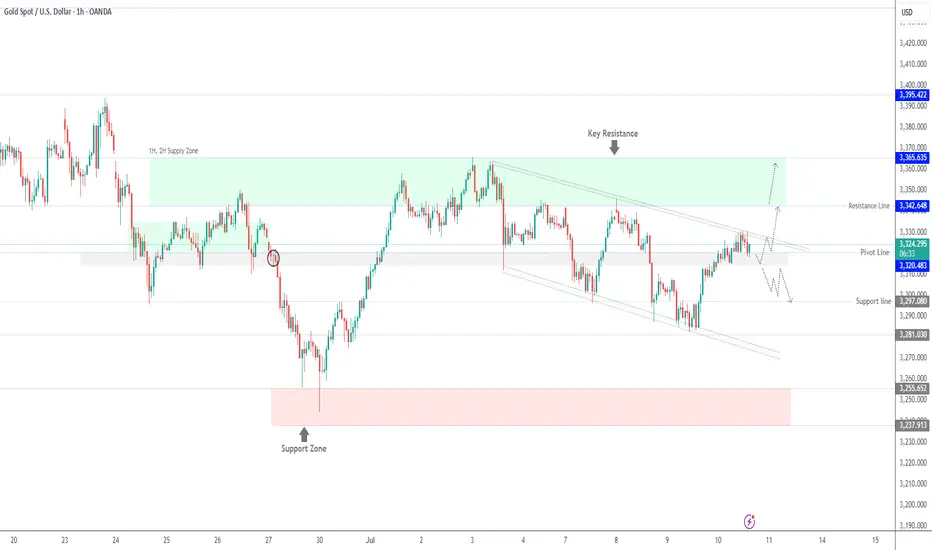
Gold Eyes 3365 as Tariff Tensions Support Bullish MomentumGOLD OVERVIEW
Gold extended gains to around $3,329 amid a weaker dollar and ongoing tariff tensions, with markets reacting to new U.S. trade actions and divided Fed minutes on rate cuts.
Technical Outlook:
Gold remains bullish while above 3320.
A 1H close above 3342 opens the door to 3365.
A 1H close below 3314 will turn sentiment bearish toward 3297 and potentially 3282.
Resistance: 3330, 3342, 3365
Support: 3309, 3297, 3282