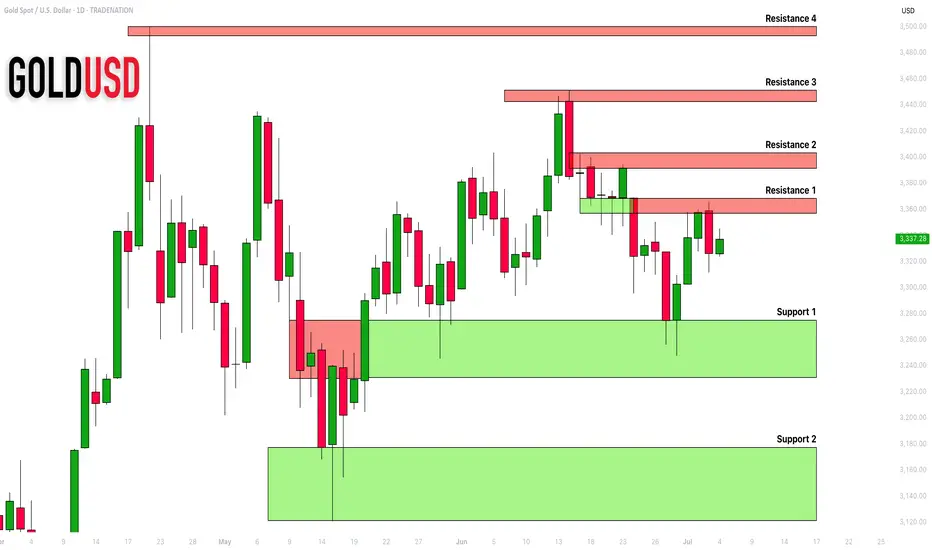
GOLD (XAUUSD): Support & Resistance Analysis For Next Week
Here is my latest structure analysis
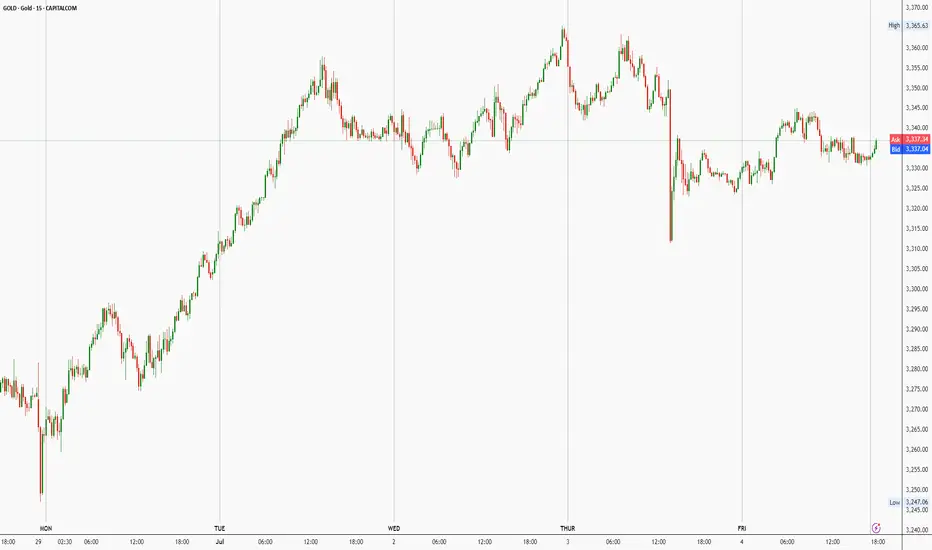
and important supports and resistances for Gold for next week.
Resistance 1: 3356 - 3368 area
Resistance 2: 3391 - 3403 area
Resistance 3: 3443 - 3452 area
Resistance 4: 3493 - 3501 area
Support 1: 3230 - 3274 area
Support 2: 3120 - 3177 area
Consider these structures for pullback/breakout trading.
❤️Please, support my work with like, thank you!❤️
I am part of Trade Nation's Influencer program and receive a monthly fee for using their TradingView charts in my analysis.
Metals
GOLD - POTENTIALLooking at gold. Its still in a bit of limbo after the NFP reaction on Friday. However it is looking like the draw on liquidity is higher. Therefore my bias on gold for the start of the week is bullish so will be looking to get the most optimal entry to take some buys to the upside.
If we can manage to find a decent enough move price really could rally upwards.
July 7 - 11: Buy Stock Indices DIPs! Watch For Gold, Oil FVGs!In this Weekly Market Forecast, we will analyze the S&P 500, NASDAQ, DOW JONES, Gold and Silver futures, for the week of July 7 - 11th.
Stock Indices are strong, so dip opportunities should present themselves next week.
Gold is bullish-neutral. Could see strength enter this market as July 9th approaches.
Silver is bullish. No reason to short it.
Oil is in a Monthly +FVG. If the FVG fails, it will confirm bearishness. Couple that with the fundamentals, I am watching for that confirmations to sell US Oil.
Enjoy!
May profits be upon you.
Leave any questions or comments in the comment section.
I appreciate any feedback from my viewers!
Like and/or subscribe if you want more accurate analysis.
Thank you so much!
Disclaimer:
I do not provide personal investment advice and I am not a qualified licensed investment advisor.
All information found here, including any ideas, opinions, views, predictions, forecasts, commentaries, suggestions, expressed or implied herein, are for informational, entertainment or educational purposes only and should not be construed as personal investment advice. While the information provided is believed to be accurate, it may include errors or inaccuracies.
I will not and cannot be held liable for any actions you take as a result of anything you read here.
Conduct your own due diligence, or consult a licensed financial advisor or broker before making any and all investment decisions. Any investments, trades, speculations, or decisions made on the basis of any information found on this channel, expressed or implied herein, are committed at your own risk, financial or otherwise.

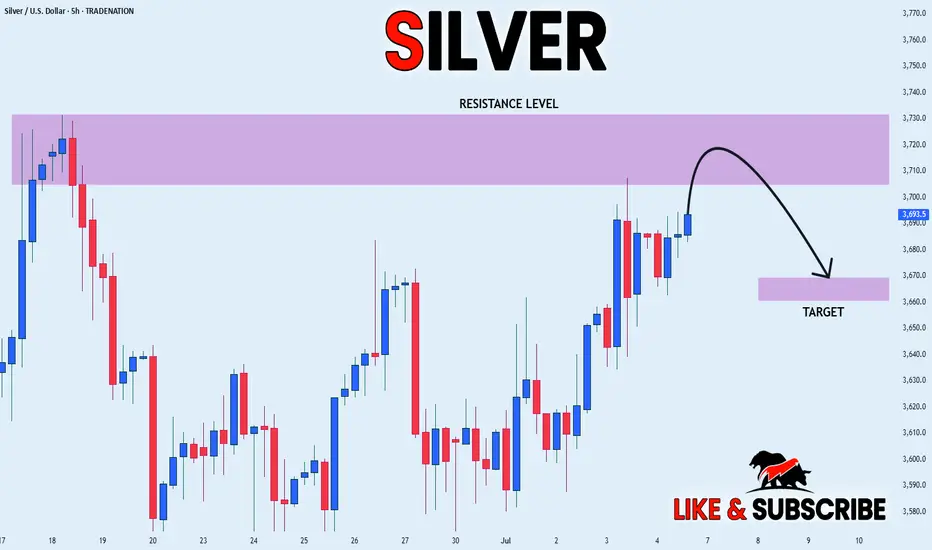
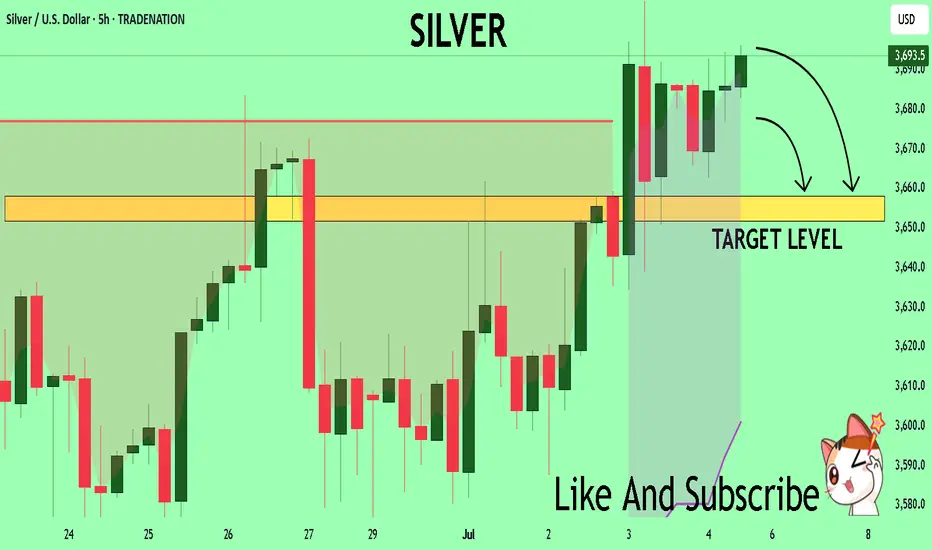
SILVER RESISTANCE AHEAD|SHORT|
✅SILVER has been growing recently
And the pair seems locally overbought
So as the pair is approaching a
Horizontal resistance of 3730$
Price decline is to be expected
SHORT🔥
✅Like and subscribe to never miss a new idea!✅
Disclosure: I am part of Trade Nation's Influencer program and receive a monthly fee for using their TradingView charts in my analysis.
Inside My Gold Mind: Weekend Trade Log📌 Market Context / Bias
The majority of bullish price action on VELOCITY:GOLD occurred early in the week — specifically between Monday and Tuesday. From midweek through Friday, the market entered a period of consolidation, showing signs of compression.
Interestingly, despite positive economic data that favoured the USD, GOLD remained steady and resilient. This suggests underlying bullish pressure and potential accumulation.
My current bias is bullish going into the new week — with expectations of a price expansion to the upside.
🔍 Higher Timeframe Analysis
Weekly Candle: Shows early bullish expansion followed by consolidation — classic sign of absorption or reaccumulation.
Draw on Liquidity: Equal highs remain above, acting as a magnet for price.
FVGs: Price traded into a daily FVG earlier in the week and closed above it.
Order Block: Price respected a previous Bullish Order Block during Thursday’s retracement, reinforcing possible support.
🧩 Lower Timeframe Confluence
1H–4H: Price is forming relatively equal highs above the current range — potential liquidity targets.
Intraday Structure: No major shift to bearish order flow was confirmed; compression suggests a possible continuation move once expansion begins.
🧠 Fundamental Insight
Despite hawkish or strong USD fundamentals, GOLD held its ground. This divergence often precedes a strong move — likely driven by risk sentiment, upcoming Fed commentary, or global macro drivers.
🧠 Trade Plan Preview
Stay tuned for my daily updates where I’ll share:
My bias for the day
Market structure breakdown
Intraday trade plan (entry, targets, and session model)
⚠️ Reminder:
Trade with due diligence. This is not financial advice. Always align entries with your personal model and preferred session.
Thanks for your support!
If you found this idea helpful or insightful, please drop a like 👍 and leave a comment — I’d love to hear your thoughts! 🚀
Follow me for more daily price action insights and trading strategies on XAUUSD and other key markets.
Let’s grow and trade smarter together! 📈
⚠️ Disclaimer
This content is for educational and informational purposes only and does not constitute financial or investment advice.
All trading involves risk. You are solely responsible for your own decisions, so always conduct proper research and due diligence before taking any trades.
Past performance is not indicative of future results. Trade responsibly.
May your final trades of the week be precise and profitable.
SILVER Technical Analysis! SELL!
My dear followers,
I analysed this chart on SILVER and concluded the following:
The market is trading on 36.935 pivot level.
Bias - Bearish
Technical Indicators: Both Super Trend & Pivot HL indicate a highly probable Bearish continuation.
Target - 36.582
About Used Indicators:
A super-trend indicator is plotted on either above or below the closing price to signal a buy or sell. The indicator changes color, based on whether or not you should be buying. If the super-trend indicator moves below the closing price, the indicator turns green, and it signals an entry point or points to buy.
Disclosure: I am part of Trade Nation's Influencer program and receive a monthly fee for using their TradingView charts in my analysis.
———————————
WISH YOU ALL LUCK
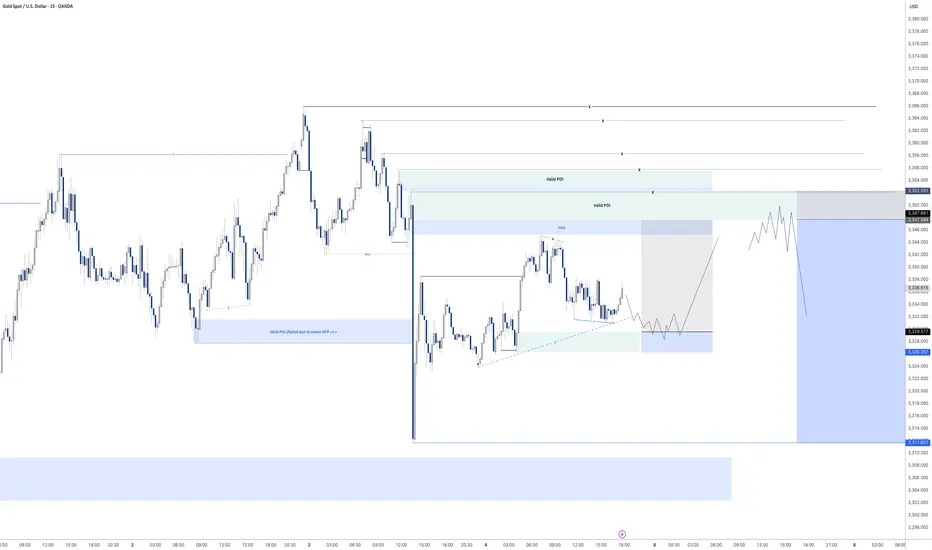
XAUUSD H4 Outlook – July 7, 2025“You don’t chase gold. You set the trap, then wait.”
👋 Hey traders — we’re gearing up for a new week on gold, and the H4 chart is starting to speak clearly. After Friday’s clean push into premium rejection zones, price is now compressing beneath a key supply block. Structure is fragile, and the next move will likely come fast.
Let’s position with precision before the breakout.
—
🔸 H4 Bias
Structure remains bearish short-term, with clear lower highs forming below a major supply at 3344–3351.
The broader bias leans neutral as we trade between unmitigated demand and inducement-heavy resistance. Confirmation is everything.
—
🔴 Supply Zones (Sell Areas)
3344–3351
→ H4 Fair Value Gap + OB combo inside premium
→ If price wicks above recent highs and rejects here, it could trigger a clean swing sell.
3380–3394
→ Origin of the last bearish leg + liquidity wick
→ High-risk, high-reward rejection zone if price spikes impulsively this week (e.g. post-Fed tone or surprise volatility).
—
🟢 Demand Zones (Buy Areas)
3265–3275
→ H4 FVG + flip zone + prior sweep level
→ If price taps and holds here, we may see re-accumulation for a move toward 3327–3340.
3235–3246
→ Strong unmitigated OB + discount level
→ Ideal sniper long zone only on clean rejection + structure shift (BOS on M15+).
—
🟡 Flip / Decision Zone
3299–3305
→ EMA50 + micro-range equilibrium
→ If price breaks and holds above this zone with strength, bias turns short-term bullish. If it rejects, continuation down is favored.
—
🎯 Execution Notes
EMA21/50 are acting as active compression bands — watch for rejection pressure
RSI shows no clear divergence yet — but volume is thinning
Liquidity is building above 3340 and below 3265 — prepare for traps both ways
—
🔚 Final Words
Sniper traders aren’t early — they’re precise. If you’ve been reacting too fast lately, this is your week to reset. Gold is telling a story here… but only structure speaks the truth.
🚀 If this helps bring clarity to your outlook, tap follow — we do this daily, with structure, not signals.
—
📢 Disclosure: I use Trade Nation’s broker feed on TradingView and I’m part of their influencer program.
📉 This is educational content, not financial advice.
XAUUSD Daily Outlook – July 7, 2025👋 Hey traders, welcome to the fresh week! After the Friday selloff, gold is approaching a key inflection point. Let’s break down what’s happening on the Daily chart and how to approach it with clarity — no guessing, just precision.
Stay focused. The real opportunity is always in how you prepare.
🌍 Macro + Sentiment
Market remains sensitive to yield shifts and broader risk sentiment (BRICS summit also continues)
Price remains elevated in premium territory after months of vertical flow — but structure is finally showing re-accumulation or re-distribution?
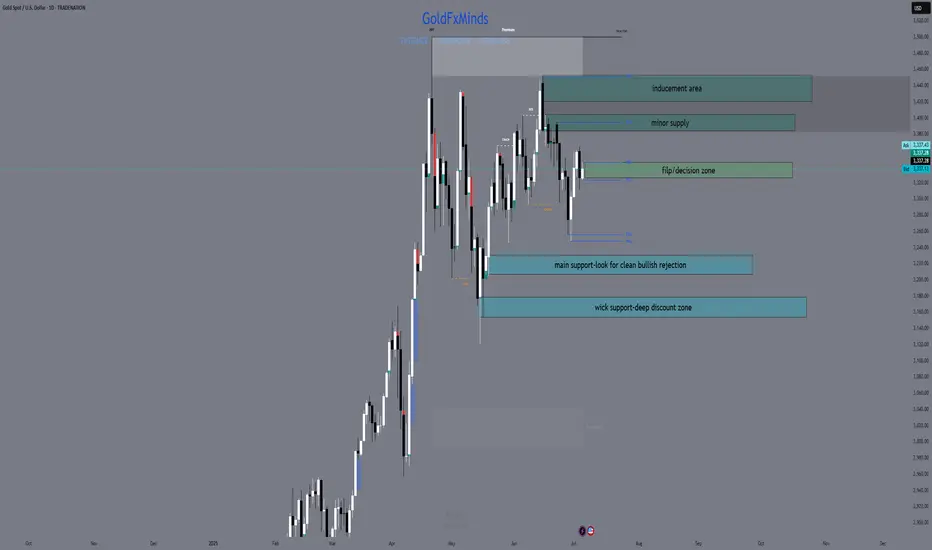
📈 Daily Bias
Neutral to bearish until the 3330–3344 zone fully flips cleanly as support
Structure shows lower highs, strong wick rejections in premium zones, and a need for confirmation
🧠 What the chart tells us:
Price is compressing between a D1 FVG (below) and unfilled premium OB (above)
Friday’s low wicked into a small imbalance — but was not a clean tap into the main OB
RSI is midrange, EMAs are flat, and momentum is indecisive
We're either gearing up for a bullish FVG reclaim or prepping for a deeper drop into discount
⚠️ Key Zones to Watch
🔵 Support Zones (Buy Zones)
3230–3208
→ D1 Fair Value Gap + unmitigated bullish OB + discount pricing
→ Valid only with clean bullish rejection. High interest for sniper entries if price returns.
3170–3154
→ Untapped daily OB + historical support wick + aligns with deeper discount zone
→ Stronger bounce zone if 3230 fails. Confluence with fib retracement & RSI likely oversold here.
🔴 Supply Zones (Sell Zones)
3420–3450
→ Premium FVG + D1 OB combo + previous bearish rejection wick
→ High probability inducement area. Valid only if price fails to hold 3344 flip.
3388–3402
→ Minor supply + internal structure break level
→ Short-term reaction area. Lower conviction but watch for rejection if price overextends.
🟡 Decision / Flip Zone
3327–3344
→ Former support now turned resistance
→ If this zone flips bullish and holds, bias shifts to continuation. If rejection occurs, confirms retracement deeper into discount.
✅ Conclusion
The market is entering a decision week — no rush. Let the chart guide you.
Clarity comes not from prediction, but preparation. This chart isn’t hindsight — it’s a live framework.
✨ Final Thought
If this chart feels clear, that’s because it was built with intention — not after the move, but before it happens.
The difference between noise and precision is structure.
And we don’t guess — we prepare.
🚀 If you appreciate detailed, real-time structure like this, hit follow and join the traders who value clean execution over hype.
💬 Drop your bias below — bullish or bearish this week?
📢 Disclosure: I use Trade Nation's broker feed on TradingView and I'm part of their influencer program.
📉 This is educational content and not financial advice.
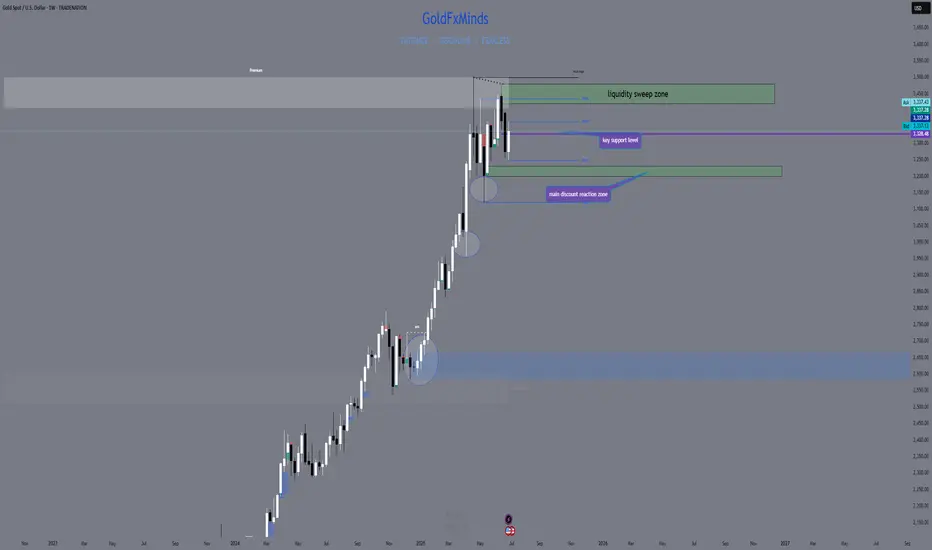
XAUUSD Weekly Outlook | July 7–11, 2025“The market always whispers before it roars. The wise trader listens to structure.”
Hello beautiful minds 💬
We enter the second week of July with strong macro undercurrents and new structure shifts beginning to show. While the U.S. celebrated Independence Day, the market quietly set up key zones for next week’s liquidity sweep.
🔸 Macro & Geopolitical Overview
🟠 Geopolitics: Tensions continue post-BRICS Summit, with a focus on further de-dollarization talks.
💰 U.S. Economy: Consumer credit and NFIB small business confidence to kick off the week.
🔔 Big catalysts:
Wednesday: Fed speeches (Mouslem, Waller, Daly)
Thursday: Unemployment Claims + Bond Auction
Friday: Federal Budget Balance (a key fiscal stress indicator)
📉 Expect spikes in volatility mid-week and dollar reactions post-FOMC speeches.
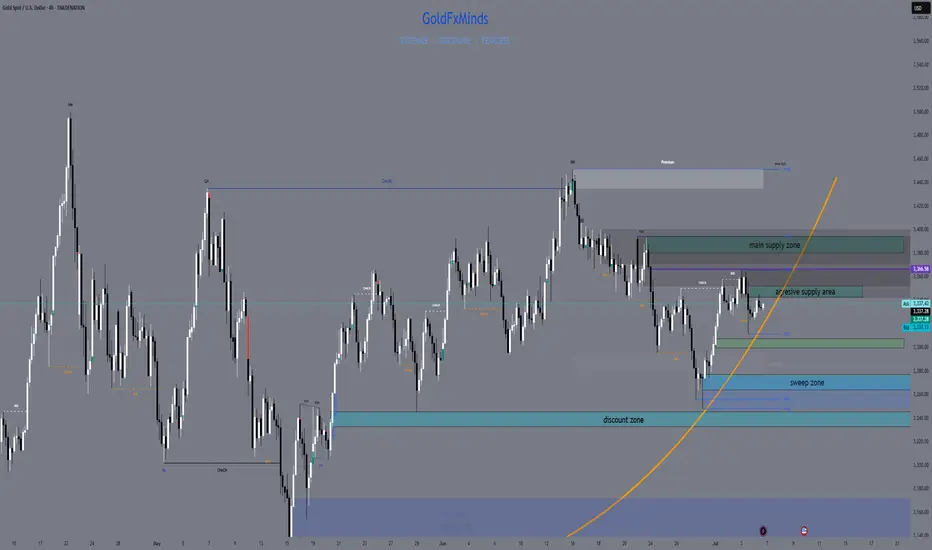
🔸 WEEKLY BIAS:
Still bullish to neutral, but momentum is cooling inside a premium rejection range.
Price broke structure to the upside in May-June, forming a new weekly higher high (HH) above 3380 — but failed to hold convincingly above the volume imbalance (void zone) around 3430–3480.
We are now rejecting premium and hovering just under the 3327 level — previous institutional support and the midpoint of the weekly FVG.
🔹 Weekly Key Zones
🟢 Support zone to watch (buy interest)
3204–3230 = Weekly FVG + equilibrium retrace + EMA50 rising
This is the main discount reaction zone. If price taps in with bullish PA, we look for bullish continuation toward 3327 then 3380.
🟡 Mid-level (decision point)
3327 = prior key support now acting as resistance
Watch how price reacts here — if it flips cleanly with a daily close, short-term bullish pressure may return.
🔴 Supply zone / resistance (sell interest)
3420–3480 = Weekly FVG + premium OB + liquidity sweep zone
This is the main premium rejection area. If tapped again without strong volume or fundamentals, this may fuel a swing short setup.
🔸 What This Means for You
This week is about patience and precision. The cleanest setups may come after volatility spikes during Fed speeches. Structure will tell — but emotional control will confirm.
If you feel like you’ve been chasing trades lately… this is the week to reset.
Focus only on sniper setups. Wait for them to form. Let others rush.
🔚 Final Words from the Team
Clarity beats chaos. Always. This weekly map is your compass — now it’s your job to wait, watch, and act with precision.
🔔 Follow GoldFxMinds for structured gold planning that respects both price and time.
🗨️ Drop a comment with your bias — bullish or bearish this week?
—
📌 Disclosure: This analysis is for educational purposes only and reflects market structure at the time of writing. No financial advice.
renderwithme | XAUUSD - GOLD Pre-NFP Technical AnalysisCurrent Market ContextPrice Levels: Gold (XAU/USD) is trading around $3,341.79 as of July 4, 2025, with recent price action showing consolidation between $3,300 and $3,400 after a pullback from highs near $3,500.
Recent Performance: Gold rose slightly by 0.27% to $3,335.17 per troy ounce on July 4, supported by positive momentum from trading above the 50-day EMA. However, it has faced resistance near $3,400 and experienced low liquidity due to the U.S. Independence Day holiday.
Market Sentiment: The overall sentiment remains cautiously bullish, driven by a weakening U.S. dollar amid concerns over U.S. fiscal imbalances (e.g., Trump’s tax-cut bill adding $3.4 trillion to the national debt) and expectations of a dovish Federal Reserve policy. However, short-term volatility is expected due to holiday-thinned liquidity and upcoming economic data
# Technical Outlook
Bullish Scenario: If gold holds above $3,300 and breaks $3,353, it could retest $3,400 and potentially climb toward $3,435–$3,451. A weekly close above $3,400 would negate near-term bearish risks and signal a continuation of the broader uptrend.
Bearish Scenario: A sustained break below $3,300 could trigger a deeper correction toward $3,248 (monthly low) or $3,226–$3,203. A drop below $3,203 would challenge the medium-term uptrend, potentially opening the door to $3,150 or lower.
Range-Bound Expectation: Due to low liquidity and pending NFP data, gold may consolidate between $3,320 and $3,340 early next week, with volatility increasing post-NFP
Disclaimer --
This analysis is based on recent technical data and market sentiment from web sources. It is for informational purposes only and not financial advice. Trading involves high risks, and past performance does not guarantee future results. Always conduct your own research or consult a SEBI-registered advisor before trading.
#Boost and comment will be highly appreciated

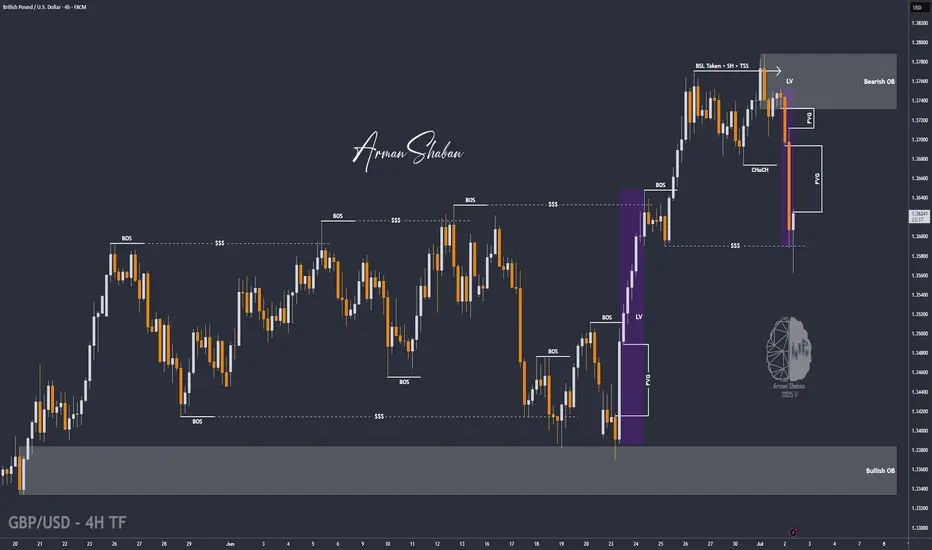
GBP/USD : First Long, Then SHORT! (READ THE CAPTION)By analyzing the GBP/USD chart on the 4-hour timeframe, we can see that the price is currently trading around 1.3625. I expect a new Fair Value Gap (FVG), formed by the recent sharp drop, to be filled soon.
The first target for this potential move is 1.3650, with the next bullish zone between 1.3670 and 1.3730.
Supply and demand zones are marked on the chart — keep a close eye on how the price reacts to these key levels!
Please support me with your likes and comments to motivate me to share more analysis with you and share your opinion about the possible trend of this chart with me !
Best Regards , Arman Shaban
Gold - The final resistance breakout!Gold - TVC:GOLD - prepares a final rally:
(click chart above to see the in depth analysis👆🏻)
Over the past 12 months, Gold rallied more than +70%. However the past three months clearly rejected a major horizontal resistance. But price action on the smaller timeframe remains incredibly bullish. Therefore an all time high breakout will most likely follow.
Levels to watch: $3.500
Keep your long term vision!
Philip (BasicTrading)

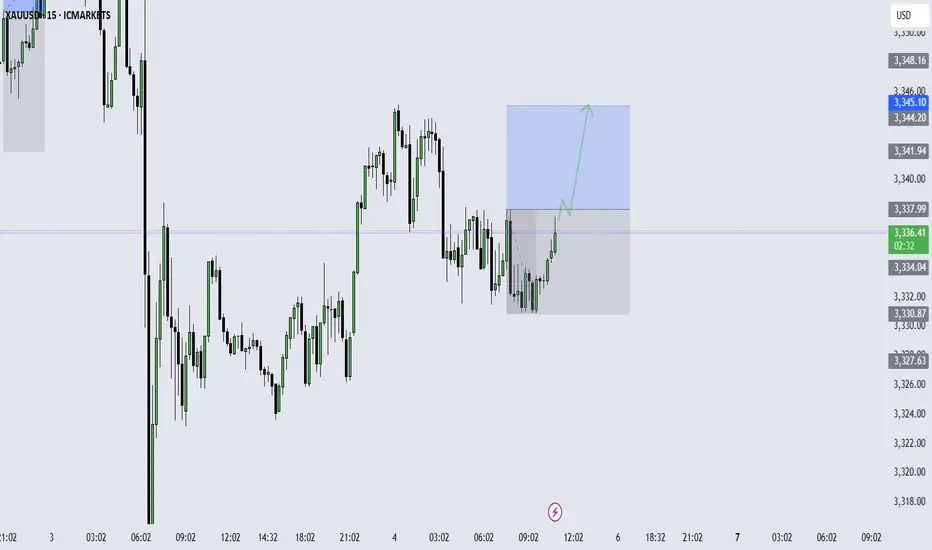
XAUUSD (GOLD): Buy setupXAUUSD (GOLD): Buy setup. check for 5m candle close and buy when the level is broken.
Cheers.
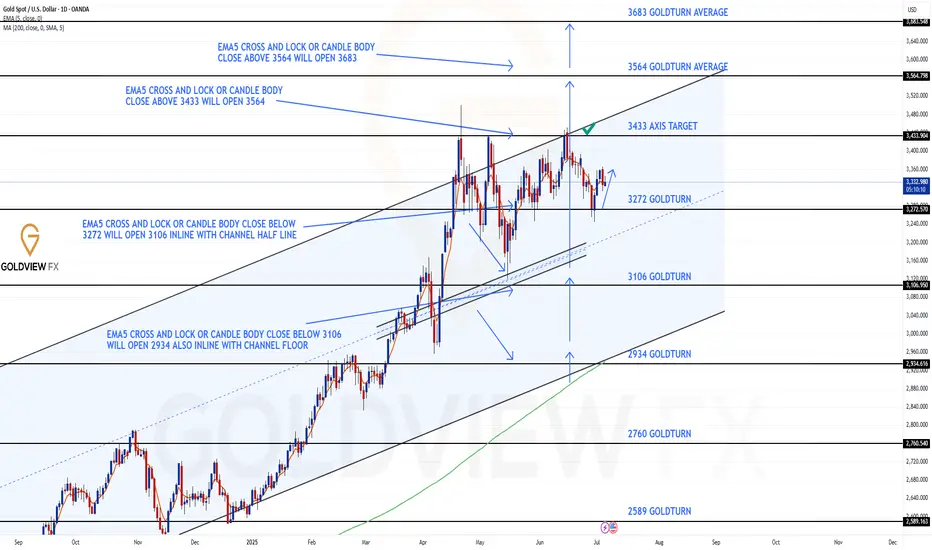
GOLD ROUTE MAP UPDATEHey Everyone,
Great finish to the week!!
We will now finish off with the Daily chart update, after following the 1h and 4h chart throughout the week. This will now remind everyone, how we broke down the overall structure into play.
The bounce scenario off 3272 has now officially played out, just as outlined.
After the clean rejection at the channel top near 3433, price moved precisely into the 3272 Goldturn support, where we were watching closely for structure to hold. That level held beautifully, providing a solid base for this week’s strong push upward.
This reaction once again highlights the precision and reliability of the Goldturn levels - 3272 acted as a critical pivot, and the market respected it perfectly. We didn’t get an EMA5 cross and lock breakdown, confirming that buyers were still in control at this support, and that was our green light for bounce structure to unfold.
As price grinds its way back up the channel, we’ll continue to monitor reactions at key resistance zones. The measured structural move from 3272 reinforces our approach of trading level to level with patience and confirmation, not emotion.
We’ll be back Sunday with a full multi timeframe analysis to prepare for next week’s setups including updated views on the higher timeframes, EMA alignments, and structure expectations going forward.
Key Levels to Watch:
Resistance: 3433 (channel top)
Support: 3272 (confirmed bounce zone)
Thanks again for all your likes, comments, and follows.
Wishing you all a fantastic weekend!!
Mr Gold
GoldViewFX
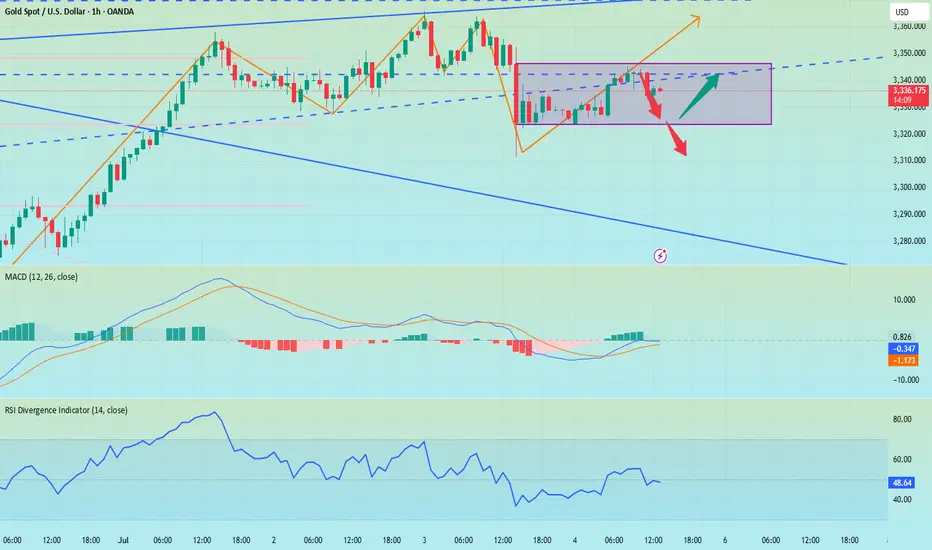
Go short before breaking 3350, go long before falling to 3320📰 News information:
1. Geopolitical situation
2. Tariff implementation and interest rate cut bill
📈 Technical Analysis:
As I said, the US stock market closed early today, and the market will lack some momentum. It is difficult to have a large fluctuation. It is expected to fluctuate and consolidate. I also explained in the previous post that the upper pressure in the short term is at 3340-3350. If it is touched, we can try to short and defend 3360. If it falls back to 3323, we can try to go long for the first time. If it continues to fall, it is expected to reach 3315-3305. Therefore, if it first touches 3323, go long, SL 3316, and consider going long if it touches 15-05 below.
🎯 Trading Points:
SELL 3340-33350
TP 3330-3320-3310-3300
BUY 3323
TP 3333-3340-3350
BUY 3315-3305
TP 3325-3333-3340
In addition to investment, life also includes poetry, distant places, and Allen. Facing the market is actually facing yourself, correcting your shortcomings, confronting your mistakes, and strictly disciplining yourself. I hope my analysis can help you🌐.
TVC:GOLD OANDA:XAUUSD FX:XAUUSD FOREXCOM:XAUUSD PEPPERSTONE:XAUUSD FXOPEN:XAUUSD
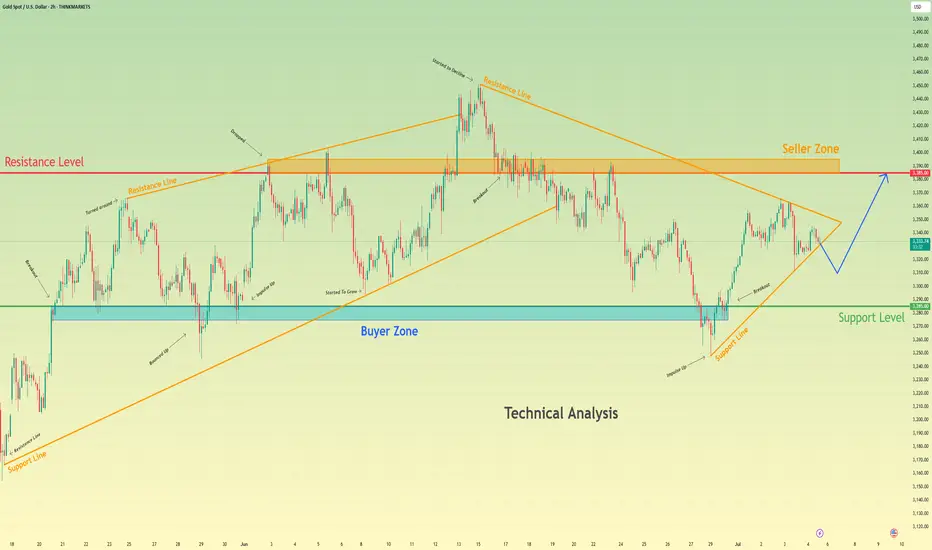
Gold will exit from pennant and then rise to resistance levelHello traders, I want share with you my opinion about Gold. Recently, the price formed a pennant pattern after a sharp bullish impulse from the buyer zone (3275–3285 points). That upward movement started after the price bounced off the strong support level (3285) and broke out from the wedge structure formed earlier. This bullish momentum indicated strong demand near the lower boundary, reinforcing the current market structure. Now, the price is consolidating inside the pennant formation, slowly approaching its apex. At the same time, we are still above the support trendline and close to the upper border of the pattern. This suggests a possible breakout to the upside. I expect that gold will soon exit the pennant and start rising again toward the resistance level at 3385, which also matches the seller zone (3385–3395 points). This area previously acted as a major reversal zone, so if price reaches it, I will consider locking profits at that point. Given the breakout structure, recent bounce from the buyer zone, and current bullish consolidation, I remain bullish and expect GOLD to continue growing toward TP 1 at 3385. Please share this idea with your friends and click Boost 🚀
Disclaimer: As part of ThinkMarkets’ Influencer Program, I am sponsored to share and publish their charts in my analysis.