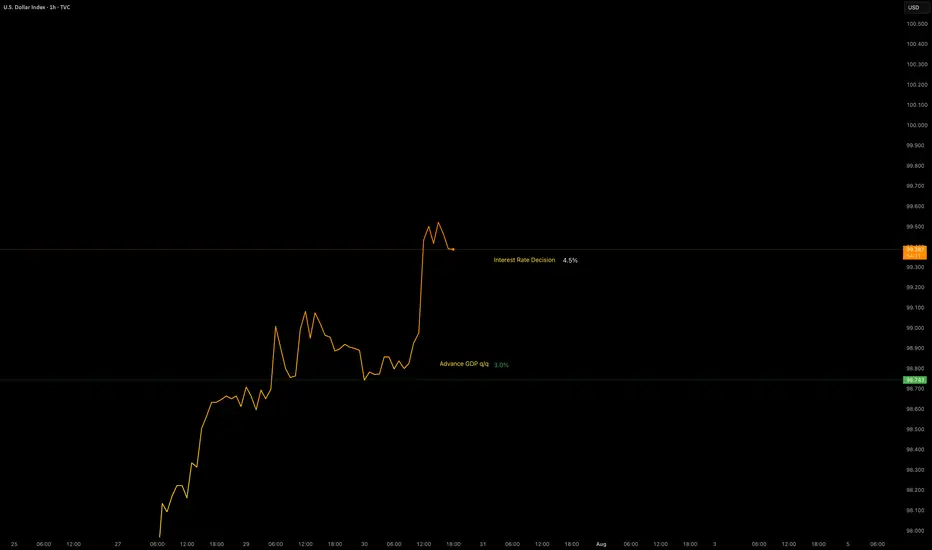
Data Release - Interest Rate DecisionJul 30 2025: Interest Rate Decision (4.5%)
Rates remain unchanged as expected.
OANDA:XAUUSD remains bearish with the help of GDP data.
TVC:DXY remains bullish with the help of GDP data. No major changes in either pairs.
Volatility is increased.
Metals
THE KOG REPORT - FOMCTHE KOG REPORT – FOMC
This is our view for FOMC, please do your own research and analysis to make an informed decision on the markets. It is not recommended you try to trade the event if you have less than 6 months trading experience and have a trusted risk strategy in place. The markets are extremely volatile, and these events can cause aggressive swings in price.
It’s been an aggressive month on the markets especially this week which has been testing for traders due to the extended movement on gold. We’ve managed to stay ahead of the game and although we missed the move downside, we’ve capture scalps up and down trading it on an intra-day basis rather than a swing.
Looking at the 4H chart, we can see we have support forming at the 3310 level which is the key level for this week and will need to be broken to go lower. If we can flip the 3334 resistance, price should attempt higher into the 3355-60 region which is where we may settle in preparation for NFP. on Friday This is the level that needs to be watched for the daily close, as a close above will confirm the structure and pattern test which can form a reversal if not breached.
Now, here is the flip! We’re still sitting below the daily red box but we know this break does give a retracement and with sentiment long, it may not be a complete retracement again. Here 3345-50 is the red box to watch and as above, if not breached, we may see a rejection here which will confirm no reversal for higher and, potentially a further decline into the 3270-5 regions for the end of the month and quarter.
Pivot – 3323-6
RED BOX TARGETS:
Break above 3335 for 3338, 3340, 3345, 3347 and 3357 in extension of the move
Break below 3320 for 3310, 3306, 3302, 3297 and 3393 in extension of the move
Please do support us by hitting the like button, leaving a comment, and giving us a follow. We’ve been doing this for a long time now providing traders with in-depth free analysis on Gold, so your likes and comments are very much appreciated.
As always, trade safe.
KOG

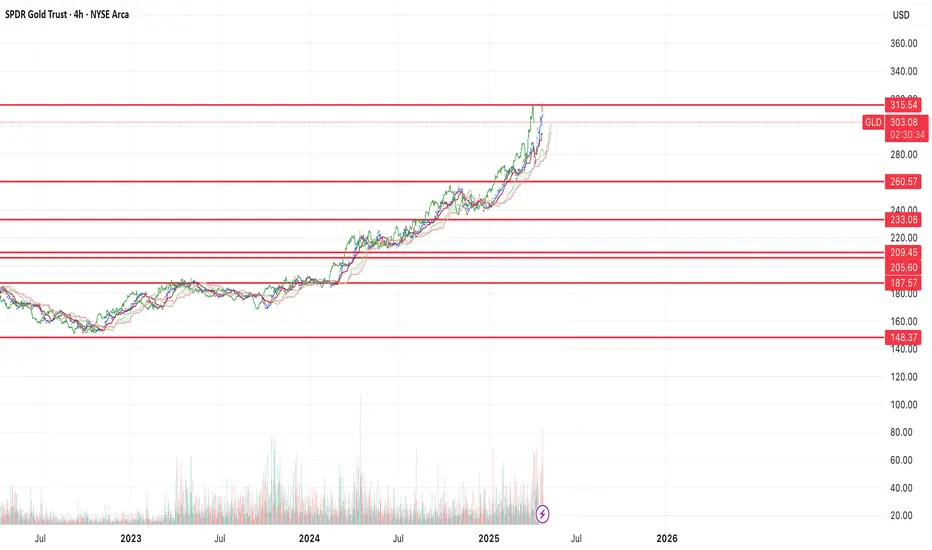
$GLD short term top in $260-148 target on the downsideAMEX:GLD looks a bit extended here. I could see the possibility of GLD falling back to the $260 support at a minimum and maximum all the way down to $148
The $209 support would be the 50% retracement of the recent run. I like that as a level for a bounce.
Let's see where we end up.
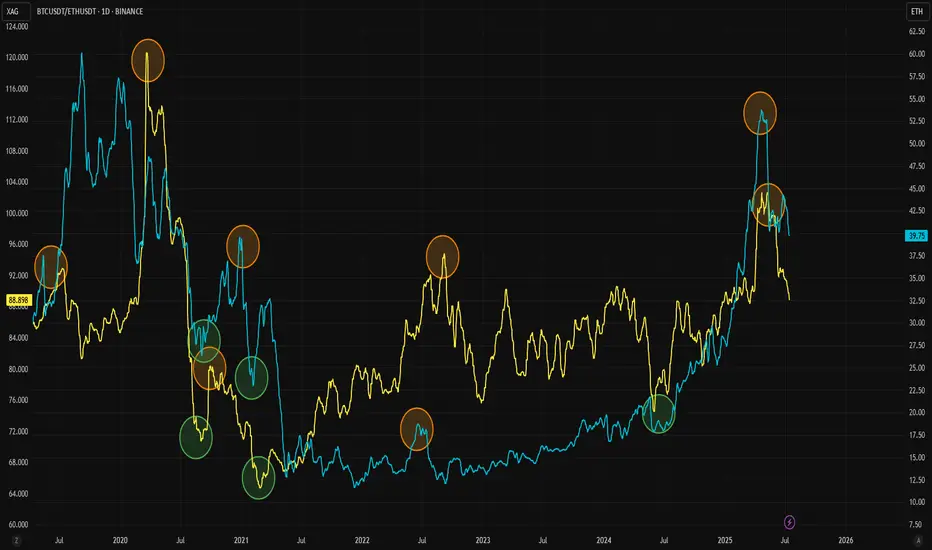
Want to Know What Happens in Crypto? Check Silver InsteadThe Gold/Silver ratio is one of the key indicators that highlights major turning points in modern economic history. Similarly, the ETH/BTC ratio is widely followed as a gauge of strength in the crypto market and the beginning of altcoin seasons. Interestingly, these two ratios also appear to correlate well with each other.
As adoption of both Ethereum and Bitcoin has grown, the Gold/Silver and BTC/ETH ratios have started to move more closely together. They often follow similar patterns, with tops and bottoms forming one after the other. For clarity, this analysis uses the BTC/ETH ratio rather than ETH/BTC.
Historically, BTC/ETH tends to lead during market tops, followed by a similar move in the Gold/Silver ratio. This pattern has been observed repeatedly since 2020. When it comes to bottoms, the timing between the two ratios is usually tighter, as seen during the 2020, 2021, and 2024 lows.
The latest signal came from a top in the BTC/ETH ratio, and the Gold/Silver ratio now appears to be following that move. Given the cyclical nature of crypto markets, both ETH and silver could be at the early stages of new upward trends. For a potential trend reversal, it may be wise to keep a closer eye on silver in the coming weeks.
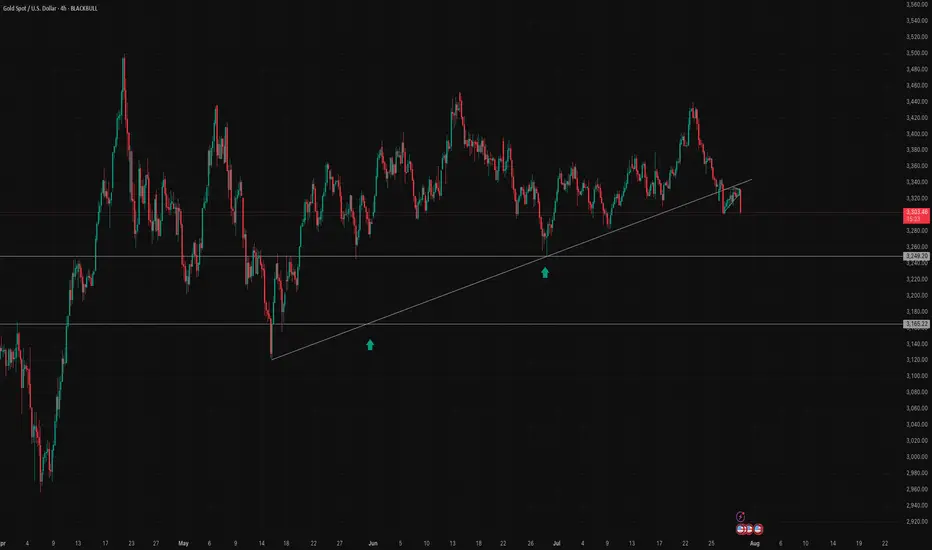
Gold (XAUUSD) Breaks Trendline – Potential Downside Ahead?Gold (XAU/USD) has officially broken below a long-term ascending trendline on the 4H chart, indicating a potential shift in market structure. The recent breakout from a bear flag pattern confirms bearish momentum, and price is now approaching a key horizontal support zone around $3,249 and $3,242.
🔹 Trendline support (now resistance) broken
🔹 Bear flag breakdown – strong bearish candle
🔹 Eyes on support levels: $3,249, $3,165, and possibly lower
🔹 Watch for a potential retest of the broken trendline for short opportunities
A clean break and close below $3,249 could open the door for further downside in the coming sessions. Trade cautiously and manage your risk!
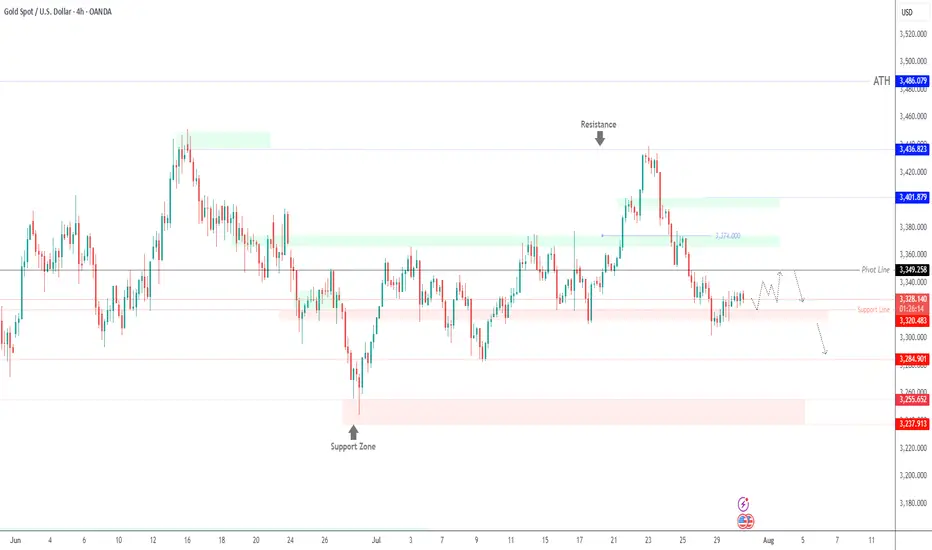
Gold Breakout or Pullback Ahead?Currently, price is in a correction phase within this rising channel after hitting the upper resistance near $3,438. The pullback is moving toward the mid and lower channel zones, which is healthy for a bullish continuation. Gold is in a healthy pullback phase inside a bigger bullish trend. If support at $3,358 – $3,373 holds, expect an upward push back to $3,438 → $3,487 → $3,517 in the coming sessions. Only a clean break below $3,309 would signal a deeper bearish move.
Gold is likely to consolidate or retest the lower channel support ($3,358 – $3,373). If buyers defend this zone, the price is expected to bounce back toward $3,400 – $3,420 and eventually retest $3,438.
Key Price Zones
- Main Resistance: $3,438 (if broken, potential rally toward $3,487 → $3,517)**
- Immediate Support: $3,373 (first reaction level)
- Major Support: $3,358 (key level to protect bullish structure)
- Potential Higher Low Zone: Around $3,342.44
Expected Price Behavior
- If gold holds above $3,373 – $3,358, it is likely to form a new higher low near $3,342 – $3,358 before attempting to push higher.
- A successful breakout above $3,438 would indicate continuation of the bullish momentum targeting $3,487 and $3,517 ).
- Failure to hold above $3,358 may open the door for a deeper correction toward $3,309, but the overall trend remains bullish unless that level is broken.
Trend Outlook
- Short-Term Trend: Consolidation / corrective pullback within a bullish channel
- Medium-Term Trend: Bullish (higher lows and breakout structure intact)
- Long-Term Trend: Bullish as long as the channel holds above $3,309
Gold is currently in a pullback phase after a strong bullish breakout. The market is likely forming a higher low and may resume upward momentum once the $3,373 – $3,358 zone is confirmed as support. A breakout above $3,438 would validate a bullish continuation toward $3,487 - $3,517.
Note
Please risk management in trading is a Key so use your money accordingly. If you like the idea then please like and boost. Thank you and Good Luck!

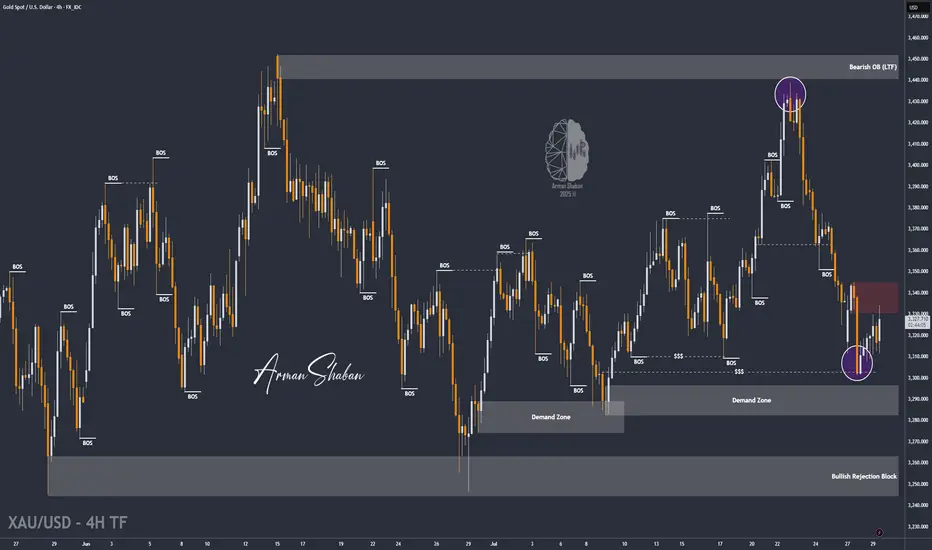
XAU/USD | Gold Below $3345 – Key Demand Awaits at $3282–$3296!By analyzing the gold chart on the 4-hour timeframe, we can see that after dropping to the $3301 area, strong demand came in, helping the price stabilize above $3300 and rally up to over $3334. Currently, gold is trading around $3331. If the price fails to break and hold above $3345 within the next 8 hours, we may see a price correction soon. A key demand zone lies between $3282–$3296, where a strong bullish reaction could occur if price revisits this area. Important supply levels to watch are $3366, $3382, $3393, and $3404.
Please support me with your likes and comments to motivate me to share more analysis with you and share your opinion about the possible trend of this chart with me !
Best Regards , Arman Shaban
Gold’s Biggest Day of 2025: Collapse or New High Incoming?🟡 Gold Pre-FOMC Update | Patience Paid Off
In my previous analysis released on Monday, we highlighted the significance of the 3310 key red level on gold. I mentioned that if we got a daily candle close below this zone, it could trigger further downside.
That scenario didn’t play out — price closed above 3310, and that’s exactly why we stayed out of any short positions. No guessing, no forcing. Just patience.
On the flip side, I also said we need a daily close above 3350 to even consider going long. And as you can see, for the past two days, price has been ranging tightly between 3310 and 3330 — with relatively low trading volume across the board.
After 9 years of optimizing this strategy, one core principle remains unchanged:
🛡️ Capital protection and maximum risk control always come first.
And I can confidently say — those filters are working beautifully. I hope you’re benefiting from this approach too.
Now technically speaking, everything is lining up for a bullish DXY and bearish gold —
But tonight’s FOMC meeting and Powell vs. Trump drama will be the final trigger.
Let’s watch closely. Smart trading is patient trading. 🧠⚖️
🔁 This analysis will be updated whenever necessary.
Disclaimer:This is not financial advice. Just my personal opinion.

Gold remains below trend line ahead of FOMCAhead of today's US GDP and FOMC policy decision, gold was trading little-changed. The metal has breached its 2025 bullish trendline, which was positioned in the $3,330–$3,350 area. This breakdown shifts the technical outlook to mildly bearish, although further downside confirmation is needed through the loss of additional support levels to solidify bearish control.
From a bullish standpoint, the metal must reclaim and hold above the broken trendline to reignite upward momentum. However, the longer it remains below the $3,330–$3,350 zone, the greater the likelihood of a short-term correction—particularly if the immediate support at $3,300 fails. A break below this level would expose the June low at $3,247 as the next significant support.
By Fawad Razaqzada, market analyst with FOREX.com
On the upside, resistance is now stacked at $3,350, $3,385, and $3,430
GOLD Range-Bound Before Fed – Breakout Above 3349 Unlocks 3374GOLD | Bullish Momentum Builds Ahead of Fed Decision – Key Range Between 3349 and 3312
Fundamental Insight:
Gold is slightly higher as the U.S. dollar weakens ahead of the Fed’s rate decision. Markets await signals on future policy, which could drive sharp moves in gold.
Technical Outlook:
Gold remains bullish while above 3320, with upside potential toward 3349.
A 1H close above 3349 confirms breakout momentum, opening the path toward 3374, and potentially 3401.
A break below 3320, especially below 3312, would invalidate the bullish setup and trigger downside toward 3285, then 3256.
Currently range-bound between 3349 and 3312 — watch for breakout confirmation to determine the next trend direction.
Key Levels:
• Support: 3320 – 3285 – 3256
• Resistance: 3349, 3374 – 3401
Bias: Bullish above 3320
📍 Watch Fed volatility – breakout expected soon
XAUUSD: July 30th Market Analysis and StrategyGold Technical Analysis:
Daily Chart Resistance: 3351, Support: 3300
4-Hour Chart Resistance: 3340, Support: 3310
1-Hour Chart Resistance: 3334, Support: 3315.
Trading risk will increase today. We will focus on the Federal Reserve's interest rate decision and the ADP employment data, which are expected to increase market liquidity. If trading, please avoid news releases.
On the daily chart: Bollinger Bands are moving horizontally, with gold prices trading above the lower band. The MACD indicator has formed a downward death cross, indicating a release of bearish momentum. The RSI indicator has fallen back into the overbought range of 50-40, indicating a clear bottoming out and rebound in gold prices.
On the 4-Hour Chart: Bollinger Bands are narrowing, with gold prices trading near the middle band. The MACD indicator is beginning to turn upward, and the RSI is showing an oversold rebound. Gold prices are poised for an upward rebound! The NY market is focusing on the $3351 resistance level above and the $3308 support level below.
SELL: 3351near
BUY: 3315near

GOLD: Next Move Is Down! Short!
My dear friends,
Today we will analyse GOLD together☺️
The market is at an inflection zone and price has now reached an area around 3,328.24 where previous reversals or breakouts have occurred.And a price reaction that we are seeing on multiple timeframes here could signal the next move down so we can enter on confirmation, and target the next key level of 3,318.05..Stop-loss is recommended beyond the inflection zone.
❤️Sending you lots of Love and Hugs❤️
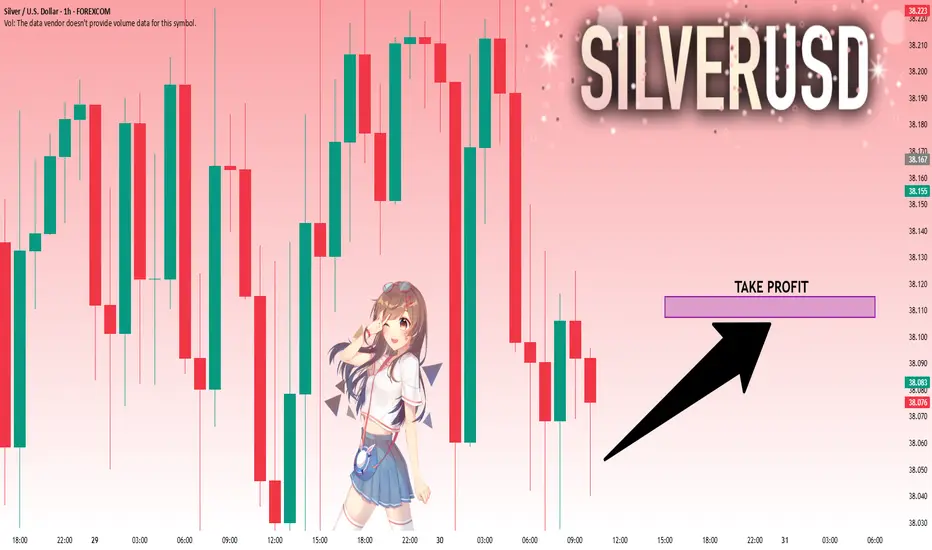
SILVER: Move Up Expected! Long!
My dear friends,
Today we will analyse SILVER together☺️
The recent price action suggests a shift in mid-term momentum. A break above the current local range around 38.054 will confirm the new direction upwards with the target being the next key level of 38.107 and a reconvened placement of a stop-loss beyond the range.
❤️Sending you lots of Love and Hugs❤️
GOLD → False breakdown 3310. Consolidation ahead of news...FX:XAUUSD is forming a false breakdown of support at 3310, thereby confirming the boundaries of the trading range. The dollar is testing strong resistance within the global downtrend. And in the near future, we can expect more economic news...
Gold is trading below the key resistance level of $3345, remaining in a narrow range ahead of the Fed's decision and US GDP data for Q2. Weak data could reinforce expectations of a rate cut and support gold, while strong data would strengthen the dollar. The Fed is likely to keep rates at 4.25–4.5%, with markets pricing in a 64% chance of a 25 bps cut in September. Investors are waiting for signals from Jerome Powell, with a possible split within the Fed: some members may support calls for easing, which would be a driver for gold.
Technically, the situation on D1 is quite interesting. Gold is still below the previously broken trend resistance, but there is no continuation of the momentum. Buyers are reacting to support at 3310, but the market is stagnating due to uncertainty ahead of the news...
Resistance levels: 3345, 3375
Support levels: 3320, 3310, 3287
Thus, from a technical analysis perspective, I expect a retest of 3345, followed by a pullback to support at 3320, from which gold could move higher (if the bulls take the initiative), but if 3320 breaks and 3310 comes under pressure, gold could test 3287. Again, the emphasis is on trend support (the upward line) in the 3335-33450 zone. If the price can consolidate in this zone, we will have confirmation that the price has returned to the boundaries of the upward trend.
Best regards, R. Linda!

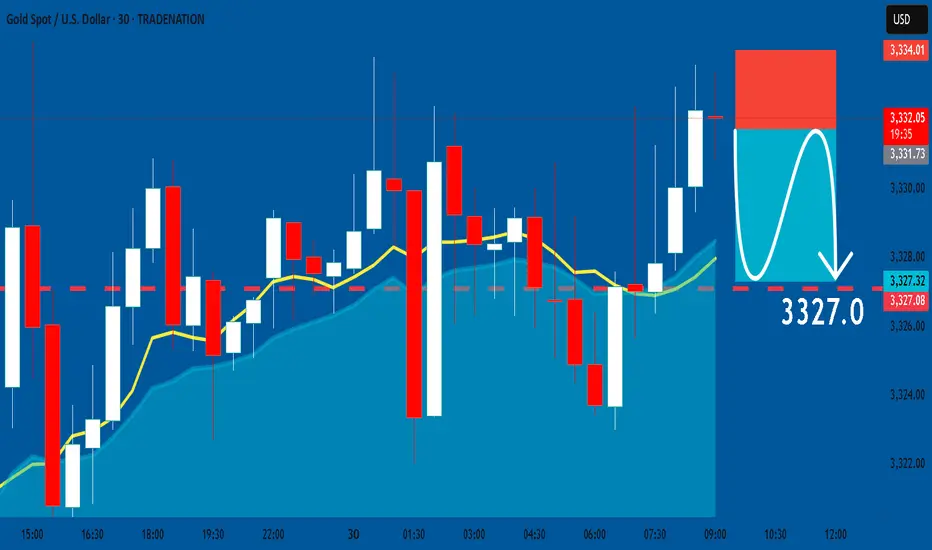
GOLD: Bearish Continuation & Short Trade
GOLD
- Classic bearish pattern
- Our team expects retracement
SUGGESTED TRADE:
Swing Trade
Sell GOLD
Entry - 3331.7
Stop - 3334.0
Take - 3327.0
Our Risk - 1%
Start protection of your profits from lower levels
Disclosure: I am part of Trade Nation's Influencer program and receive a monthly fee for using their TradingView charts in my analysis.
❤️ Please, support our work with like & comment! ❤️
Gold Next Move Possible Hello Traders, Today I’m back with another idea.
As you know gold has changed the trend from bullish to the bearish.
The gold has fallen from the area 3438 to 3351. Now the current price is 3358.
I’m looking for the sell zone, In my view gold will drop till 3310.
I’m monitoring the sell zone 3364-3371, when the market touches the zone, I will add sell and my target will be 3310. Keep in bear my first target is 3351, second target is 3337 and the last target is 3310.
In the case if price breaks the 3377 area then we will have to wait until confirmation for another setup.
Stay Tune for every update.
Kindly share your ideas and leave positive comments. Thanks Everybody.

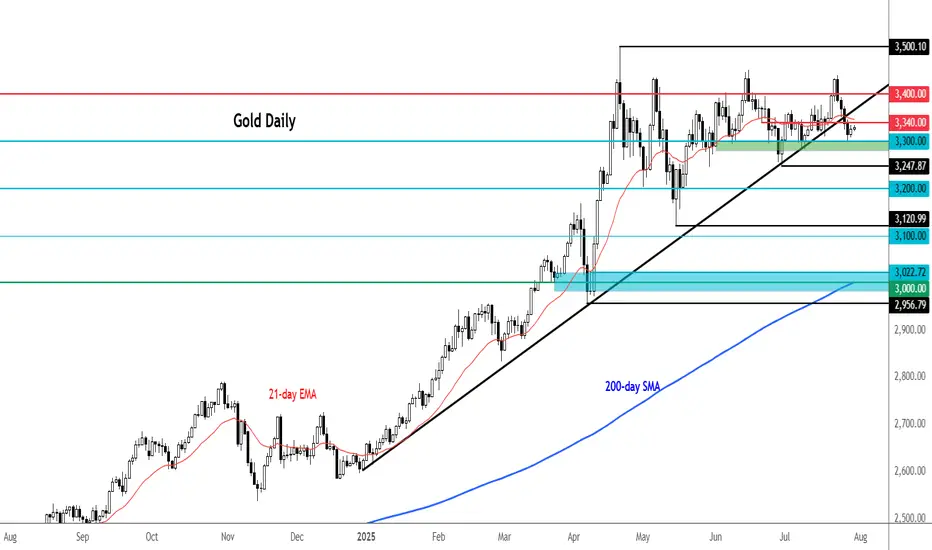
Gold Eyes Breakout From 3-Month Consolidation After reaching its record high of 3500 in April 2025, Gold entered a contracting consolidation phase for more than 3 months now, bounded between the 3500 resistance and 3100 support. This structure sets the stage for a breakout, with price action tracing five waves—raising the probability of another leg higher.
• Bullish Scenario: A close above the 3450 level could open the door to 3780 and even 4000, aligning with the broader monthly cup-and-handle formation target.
• Bearish Scenario: A close below 3300 could expose the market to downside risks, with potential retracements to 3280, 3250, 3200, and 3130.
Written by Razan Hilal, CMT

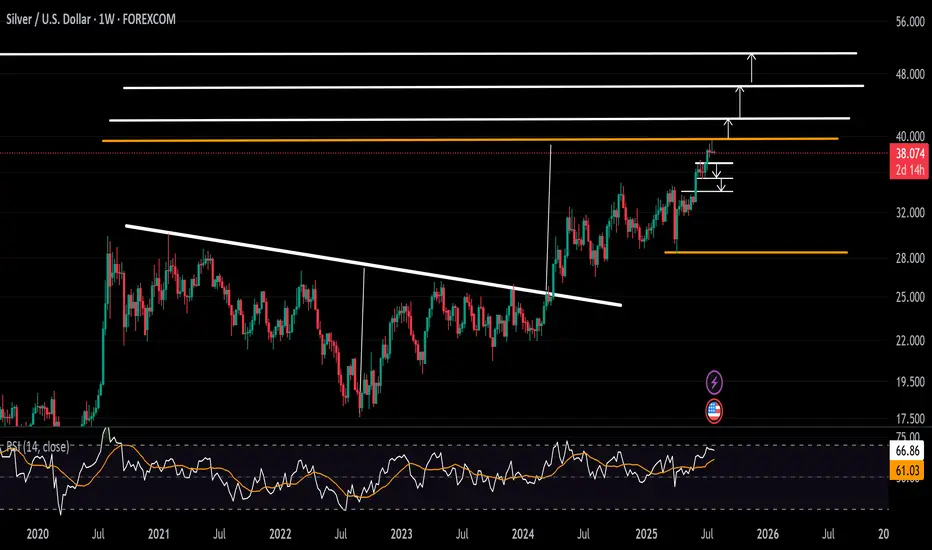
Silver Signals Pullback Risks From $40 BarrierFrom a fundamental standpoint, the strength seen in both tech and silver markets in 2025 may be supported by the structural integration of AI and innovation into global economic agendas. As AI and technology increasingly become the backbone of global infrastructure and development, demand is likely to remain strong.
Silver is currently retreating from the $40 psychological zone, the 39.50 high, which aligns with the target of an inverted head and shoulders pattern formed between August 2020 and March 2024.
• Pullback Scenario: In line with weekly overbought momentum as per the RSI indicator, a retracement may target support levels at $37, $36.20, and $35.20 before resuming its broader bullish trend.
• Breakout Scenario: A confirmed close above $40 may open the door to $42, $46, and potentially a move beyond $50.
Written by Razan Hilal, CMT
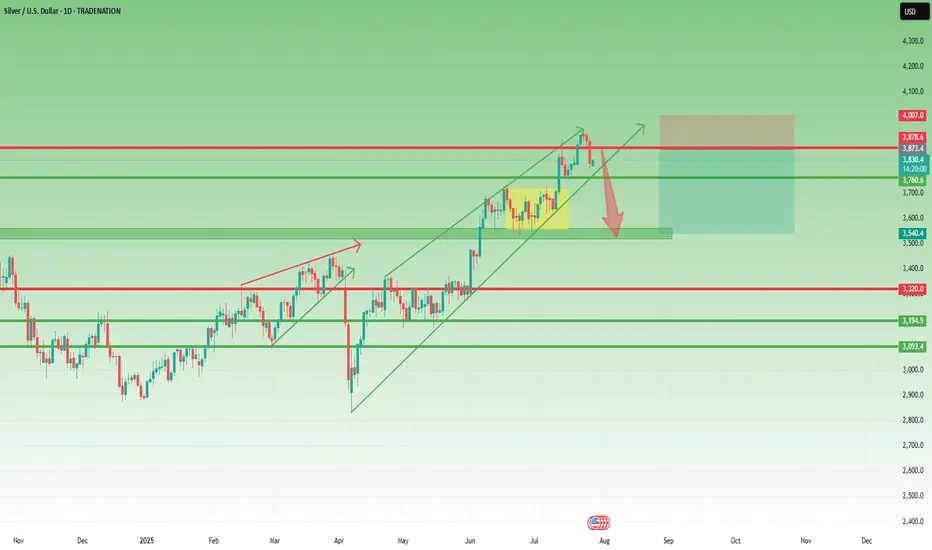
XAGUSD – Reversal Signs After the Run Toward $40Lately, I’ve been a strong advocate for a Silver rally toward $40, and indeed, we got a solid move, with price reaching as high as $39.50, not touching 40 though...
Just like with Gold, the last 3 days of last week turned bearish, and now it looks like we may be entering the early stage of a correction.
📉 Current Setup:
- The rejection from $39.50, right below the psychological $40 level, is significant
- I’ll be monitoring for a possible short entry if we get a rebound into the $38.80–$39.00 zone
- A new high above $39.50 would invalidate this setup
📌 On the downside, if price breaks below the confluence support at $37.70–$38.00, that would confirm the reversal and could lead to an acceleration toward $35.50 support
Conclusion:
The bullish narrative on Silver is pausing here. Until a new high is made, I’m looking to sell the bounce and follow the momentum if the breakdown under support is confirmed.
Let’s see how this plays out this week. 🧭
Disclosure: I am part of TradeNation's Influencer program and receive a monthly fee for using their TradingView charts in my analyses and educational articles.
[XAUUSD – Intraday Price Action Outlook | 30 July 2025Gold (XAUUSD) is currently trading around 3,329 USD and is consolidating within a narrow rising channel after completing a significant downtrend. The market is showing signs of a potential breakout, either to continue a short-term bullish correction or resume the dominant bearish momentum.
Key Technical Zones:
Resistance zone: 3,339.2 – 3,348
This is a critical zone where bullish breakout confirmation is likely to attract momentum buyers. The zone aligns with upper trendline resistance and previous consolidation highs.
Support zone: 3,325.6 – 3,292.7
This range acts as a short-term support base, marked by multiple rejections and aligned with the lower boundary of the current rising wedge formation. A breakdown here could trigger strong bearish continuation.
Indicators & Confluences:
EMA200 (blue): Acting as dynamic resistance, slightly above current price.
EMA50 & EMA100: Compressing toward current price action, indicating price equilibrium and coiling volatility.
RSI (not shown): Likely hovering near 50 – signaling market indecision.
Fibonacci 0.874 has been tagged – often a zone where false breakouts or liquidity grabs occur, demanding caution.
Trading Strategy Suggestions:
Bullish Scenario (Breakout Strategy)
Entry: Buy only if price closes above 3,339.2 (confirmed breakout of wedge).
Stop-loss: Below 3,328.1 (previous supply turned demand).
Target: 3,370 – 3,392 zone (aligned with EMA200 breakout & prior structure).
Note: This setup relies on confirmation and should not be anticipated early. Wait for candle close above 3,339.2 to invalidate current wedge structure.
Bearish Scenario (Rejection & Breakdown Strategy)
Entry: Sell if price rejects 3,330–3,332 area and returns below 3,327.80 (as marked).
Stop-loss: Above 3,332.04 (above trendline and EMA cross).
Target: 3,292.74 (volume node + base of channel).
Risk/Reward: >7.0 (based on current tool parameters shown in chart).
This is a favorable setup if price respects current wedge resistance and fails to breakout convincingly.
Conclusion:
Gold is at a decisive point. The formation of a rising wedge in a prior downtrend signals potential bearish continuation, but a breakout above 3,339.2 could trigger a reversal short-term. Both bulls and bears need confirmation before entering. Monitor volume closely — rising volume on breakout/breakdown will validate either scenario.

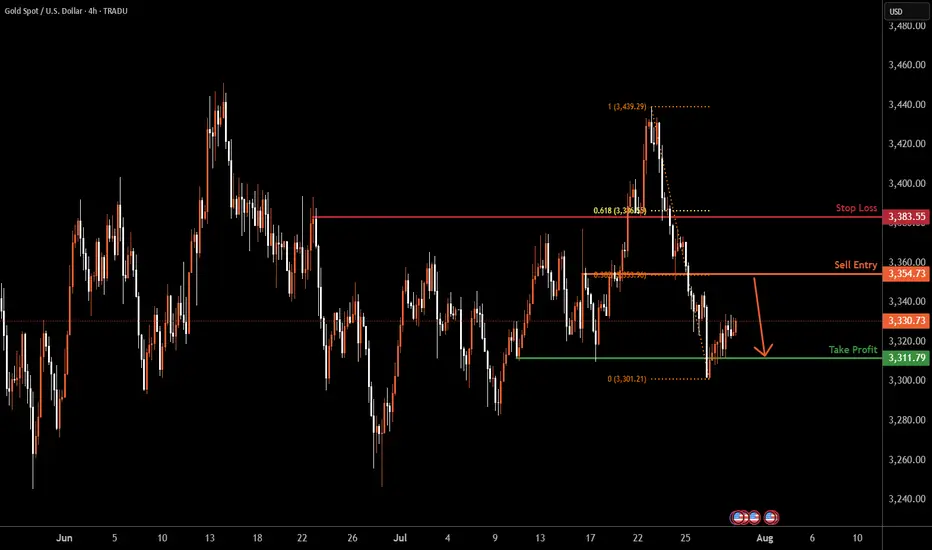
XAUUSD H4 | Heading into pullback resistanceBased on the H4 chart analysis, the price is rising towards the sell entry, which is a pullback resistance that lines up with the 38.2% Fibonacci retracement and could drop to the take profit.
Sell entry is at 3,354.73, which is a pullback resistance that aligns with the 38.2% Fibonacci retracement.
Stop loss is at 3,383.55, which is a pullback resistance that is slightly below the 61.8% Fibonacci retracement.
Take profit is at 3,311.79, which is a multi-swing low support.
High Risk Investment Warning
Trading Forex/CFDs on margin carries a high level of risk and may not be suitable for all investors. Leverage can work against you.
Stratos Markets Limited (tradu.com ):
CFDs are complex instruments and come with a high risk of losing money rapidly due to leverage. 65% of retail investor accounts lose money when trading CFDs with this provider. You should consider whether you understand how CFDs work and whether you can afford to take the high risk of losing your money.
Stratos Europe Ltd (tradu.com ):
CFDs are complex instruments and come with a high risk of losing money rapidly due to leverage. 66% of retail investor accounts lose money when trading CFDs with this provider. You should consider whether you understand how CFDs work and whether you can afford to take the high risk of losing your money.
Stratos Global LLC (tradu.com ):
Losses can exceed deposits.
Please be advised that the information presented on TradingView is provided to Tradu (‘Company’, ‘we’) by a third-party provider (‘TFA Global Pte Ltd’). Please be reminded that you are solely responsible for the trading decisions on your account. There is a very high degree of risk involved in trading. Any information and/or content is intended entirely for research, educational and informational purposes only and does not constitute investment or consultation advice or investment strategy. The information is not tailored to the investment needs of any specific person and therefore does not involve a consideration of any of the investment objectives, financial situation or needs of any viewer that may receive it. Kindly also note that past performance is not a reliable indicator of future results. Actual results may differ materially from those anticipated in forward-looking or past performance statements. We assume no liability as to the accuracy or completeness of any of the information and/or content provided herein and the Company cannot be held responsible for any omission, mistake nor for any loss or damage including without limitation to any loss of profit which may arise from reliance on any information supplied by TFA Global Pte Ltd.
The speaker(s) is neither an employee, agent nor representative of Tradu and is therefore acting independently. The opinions given are their own, constitute general market commentary, and do not constitute the opinion or advice of Tradu or any form of personal or investment advice. Tradu neither endorses nor guarantees offerings of third-party speakers, nor is Tradu responsible for the content, veracity or opinions of third-party speakers, presenters or participants.
Gold Price Analysis July 30Gold (XAUUSD) Consolidating in a Triangle Pattern – Preparing for a Big Breakout
Currently, gold is moving within a triangle consolidation pattern, reflecting the market’s indecision as investors await a series of important economic data from the US this week. This hesitation suggests that a breakout from the triangle pattern could trigger a strong FOMO effect, creating a significant price movement in either direction.
The current price action is similar to a “bull flag” or “pennant” pattern, where a breakout could lead to a clearer and more decisive trend. If the support zone in the pattern fails to hold, the possibility of a sell-off is high.
Trading scenario:
🔻 Activate SELL order:
When price breaks the triangle bottom around 3324
Downside target: 3285, further is the strong support zone at 3250
🔺 Activate BUY order:
When price breaks and holds above the resistance zone 3333
Or: when there is a bearish rejection signal and candle confirmation at the area 3385

Gold - Powerful RunAfter its powerful run, gold has shown signs of fatigue, stalling near technical resistance between $3,330–$3,350 per ounce in late July. Analysts warn that while the bullish trend remains intact on a structural level, daily volatility is high and some profit-taking or consolidation could continue unless new destabilizing events emerge.
Will the Rally Continue?
The Bull Case
Structural Demand: Multiple sources, including J.P. Morgan and other major forecast groups, predict gold’s structural bull case remains strong with average prices of $3,220–$3,675 per ounce likely through the end of 2025, and even $4,000 possible by 2026.
Ongoing Uncertainty: Persistent geopolitical risks, trade disputes, and fiscal pressures are expected to maintain robust safe haven flows into gold.
Central Bank and Asian Demand: Sustained buying by central banks and consumers in Asia could provide a solid floor below current levels.
The Bear Case
Interest Rate Dynamics: If central banks, especially the US Federal Reserve, hold or increase interest rates, gold could lose momentum, higher rates increase the opportunity cost of holding non yielding bullion.
Diminishing New Risks: Unless fresh economic or geopolitical shocks appear, further upside may be capped in the near term. Several experts predict gold may consolidate or trade sideways pending new catalysts.
Speculator Flows: Rapid speculative bets could lead to sharp corrections, particularly on technical breakdowns after such a strong rally.
Conclusion
The gold rally of 2025 has been driven by an unusual mix of global volatility, central bank behavior, and shifting investor psychology. While prices could pause or pull back in the coming months, the fundamental supports structural demand, central bank buying, and persistent global risks, suggest that the broader gold bull cycle is not yet over, with $3,000+ likely forming the new base for gold as we look toward 2026.
*NOT INVESTMENT ADVICE*
#gold #safehaven #uncertainty #economy #finance #trading #indicator
