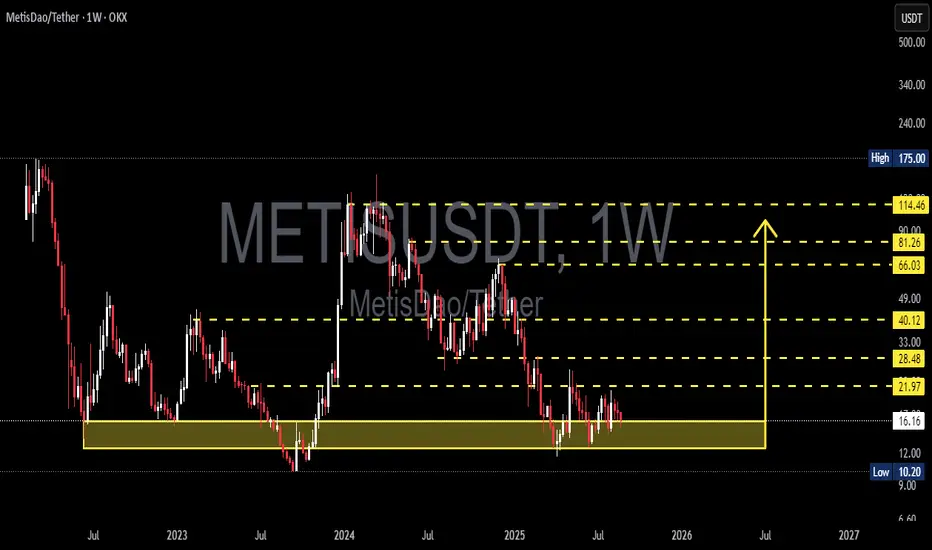
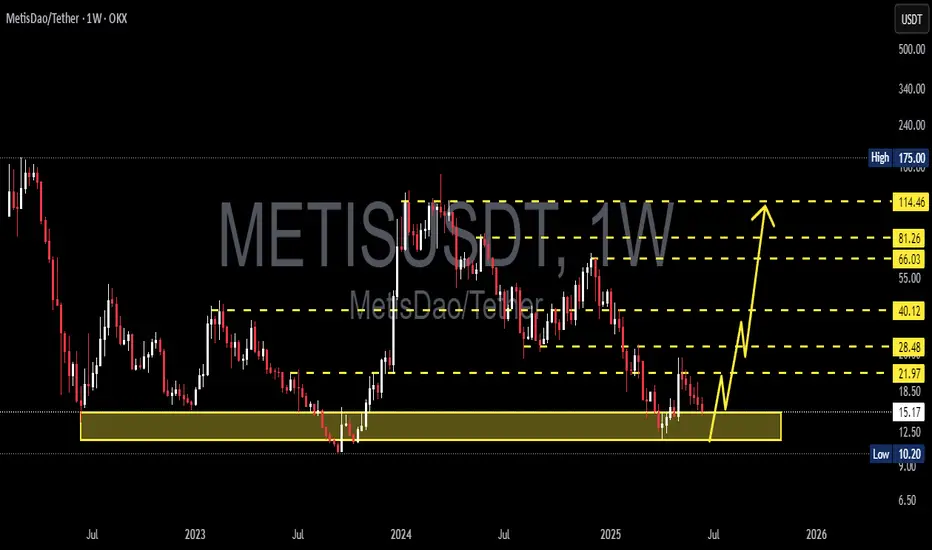
METIS/USDT — Major Accumulation or Breakdown Ahead?Currently, METIS/USDT is trading inside a very crucial demand zone at $10.20 – $16.16 (highlighted in yellow). This area has acted as strong support multiple times since 2022–2025, preventing deeper sell-offs. In other words, this is the last line of defense for buyers and a potential accumulation zone before a major move.
---
🔎 Technical Structure & Pattern
Macro trend: Since the 2024 peak, METIS has been forming a series of lower highs, signaling that the medium-term downtrend is still intact.
Key zone: The $10–16 range is a historical demand zone where buyers have consistently stepped in. Holding above this area increases the probability of a trend reversal.
Current formation: Price action shows a sideways movement within this demand zone → often referred to as a base-building phase or accumulation phase. Historically, such phases are followed by explosive moves either upward or downward.
---
🚀 Bullish Scenarios
1. Rebound from demand zone
If METIS holds above $10.20–$16.16 and prints a strong bullish weekly candle, a rally could begin.
Short-term upside targets: $21.97 → $28.48 → $40.12 (weekly resistances).
2. Medium-term reversal
A true reversal becomes more likely once price breaks and closes weekly above $40.12.
If confirmed, higher targets could unfold: $66.03 → $81.26 → $114.46.
This would mark the transition from lower highs to higher highs — a signal of a new bullish cycle.
---
🔻 Bearish Scenarios
1. Breakdown of demand zone
If price fails to hold and weekly closes below $10.20, the structure breaks down.
This opens the door for deeper declines, potentially towards $7–8 psychological levels.
2. False rally / rejection
If price rallies to $21–28 but gets rejected with strong bearish weekly candles, it would suggest weak buyers.
In that case, price could revisit the demand zone, keeping the downtrend intact.
---
🎯 Key Takeaways
The $10–16 zone is the most critical area on this chart → both a last defense for bulls and a potential golden accumulation zone for long-term positions (with strict risk management).
Bullish confirmation: A weekly close above $21.97 – $40.12.
Bearish confirmation: A weekly close below $10.20 → signaling a full breakdown.
---
📌 Important Note
Trading around such critical zones requires patience and confirmation. Avoid chasing moves blindly — wait for weekly candle confirmations (breakouts or breakdowns). Remember: accumulation phases can last longer than expected before a big move unfolds.
#METIS #METISUSDT #CryptoAnalysis #Altcoin #TechnicalAnalysis #PriceAction #SupportResistance #SwingTrading #CryptoMarket
Metisusdtperp
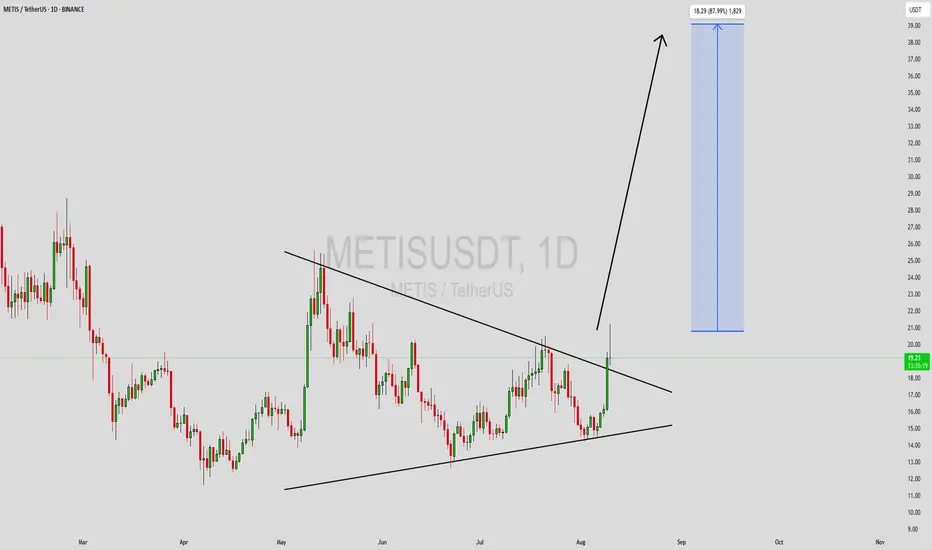
METISUSDT Forming Falling WedgeMETISUSDT is forming a well-defined falling wedge pattern, a classic bullish reversal setup indicating the downtrend may be nearing exhaustion. Price action has narrowed between descending support and resistance lines, signaling that selling pressure is fading and key levels are being defended by accumulation. When combined with solid trade volume, this setup points toward high probability upside.
Volume remains consistently strong, reflecting growing investor interest as the structure evolves. This accumulation behavior at lower levels is a telltale sign that market participants are positioning for a breakout. Should price pierce the upper wedge trendline with conviction, the expected move aligns well with the projected 70% to 80%+ rally, making it a compelling scenario for breakout-focused traders.
Investor sentiment around Metis is steadily improving, supported by broader awareness of its Layer-2 scaling solutions and active development roadmap. This renewed enthusiasm enhances the technical case and may provide momentum if the breakout occurs. Traders looking for high reward setups are especially attentive to the confirmation signals.
A confirmed breakout above the wedge resistance with sustained volume could mark the beginning of a strong trend reversal. If you’re watching for an attractive risk-to-reward opportunity backed by both chart structure and market interest, METISUSDT deserves a spot on your radar.
✅ Show your support by hitting the like button and
✅ Leaving a comment below! (What is You opinion about this Coin)
Your feedback and engagement keep me inspired to share more insightful market analysis with you!
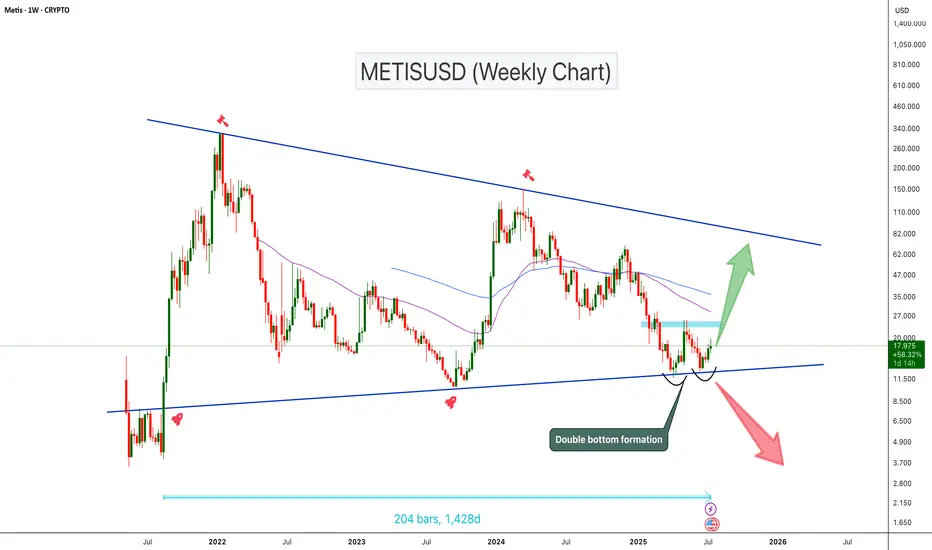
METISUSD Double Bottom at Triangle Support!METISUSD has been trading inside a symmetrical triangle for the past 1,400 days. The price is currently sitting at the triangle support and forming a potential double bottom pattern. The double bottom can be confirmed once the price breaks the neckline resistance zone. If the price breaks this key resistance zone, we could expect a 100%–250% bullish move toward the triangle’s upper resistance
Cheers
Hexa🧘♀️
BINANCE:METISUSDT SEED_DONKEYDAN_MARKET_CAP:METIS
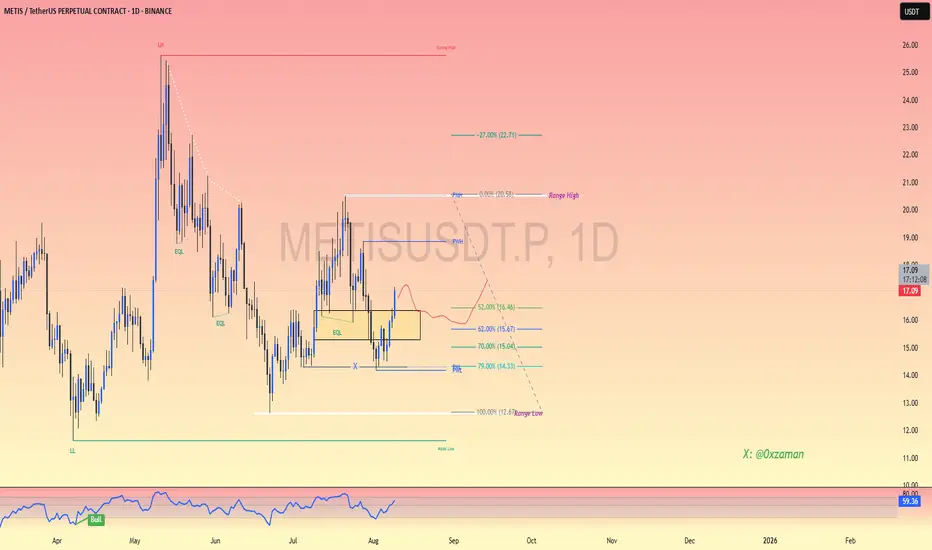
METISUSDT 1W AnalysisMETIS ~ 1W Analysis
#METIS Buy back gradually from here if you still have confidence in this coin with a short term target of at least 20%+ from here.
#METIS/USDT#METIS
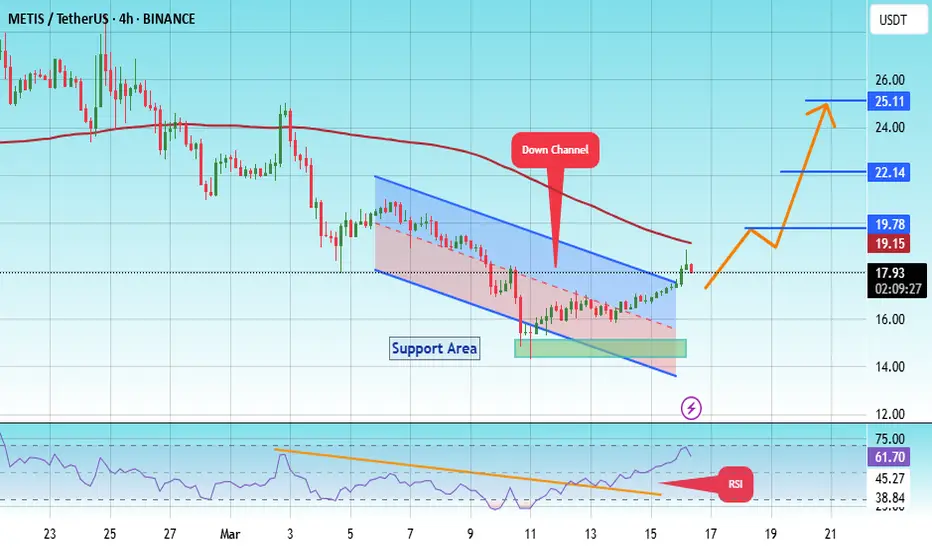
The price is moving within a descending channel on the 1-hour frame, adhering well to it, and is heading for a strong breakout and retest.
We are seeing a bounce from the lower boundary of the descending channel, this support at 14.73.
We have a downtrend on the RSI indicator that is about to be broken and retested, supporting the upward trend.
We are looking for stability above the 100 moving average.
Entry price: 18
First target: 19.78
Second target: 22
Third target: 25
METISUSDT 1WMETIS ~ 1W Analysis
#METIS Buy gradually from here with a short -term target of at least 20%+. This is the lowest support for now.

METISUSDT 4DMETIS ~ 4D
#METIS So far it still maintains this support block,. If you still have Conviction on this coin,. Buy from here with a minimum target of 20%+

METISUSDT Breaks Out of Descending Channel: Bullish Rally ExpectMETISUSDT technical analysis update
METIS has broken the descending channel resistance line on the daily chart and is now preparing to break the previous higher low. If the price successfully breaks the previous higher low, we can expect a strong bullish move. Additionally, the price is about to cross above the 100 EMA on the daily chart.
Regards,
Hexa
