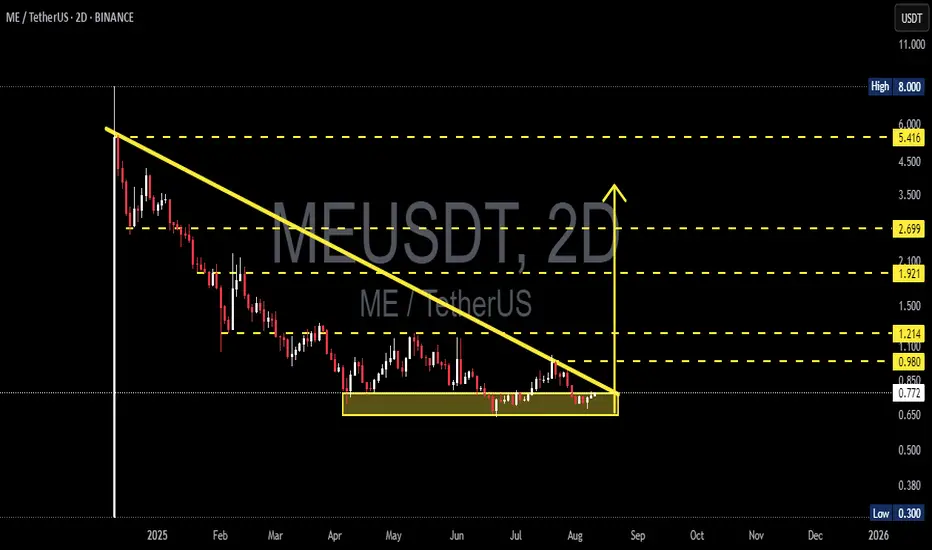
ME/USDT (2D) — Last Stand at the Support Zone!ME/USDT is now at a make-or-break moment. After a prolonged downtrend since the start of the year, price action has formed a Descending Triangle — a combination of a falling trendline pressing down from above and a strong horizontal support between 0.65 – 0.85 USDT.
📌 Why this zone matters:
This yellow zone has repeatedly absorbed heavy selling pressure.
A breakdown below it could open the door to a much deeper fall.
Conversely, a breakout above could be the first sign of a trend reversal.
---
🔍 Pattern Analysis
Descending Trendline Resistance
Every rally attempt since the yearly top has been capped by this dynamic resistance, keeping lower highs intact.
Horizontal Support Zone (Yellow Box)
This area acts as the “last wall” for buyers. While it holds, the bullish case is alive.
Descending Triangle Structure
Statistically, this pattern tends to break down if formed after a strong downtrend — but in crypto, sudden sentiment shifts or fundamentals can flip the script.
---
📈 Bullish Scenario
1. Strong Breakout: A 2D candle close above the descending trendline and 0.98 USDT.
2. Successful Retest: Price retests the breakout zone and holds above it.
3. Upside Targets:
Target 1: 1.214 USDT (+57%)
Target 2: 1.921 USDT (+149%)
Extended Target: 2.699 USDT if momentum surges.
4. Volume Confirmation: Without strong volume, breakouts risk being fakeouts.
---
📉 Bearish Scenario
1. Breakdown: A 2D candle close below 0.65 USDT (bottom of the support zone).
2. Failed Retest: Price attempts to reclaim support but gets rejected.
3. Downside Targets:
Initial Target: 0.50 USDT
Extreme Target: 0.30 USDT (lowest point shown on chart).
4. Acceleration Risk: Strong volume + weak market sentiment can accelerate the drop.
---
📊 Key Levels to Watch
Resistance: 0.98 | 1.214 | 1.921 | 2.699 | 5.416
Support: 0.65 (major) | 0.50 | 0.30 (extreme low)
---
💡 Trader’s Notes
Descending triangle + strong support = high-stakes setup.
Wait for confirmed 2D candle closes and volume spikes before entering.
Always manage risk with clear stop-loss levels & proper position sizing (risk < 2% capital).
Watch for news catalysts or shifts in broader market sentiment.
#ME #MEUSDT #Crypto #TechnicalAnalysis #DescendingTriangle #Support #Resistance #Breakout #Breakdown
MEUSD
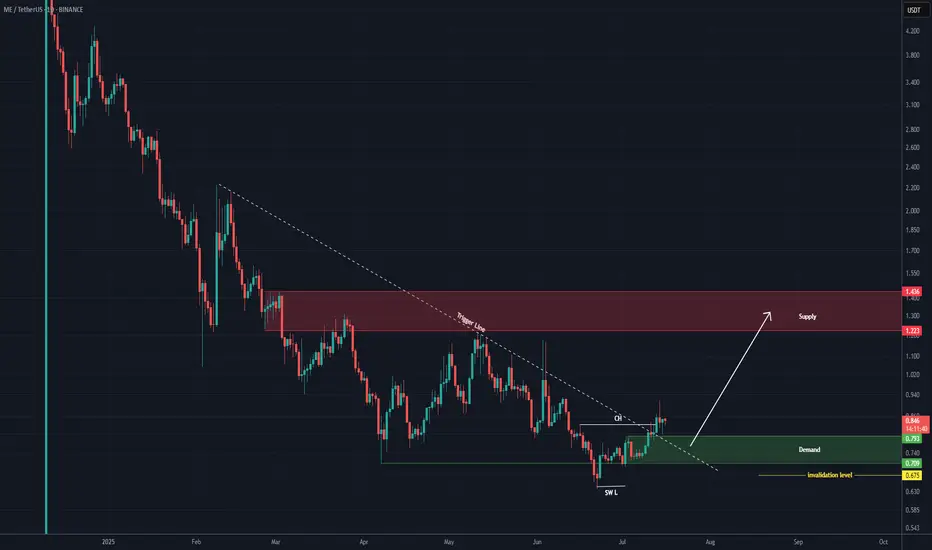
ME Analysis (1D)After holding above the support zone, we have a bullish Change of Character (CH) on the chart, which is a bullish sign. Additionally, the trigger line has been broken.
After a slight pullback, the price may move toward the targets.
The targets are marked on the chart.
A daily candle closing below the invalidation level will invalidate this analysis.
For risk management, please don't forget stop loss and capital management
When we reach the first target, save some profit and then change the stop to entry
Comment if you have any questions
Thank You
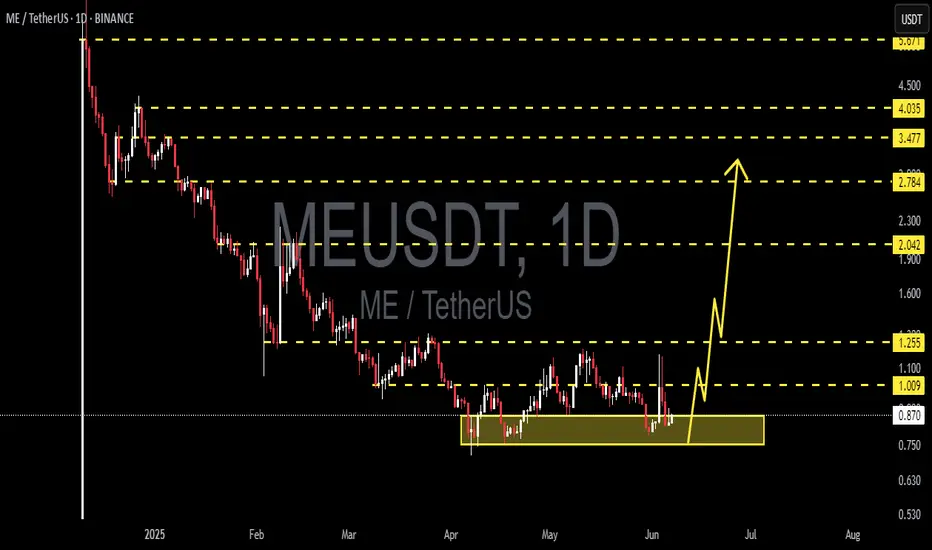
MEUSDT 1D AnalysisME ~ 1D Analysis
#ME This trade is very high risk
Buy gradually from here with a short term target of at least 15%+ from here.
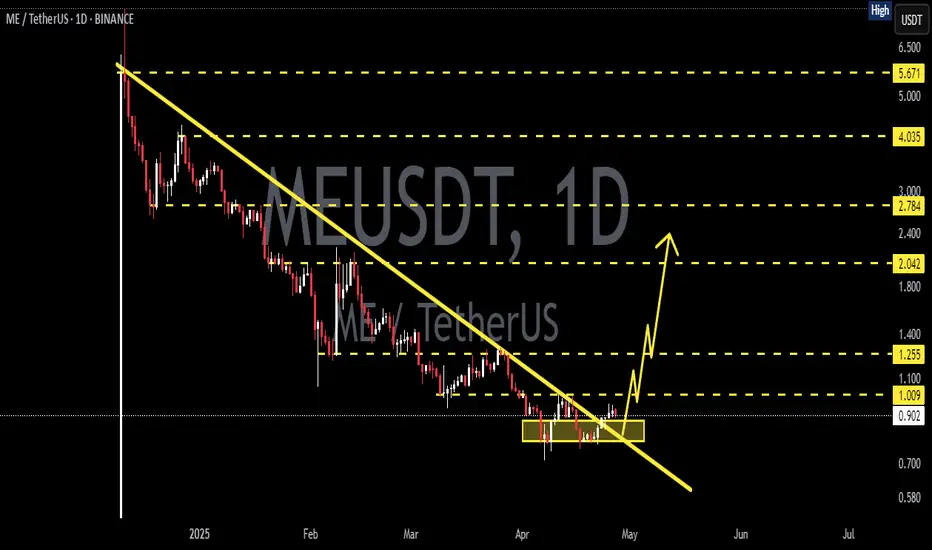
MEUSDT 1D AnalysisME ~ 1D Analysis
#ME This trade is very high risk
Buy from here if you still have a Conviction on this coin with a short -term target of at least 10%+.
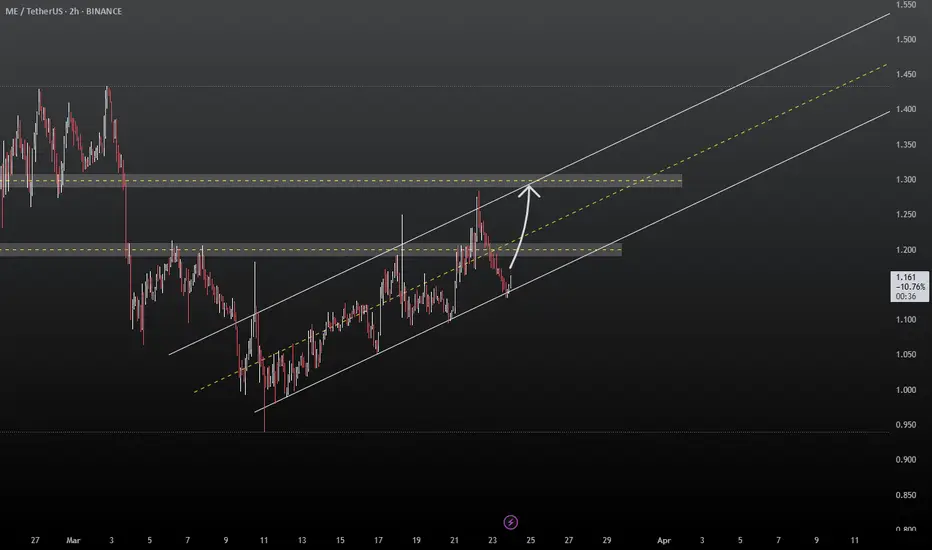
MEUSDT: Ascending Channel - Is $1.300 the Next Stop?Fellow traders!
MEUSDT is exhibiting classic ascending channel behavior. Having tested the lower channel boundary, the price is likely to advance towards the upper channel boundary, with a potential target near $1.300.
Implement prudent risk management.
BINANCE:MEUSDT
$me magic eden $MEUSDmoving forward i am bullish on magic eden... we are traveling in a nice uptrend in a nice channel.... we currently have a fib resistence at $3.77 which i personally think we will retest before the weekend is over...the channel support line is in the low 3.20's if you are looking to add on a pullback...as we approach the $3.776 range keep an eye on !total to see what the marketcap is doing.... if btc dominence is going down and money is flowing into alts, i expect volume to pick up as we push thru the resistence area. if marketcap starts to drop though i can see the price here coming back down to retest the $3.12 current swing low that was created last week. Price for this token dumped hard after an initail luanch of the token sent out 1,000s to some holders, which where dumped onto the market....a lot of investors into this project tho are staking as many coins as possible to maximize the sites rewards. lockup period is thru mid march to end of march....Stay tuned as i will keep you updated on this chart. Give me a like and follow....Share on X.com also if you like my TA and have found it helpful. Thanks
