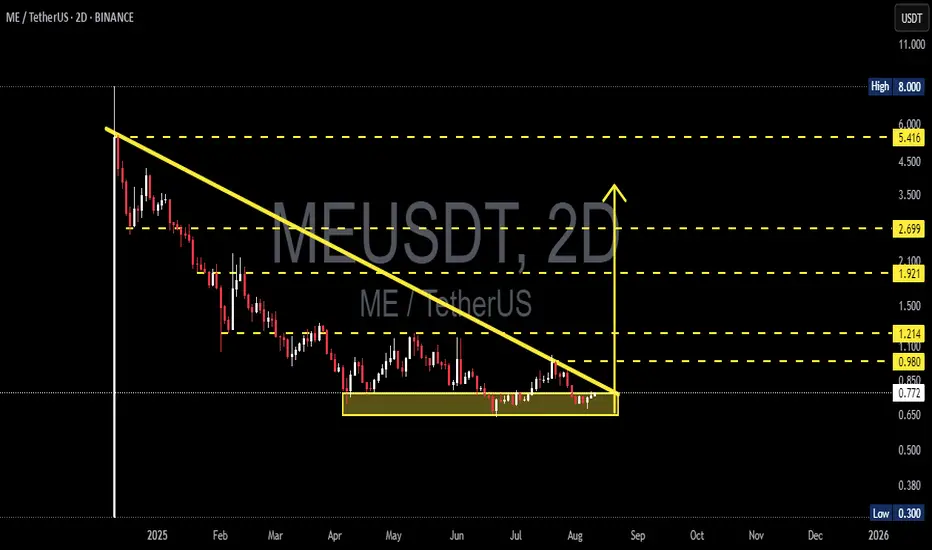
ME/USDT (2D) — Last Stand at the Support Zone!ME/USDT is now at a make-or-break moment. After a prolonged downtrend since the start of the year, price action has formed a Descending Triangle — a combination of a falling trendline pressing down from above and a strong horizontal support between 0.65 – 0.85 USDT.
📌 Why this zone matters:
This yellow zone has repeatedly absorbed heavy selling pressure.
A breakdown below it could open the door to a much deeper fall.
Conversely, a breakout above could be the first sign of a trend reversal.
---
🔍 Pattern Analysis
Descending Trendline Resistance
Every rally attempt since the yearly top has been capped by this dynamic resistance, keeping lower highs intact.
Horizontal Support Zone (Yellow Box)
This area acts as the “last wall” for buyers. While it holds, the bullish case is alive.
Descending Triangle Structure
Statistically, this pattern tends to break down if formed after a strong downtrend — but in crypto, sudden sentiment shifts or fundamentals can flip the script.
---
📈 Bullish Scenario
1. Strong Breakout: A 2D candle close above the descending trendline and 0.98 USDT.
2. Successful Retest: Price retests the breakout zone and holds above it.
3. Upside Targets:
Target 1: 1.214 USDT (+57%)
Target 2: 1.921 USDT (+149%)
Extended Target: 2.699 USDT if momentum surges.
4. Volume Confirmation: Without strong volume, breakouts risk being fakeouts.
---
📉 Bearish Scenario
1. Breakdown: A 2D candle close below 0.65 USDT (bottom of the support zone).
2. Failed Retest: Price attempts to reclaim support but gets rejected.
3. Downside Targets:
Initial Target: 0.50 USDT
Extreme Target: 0.30 USDT (lowest point shown on chart).
4. Acceleration Risk: Strong volume + weak market sentiment can accelerate the drop.
---
📊 Key Levels to Watch
Resistance: 0.98 | 1.214 | 1.921 | 2.699 | 5.416
Support: 0.65 (major) | 0.50 | 0.30 (extreme low)
---
💡 Trader’s Notes
Descending triangle + strong support = high-stakes setup.
Wait for confirmed 2D candle closes and volume spikes before entering.
Always manage risk with clear stop-loss levels & proper position sizing (risk < 2% capital).
Watch for news catalysts or shifts in broader market sentiment.
#ME #MEUSDT #Crypto #TechnicalAnalysis #DescendingTriangle #Support #Resistance #Breakout #Breakdown
MEUSDT
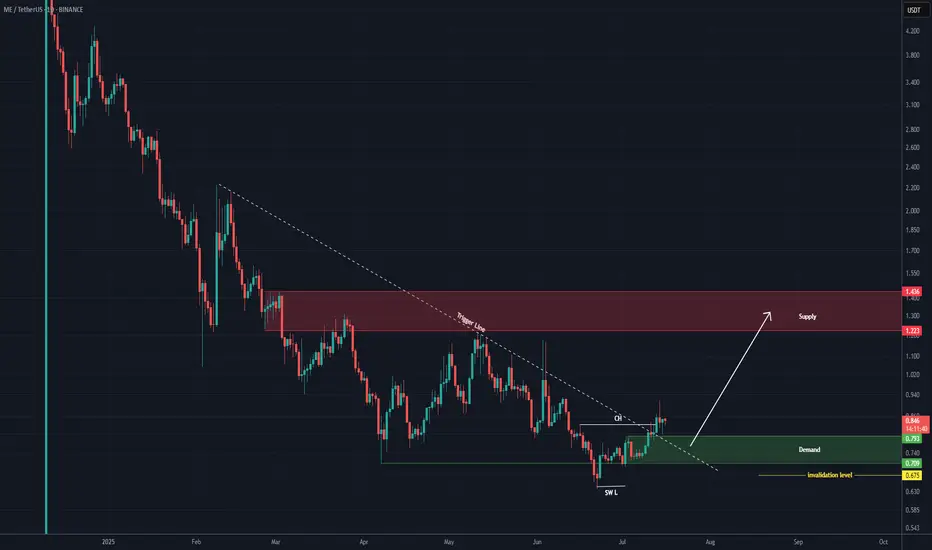
ME Analysis (1D)After holding above the support zone, we have a bullish Change of Character (CH) on the chart, which is a bullish sign. Additionally, the trigger line has been broken.
After a slight pullback, the price may move toward the targets.
The targets are marked on the chart.
A daily candle closing below the invalidation level will invalidate this analysis.
For risk management, please don't forget stop loss and capital management
When we reach the first target, save some profit and then change the stop to entry
Comment if you have any questions
Thank You
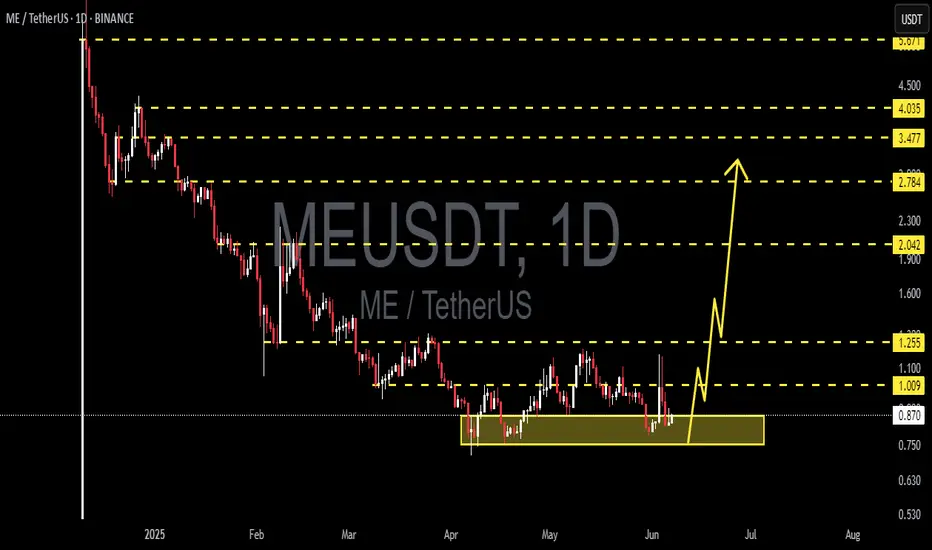
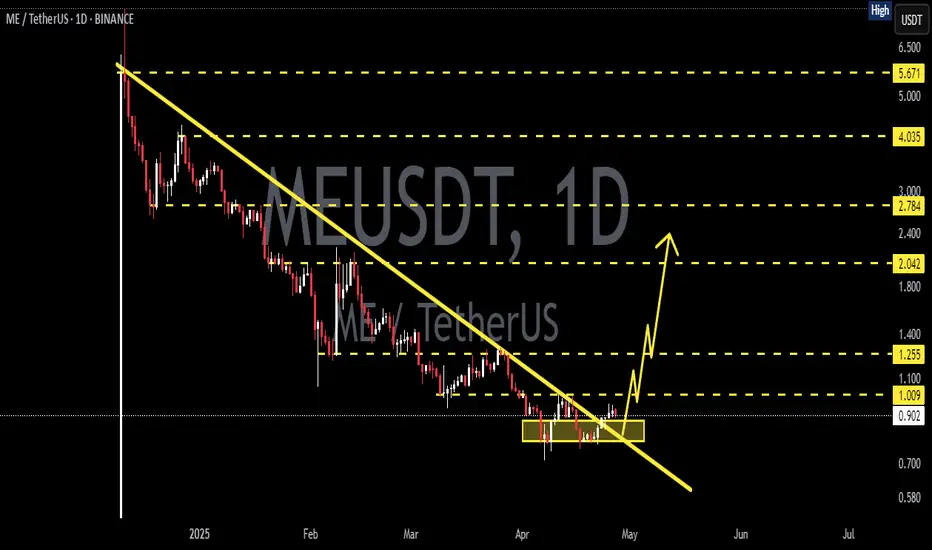
MEUSDT 1D AnalysisME ~ 1D Analysis
#ME This trade is very high risk
Buy gradually from here with a short term target of at least 15%+ from here.
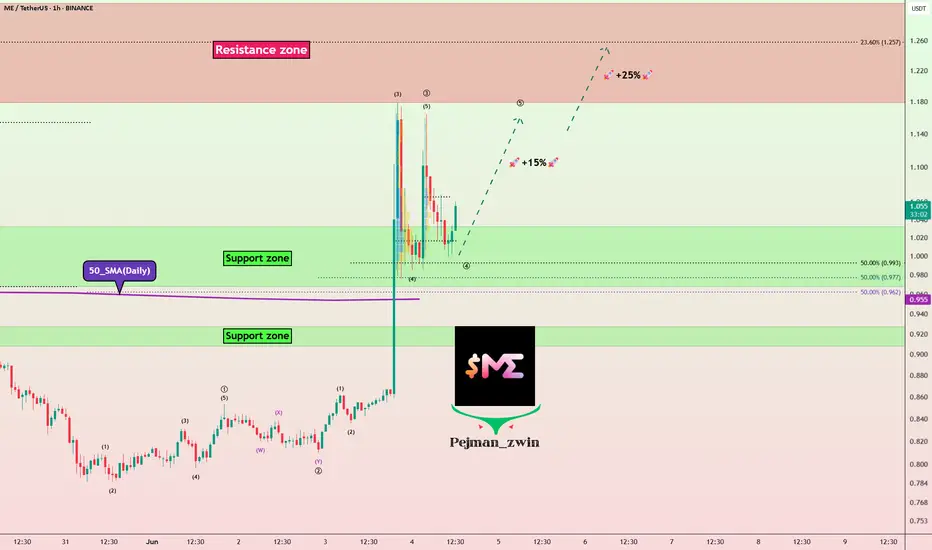
Magic Eden’s ME Token Eyes Bounce After Trump Wallet VolatilityOn June 3, , Magic Eden ( BINANCE:MEUSDT ) announced a collaboration with a project called to launch a new" Trump Wallet "
This announcement triggered a + 35% price increase , pushing the price of ME Token to approximately $1.17 .
However, shortly afterward, members of the Trump family, including Donald Trump Jr. , denied any involvement with the wallet or the project.
This resulted in a -20% price drop due to shaken investor confidence .
-----------------------------
Let’s see how ME Token is doing on the 1-hour timeframe .
ME Token is trading in the Support zone($1.03-$0.96) near the 50_SMA(Daily) .
From the Elliott Wave theory perspective, ME Token seems to have completed the main wave 3 and is currently completing the main wave 4 .
I expect ME Token to rise to at least $1.146(+15%) .
Second Target: $1.237
Note: Stop Loss = $0.95
Please respect each other's ideas and express them politely if you agree or disagree.
Magic Eden Analyze (MEUSDT), 1-hour time frame.
Be sure to follow the updated ideas.
Do not forget to put a Stop loss for your positions (For every position you want to open).
Please follow your strategy and updates; this is just my Idea, and I will gladly see your ideas in this post.
Please do not forget the ✅' like '✅ button 🙏😊 & Share it with your friends; thanks, and Trade safe.
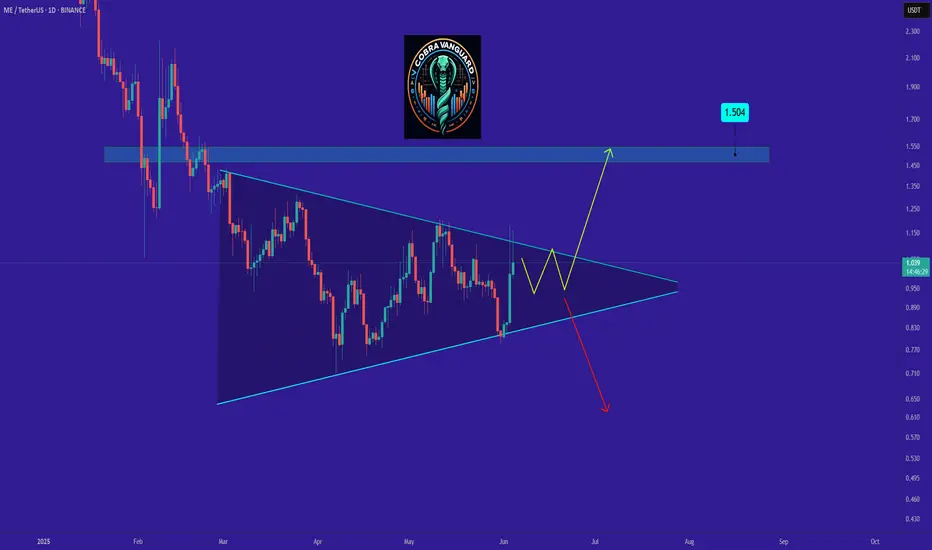
Me !!!The price on the daily timeframe is within a triangle, which can create some uncertainty about which direction it will move. Here, we should wait to see which side of the triangle the price breaks out from. Remember, the trend is our friend.
Best regards CobraVanguard.💚
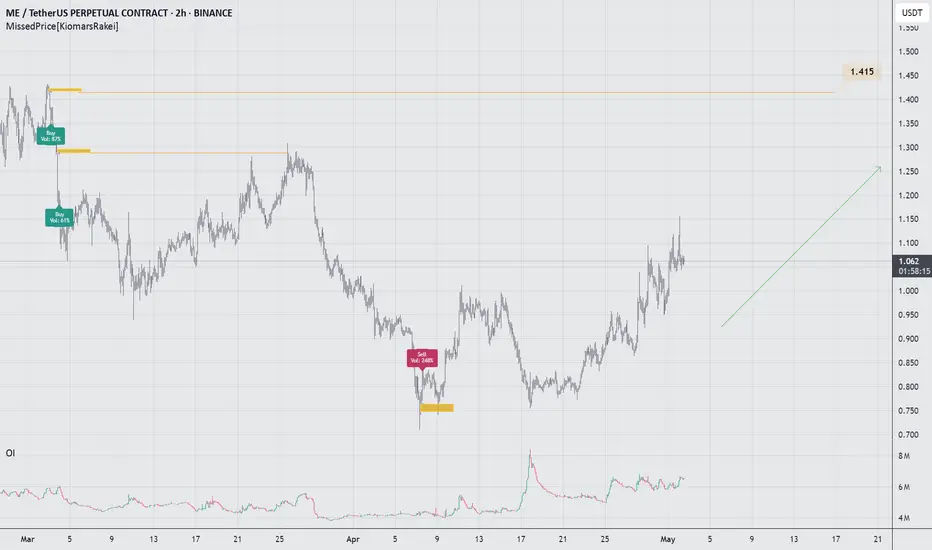
ME Likely to Revisit 1.415 ZoneBased on the MissedPrice concept, rapid price moves often skip levels that price later revisits. The 1.415 level shows an Open Interest leap, suggesting missed positions.
MEUSDT 1D AnalysisME ~ 1D Analysis
#ME This trade is very high risk
Buy from here if you still have a Conviction on this coin with a short -term target of at least 10%+.
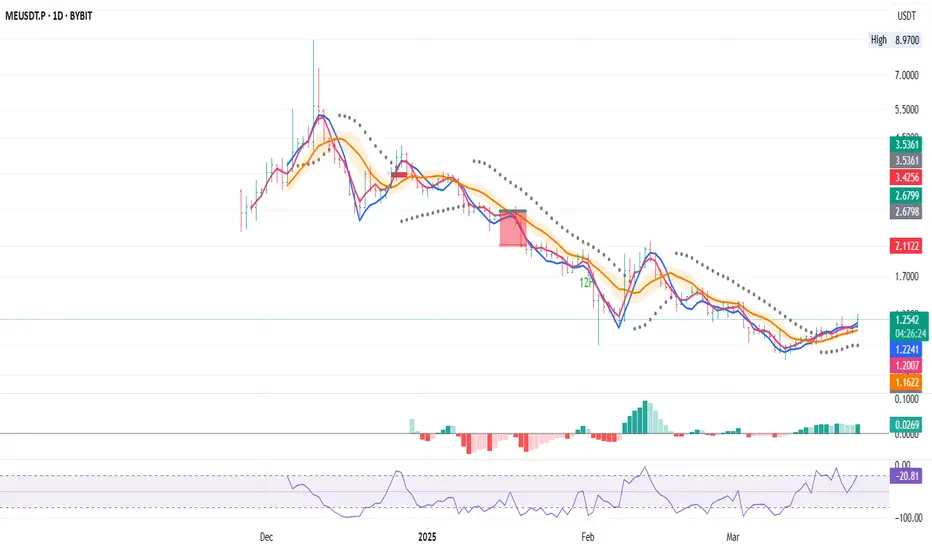
MetaUnit | Long Entry signal for MEU/USDT Analysis:
MLR > SMA: The MLR (blue) is above the SMA (pink), signaling a bullish trend.
MLR > BB Center: MLR exceeds the Bollinger Bands Center Line (orange), showing strong bullish momentum.
PSAR: PSAR dots (black) are below the price, reinforcing the uptrend.
No SMA 200: SMA 200 unavailable - proceed with caution.
Trade Idea:
Entry: Consider a long position at the daily close.
Stop Loss: Place SL at the current PSAR level to limit downside risk.
Follow Me: Follow me for exit or profit-taking opportunities.
Outlook: All indicators align for a bullish move. Stay alert for reversal signals or trend shifts.
Risk Warning: Not financial advice, trade at your own risk
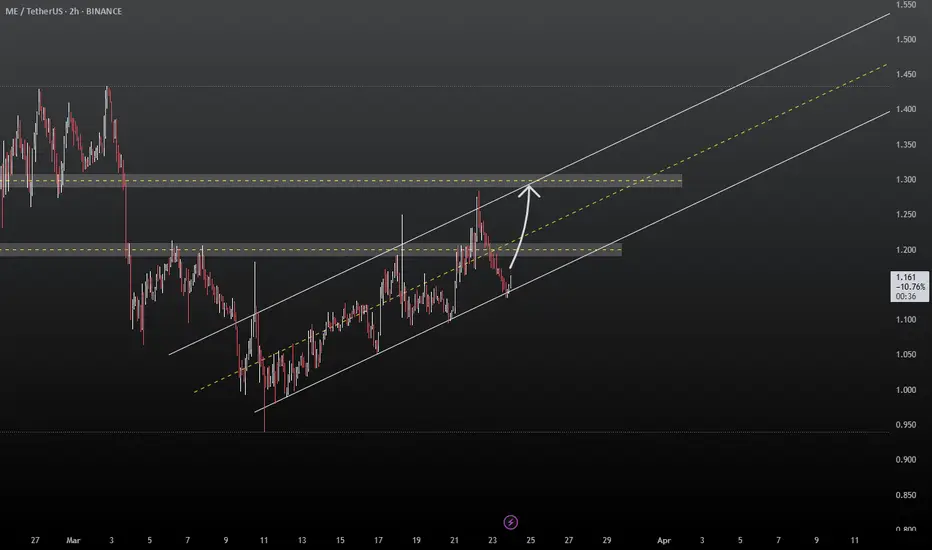
MEUSDT: Ascending Channel - Is $1.300 the Next Stop?Fellow traders!
MEUSDT is exhibiting classic ascending channel behavior. Having tested the lower channel boundary, the price is likely to advance towards the upper channel boundary, with a potential target near $1.300.
Implement prudent risk management.
BINANCE:MEUSDT
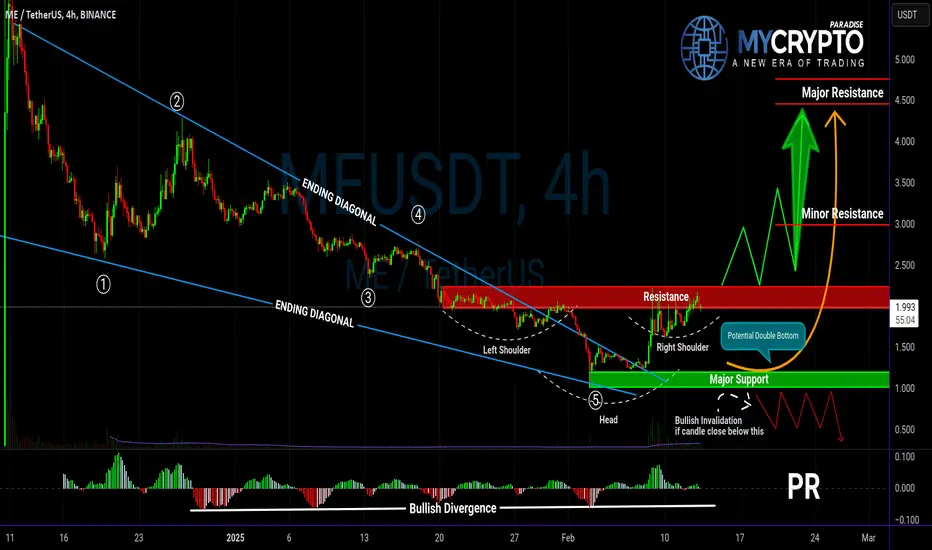
MEUSDT Ready to Explode or Another Bull Trap?Yello, Paradisers! Are we about to witness a strong bullish reversal on MEUSDT, or is another trap being set? Let’s break it down.
💎MEUSDT has formed a well-structured ending diagonal with a clear 5-wave pattern, increasing the probability of an upcoming bullish move. Additionally, the inverse head & shoulders pattern, combined with bullish divergence, further supports a potential reversal. However, for confirmation, we need a decisive breakout and candle close above the key resistance zone to increase our odds.
💎In case of a retracement or panic selling, we are eyeing a bounce from the major support zone, where a potential double-bottom formation could play out. But to strengthen the bullish case, we need to see bullish I-CHoCH (Internal Change of Character) or a W-pattern forming on lower timeframes.
💎On the flip side, if MEUSDT breaks down and closes candle below the major support zone, it will invalidate our bullish outlook. In that scenario, waiting for stronger price action and a more favorable setup would be the best approach.
🎖Patience and strategy are key, Paradisers! Rushing into trades without confirmation is a sure way to get trapped. Play it smart, stay disciplined, and wait for high-probability setups. That’s how you win in this market!
MyCryptoParadise
iFeel the success🌴
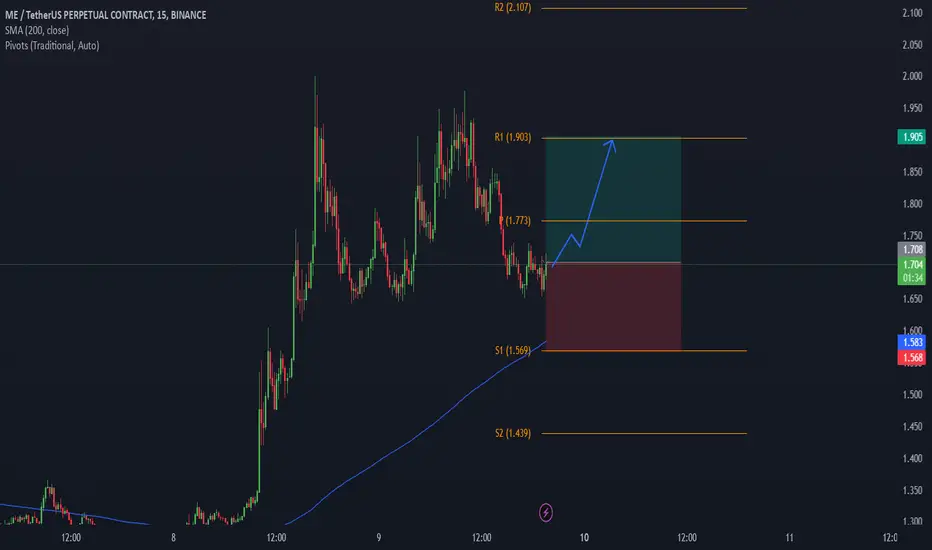
MEUSDT Bullish trade ideaMEUSDT has been in an uptrend with support at 1.6500 being respected a few times. I think that as lomg as price stays above S1 price is still in a bullish price action
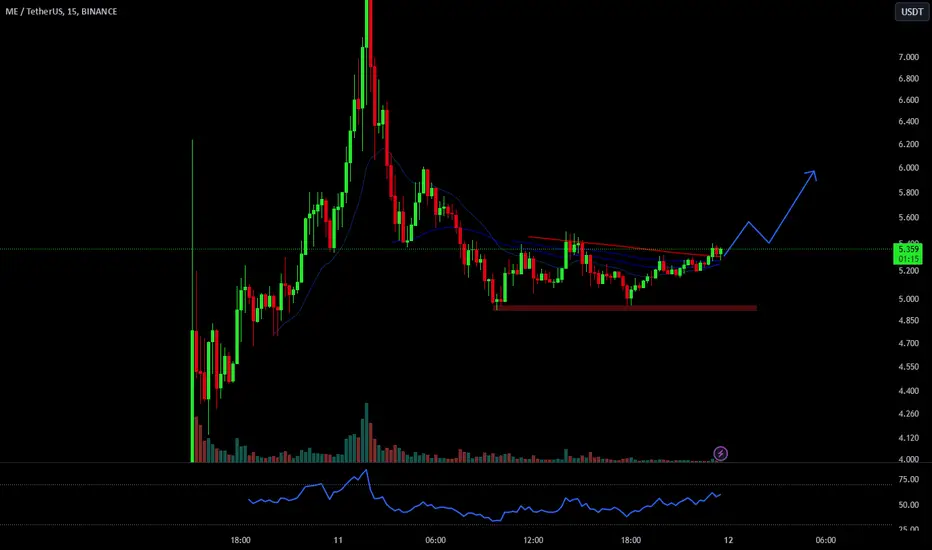
ME (Magic Eden) Bulls time!The ME chart is interesting, initially there was a lot of selling pressure from people who received the airdrop, causing the price to drop from $8 on Binance to $4.90, but it then made a double bottom near $ 5 and is now showing strength and trading above the moving averages on 15 minutes timeframe.
If volumes remain this high, I believe the price will rise in the coming days, I liked the risk reward.