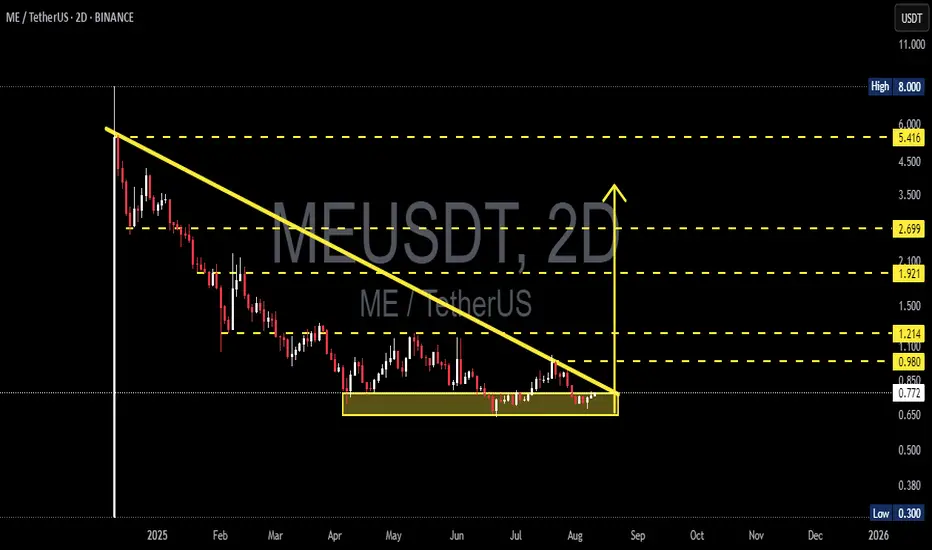
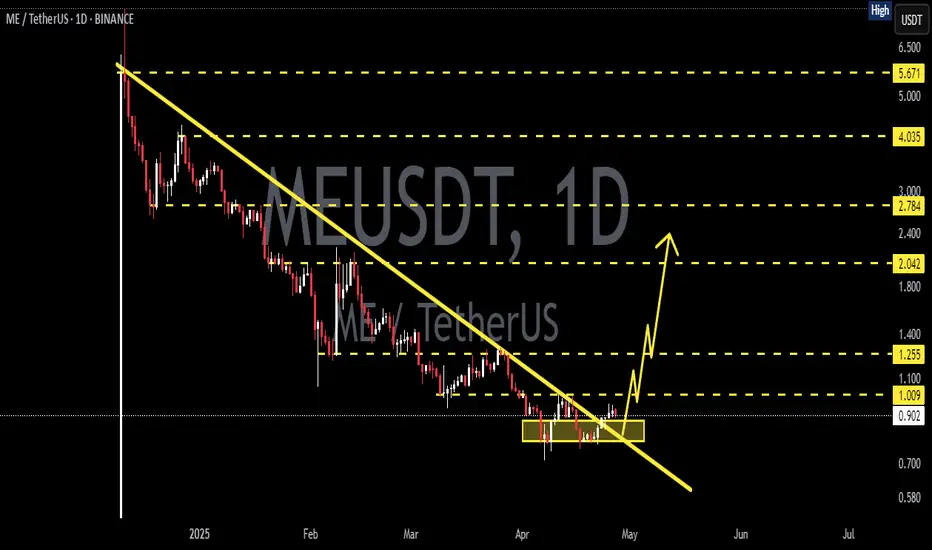
ME/USDT (2D) — Last Stand at the Support Zone!ME/USDT is now at a make-or-break moment. After a prolonged downtrend since the start of the year, price action has formed a Descending Triangle — a combination of a falling trendline pressing down from above and a strong horizontal support between 0.65 – 0.85 USDT.
📌 Why this zone matters:
This yellow zone has repeatedly absorbed heavy selling pressure.
A breakdown below it could open the door to a much deeper fall.
Conversely, a breakout above could be the first sign of a trend reversal.
---
🔍 Pattern Analysis
Descending Trendline Resistance
Every rally attempt since the yearly top has been capped by this dynamic resistance, keeping lower highs intact.
Horizontal Support Zone (Yellow Box)
This area acts as the “last wall” for buyers. While it holds, the bullish case is alive.
Descending Triangle Structure
Statistically, this pattern tends to break down if formed after a strong downtrend — but in crypto, sudden sentiment shifts or fundamentals can flip the script.
---
📈 Bullish Scenario
1. Strong Breakout: A 2D candle close above the descending trendline and 0.98 USDT.
2. Successful Retest: Price retests the breakout zone and holds above it.
3. Upside Targets:
Target 1: 1.214 USDT (+57%)
Target 2: 1.921 USDT (+149%)
Extended Target: 2.699 USDT if momentum surges.
4. Volume Confirmation: Without strong volume, breakouts risk being fakeouts.
---
📉 Bearish Scenario
1. Breakdown: A 2D candle close below 0.65 USDT (bottom of the support zone).
2. Failed Retest: Price attempts to reclaim support but gets rejected.
3. Downside Targets:
Initial Target: 0.50 USDT
Extreme Target: 0.30 USDT (lowest point shown on chart).
4. Acceleration Risk: Strong volume + weak market sentiment can accelerate the drop.
---
📊 Key Levels to Watch
Resistance: 0.98 | 1.214 | 1.921 | 2.699 | 5.416
Support: 0.65 (major) | 0.50 | 0.30 (extreme low)
---
💡 Trader’s Notes
Descending triangle + strong support = high-stakes setup.
Wait for confirmed 2D candle closes and volume spikes before entering.
Always manage risk with clear stop-loss levels & proper position sizing (risk < 2% capital).
Watch for news catalysts or shifts in broader market sentiment.
#ME #MEUSDT #Crypto #TechnicalAnalysis #DescendingTriangle #Support #Resistance #Breakout #Breakdown
Meusdtanalysis
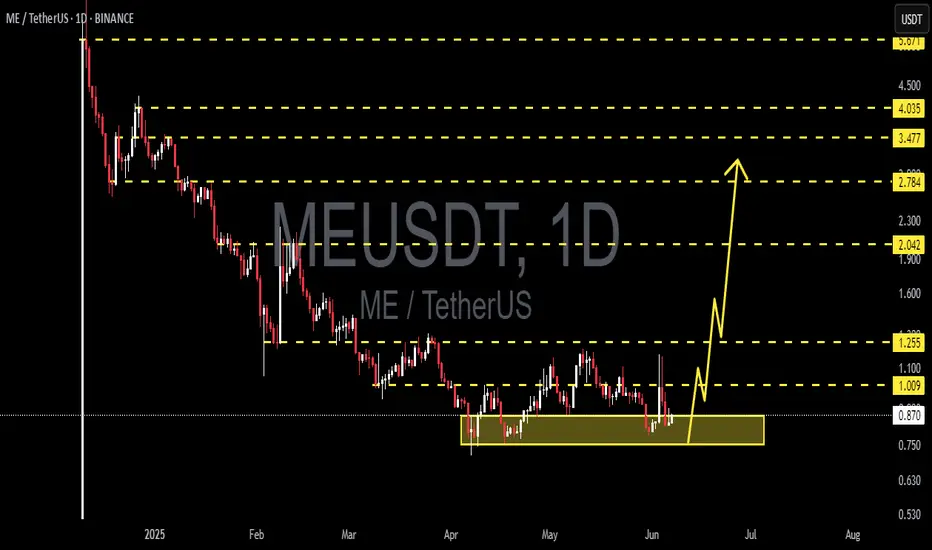
MEUSDT 1D AnalysisME ~ 1D Analysis
#ME This trade is very high risk
Buy gradually from here with a short term target of at least 15%+ from here.
ME Likely to Revisit 1.415 ZoneBased on the MissedPrice concept, rapid price moves often skip levels that price later revisits. The 1.415 level shows an Open Interest leap, suggesting missed positions.
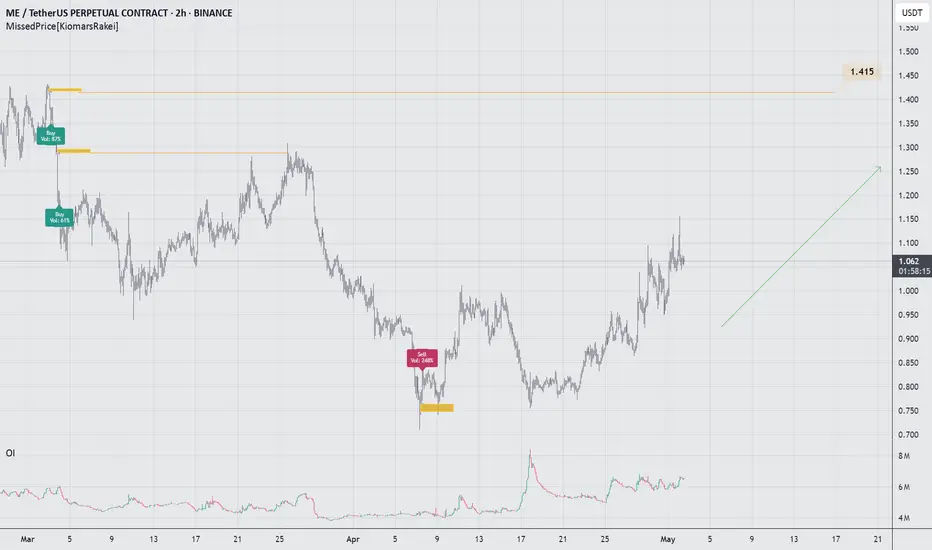
MEUSDT 1D AnalysisME ~ 1D Analysis
#ME This trade is very high risk
Buy from here if you still have a Conviction on this coin with a short -term target of at least 10%+.
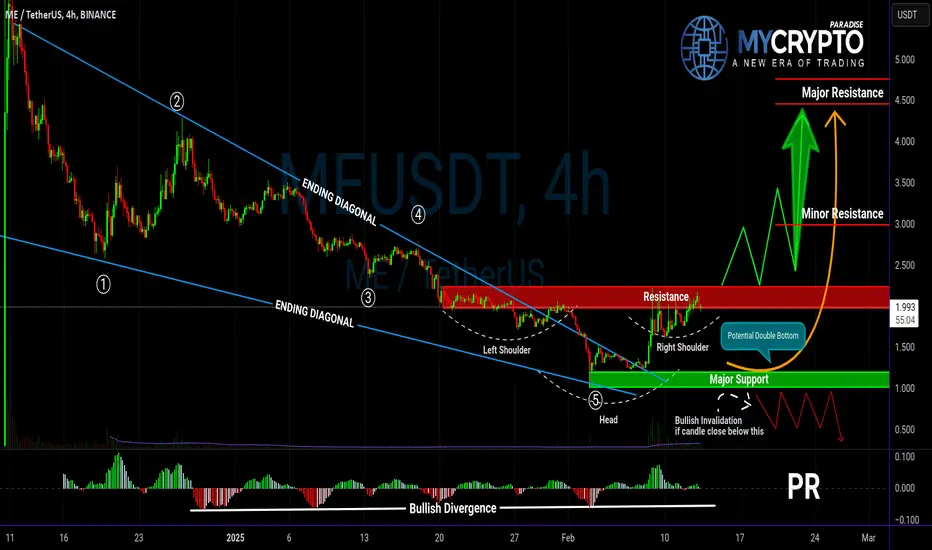
MEUSDT Ready to Explode or Another Bull Trap?Yello, Paradisers! Are we about to witness a strong bullish reversal on MEUSDT, or is another trap being set? Let’s break it down.
💎MEUSDT has formed a well-structured ending diagonal with a clear 5-wave pattern, increasing the probability of an upcoming bullish move. Additionally, the inverse head & shoulders pattern, combined with bullish divergence, further supports a potential reversal. However, for confirmation, we need a decisive breakout and candle close above the key resistance zone to increase our odds.
💎In case of a retracement or panic selling, we are eyeing a bounce from the major support zone, where a potential double-bottom formation could play out. But to strengthen the bullish case, we need to see bullish I-CHoCH (Internal Change of Character) or a W-pattern forming on lower timeframes.
💎On the flip side, if MEUSDT breaks down and closes candle below the major support zone, it will invalidate our bullish outlook. In that scenario, waiting for stronger price action and a more favorable setup would be the best approach.
🎖Patience and strategy are key, Paradisers! Rushing into trades without confirmation is a sure way to get trapped. Play it smart, stay disciplined, and wait for high-probability setups. That’s how you win in this market!
MyCryptoParadise
iFeel the success🌴