MEW/USDT Ready to Explode? Major Breakout from Symmetrical!After weeks of tight consolidation, MEW/USDT is showing signs of a major breakout from a well-formed Symmetrical Triangle pattern on the 2D time frame. This could mark the beginning of a powerful expansion phase if confirmed by volume and price action.
🔍 Pattern Analysis & Technical Structure
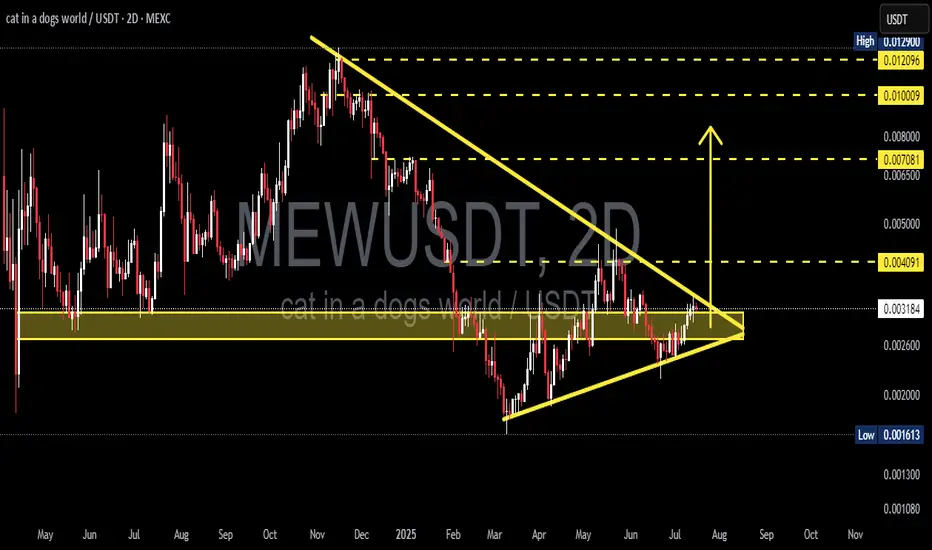
Main pattern: Symmetrical Triangle – a classic formation characterized by lower highs and higher lows, indicating a battle between buyers and sellers before a major move.
MEW has now broken through the triangle’s descending resistance line, signaling that buyers may be taking control.
The breakout occurred near the apex of the triangle, which often leads to explosive moves.
🟢 Bullish Scenario: Multi-Stage Upside Potential
If the breakout holds and gains confirmation (via volume or a successful retest), the next potential price targets are:
1. Initial Target: 0.0049 – nearest horizontal resistance and previous reaction level.
2. Mid Target: 0.0070 – measured move based on the height of the triangle from base to breakout.
3. Major Target Zone: 0.0090 – 0.0130 – previous distribution zone and high-confluence resistance.
📈 Upside potential exceeds +300% from current price if all bullish targets are hit!
🧠 Note: Symmetrical triangle breakouts are known to result in strong momentum-driven rallies, especially if supported by a rise in volume and broader market sentiment.
🔴 Bearish Scenario: Watch for Fakeout Risk
Despite the breakout, there’s always a risk of a false move:
If MEW fails to hold above the 0.0032 breakout zone and falls back inside the triangle, it may signal a bull trap.
A breakdown below the ascending support line could open the door for deeper downside:
Support Level 1: 0.0025 – recent accumulation base.
Support Level 2: 0.0016 – major low and strong demand zone.
Losing these levels would invalidate the current bullish setup.
⚙️ Key Confirmation Signals:
Volume: A breakout with strong volume = high conviction. Low volume = higher fakeout risk.
Successful Retest: A bounce from the breakout zone confirms strength and may provide a solid long entry.
Macro Sentiment: Watch Bitcoin dominance and market mood to confirm sustainability.
📊 Quick Technical Summary:
Pattern: Symmetrical Triangle
Breakout Level: 0.0032
Short-Term Trend: Bullish
Mid-Term Outlook: Neutral → Turning Bullish (if confirmed)
Key Resistance Levels: 0.0049 – 0.0070 – 0.0090 – 0.0129
Key Support Levels: 0.0025 – 0.0016
💬 Final Thoughts:
MEW/USDT is at a make-or-break moment. A validated breakout from this triangle could kick off a massive uptrend. But as always, stay alert to false breakouts — proper risk management is essential.
📌 Don’t just chase the breakout — watch the retest, volume, and broader context.
#MEWUSDT #MEWBreakout #SymmetricalTriangle #CryptoBreakout #AltcoinSetup #TechnicalAnalysis #TradingView #CryptoChart #BullishPattern #BreakoutAlert
MEWUSDC
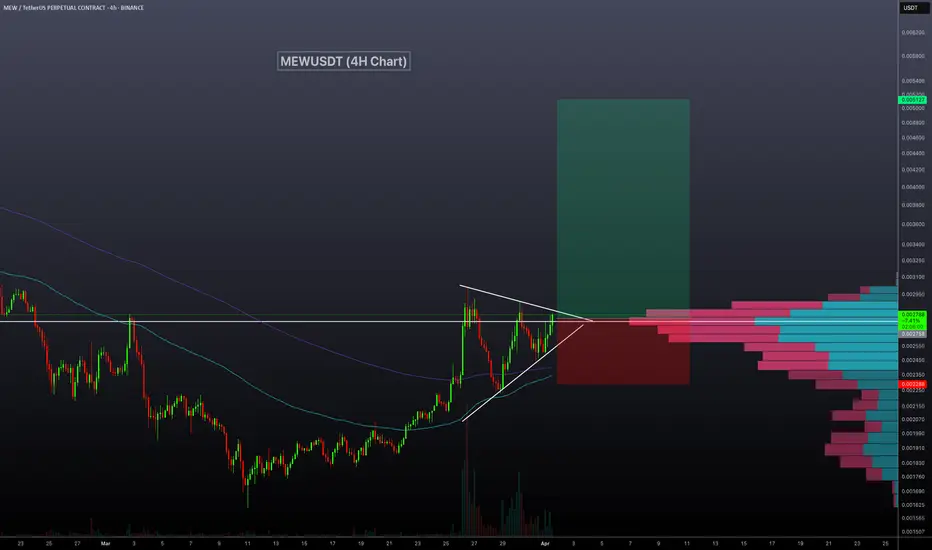
MEWUSDT Approaching a Breakout!MEWUSDT Technical analysis update
-MEWUSDT is trading within a pennant pattern on the daily chart.
-The price is currently above the 100 and 200 EMA.
-A bullish crossover between the 100 and 200 EMA could occur soon.
-There has been a notable increase in trading volume in recent days.
-The price is approaching a key resistance level on the volume profile and may break out soon.