$ACS Analysis ACS Analysis 🚨
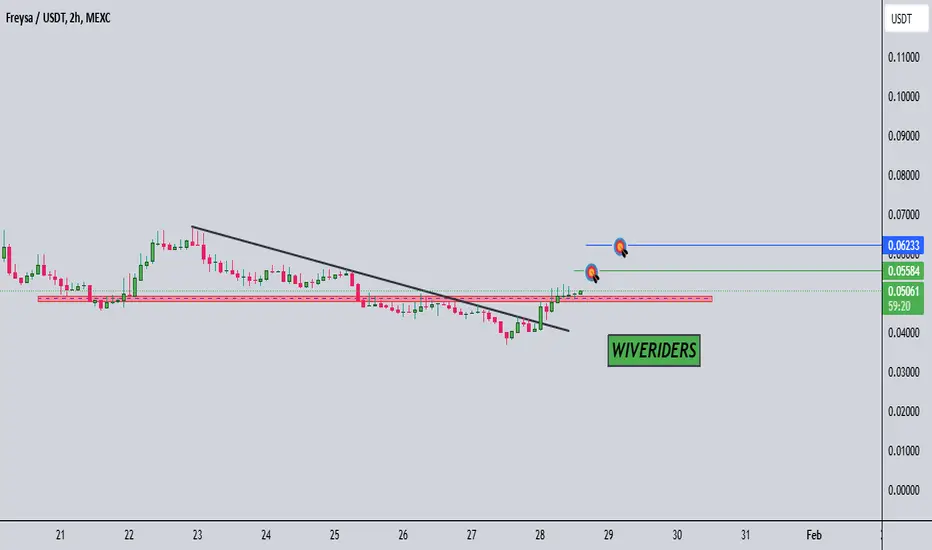
ACS is currently testing the red resistance zone. If a successful breakout occurs:
🎯 First Target: Green line level
Mexc

February 13 Bitcoin Bybit chart analysis
Hello
It's a Bitcoinguide.
If you have a "follower"
You can receive comment notifications on real-time travel routes and major sections.
If my analysis is helpful,
Please would like one booster button at the bottom.
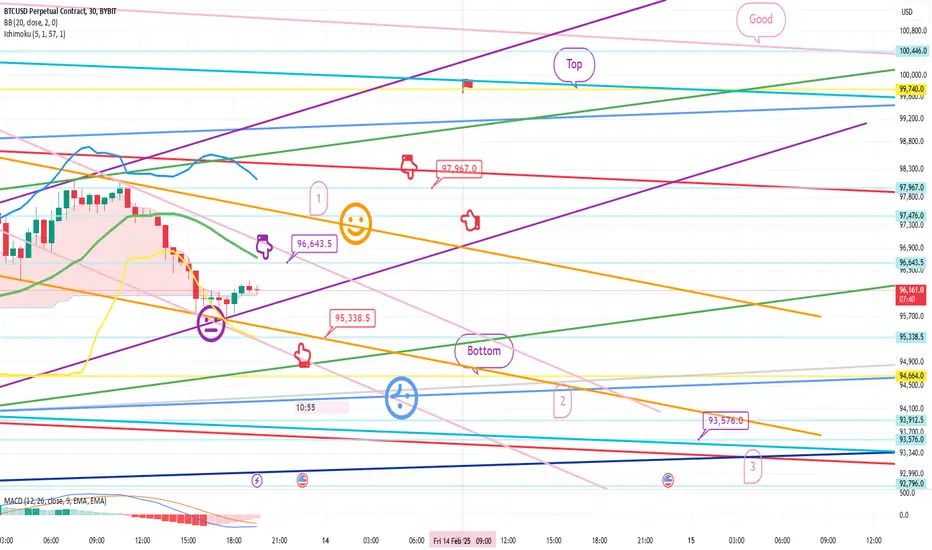
This is the Bitcoin 30-minute chart.
There will be a Nasdaq indicator announcement at 10:30 in a little while.
Nasdaq touched the resistance line of the 4-hour Bollinger Band chart,
but Bitcoin failed to touch the resistance line,
so the adjustment is coming out stronger.
There are Nasdaq variables, and the pattern is broken, so today's analysis was also very difficult.
It's complicated, but I made the strategy as simple as possible.
There are many key contents, so please check the analysis article carefully.
*Red finger movement path
One-way long position strategy
1. 95338.5 dollars long position entry section / stop loss price when blue support line is broken
2. 97967 dollars long position 1st target -> Top 2nd target
(After reaching the top section, long position liquidation, until short position switching)
The purple finger section at the top 96.6K is
The best short position and vertical decline section.
If the orange resistance line is broken, you can operate a self-short based on the stop loss price. (Today is the first 15-minute resistance line touch section)
The probability of the strategy succeeding increases when purple finger short -> purple support line is broken.
The first section at the top is the final short position operation section for today + if it doesn't break through, it's a sideways section.
If it comes down right before the purple finger touches,
the bottom section becomes the long position waiting section.
If you look closely at the sky blue support line, you'll see a gray trend line.
This section is a mid-term upward trend line,
and if it doesn't break out,
the upward trend can continue,
so I set the stop loss price a little loosely.
From the 93.5K deviation shown below,
it touches the Bollinger Band daily chart support line section from the third section,
so a downward trend can be connected, so those who are operating long positions
should be careful.
There may be variables in Nasdaq, so please check the Nasdaq analysis article I left.
I explained it in detail today because the participation rate was high,
but I don't know if you're satisfied.
Up to this point, I ask that you simply use my analysis for reference and use only.
I hope that you operate safely with the principle of trading and cut-off price.
Thank you.
February 12 Bitcoin Bybit chart analysisHello
It's a Bitcoinguide.
If you have a "follower"
You can receive comment notifications on real-time travel routes and major sections.
If my analysis is helpful,
Please would like one booster button at the bottom.
This is Bitcoin's 30-minute chart.
The Nasdaq CPI indicator will be announced at 10:30 in a little while.
*When the red finger moves,
It is a one-way long position strategy.
1. $95,310 long position entry point / When the green support line is broken,
Or when the bottom is touched, stop loss price
2. $97,509.5 long position 1st target -> Top 2nd target
If it reaches the Good section in the early morning hours or tomorrow afternoon,
Short position switching
I marked the small wave in the middle with a pink finger,
So I think it would be good to use it.
At the current position,
If the pink resistance line section at the top, 96,313.5 dollars, short position operating section is touched first,
the area near section 1 at the bottom
can be the long position switching section,
and it can end with a strong rise along the purple parallel line support line.
The key to today's strategy is to move sideways at the current position
and then rebound after touching the lower tail of 95,310 dollars
(Bollinger Band 30 minutes -> maximum 1-hour chart support line section)
The Nasdaq movement is most important.
From the bottom section at the bottom
Because it touches the Bollinger Band 12-hour chart support line
A mid-term downtrend can be connected,
You should be careful from a long position standpoint.
Section 2 is the daily chart support line,
and if this section breaks, it becomes the daily chart double bottom section.
Since you have been shaking it without any reason since last week,
I thought about it and proceeded as safely as possible today.
Please use my analysis article as a reference and for reference only.
I hope you operate it safely with the principle of trading and stop loss.
Thank you.

February 7 Bitcoin Bybit chart analysisHello
It's a Bitcoinguide.
If you have a "follower"
You can receive comment notifications on real-time travel routes and major sections.
If my analysis is helpful,
Please would like one booster button at the bottom.
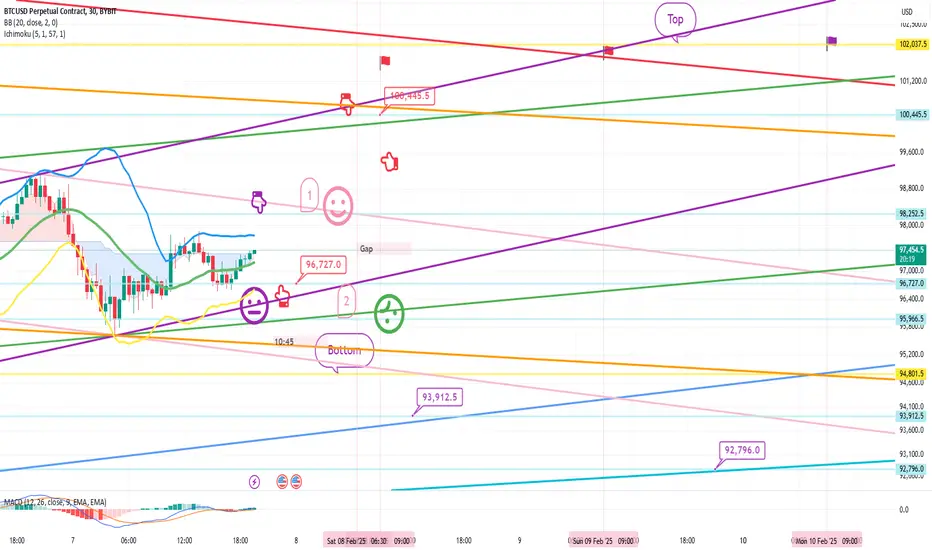
Here is the Bitcoin 30-minute chart.
The Nasdaq indicator will be released at 10:30. (Non-farm index)
Since it is a sideways section and there are so many variables in the Nasdaq,
I proceeded as safely as possible.
Also, the sideways section is difficult and complicated to explain,
but today, the participation rate was good, so I proceeded simply and mildly.
*Red finger movement path
Long position strategy (final short)
1. 96,727 dollars long position entry section / cut-off price when the green support line is broken
2. 100,445.5 dollars long position 1st target -> Top 2nd target until the weekend
After reaching the top section, switch to a short position
Check the live support line and price range
The first section at the top is a sideways market
From the first section breakout, an upward trend can be connected. If you don't touch the first section and come down right away,
the second section becomes the final long position,
and the MACD dead cross imprint on the weekly chart during the weekend is the main key point.
Even if it breaks through the top section and continues to rise,
the dead cross may continue to press down next week,
so it could be a headache.
If you look at the bottom,
from the current position to the sky blue support line of $98,912.5 (safe zone)
and maintain it without breaking away from the bright sky blue of $92,796 at the bottom (danger zone),
it would be good.
You may have been surprised by the sudden decline last week due to Nasdaq and Trump,
but as I explained last time, since the movement is within the expected range,
it seems that the direction will be revealed to some extent after this week.
I ask that you simply refer to and use my analysis so far,
and I hope that you operate safely with principle trading and stop loss prices.
You worked hard this week too.
Thank you.
February 5 Bitcoin Bybit chart analysisHello
It's a Bitcoinguide.
If you have a "follower"
You can receive comment notifications on real-time travel routes and major sections.
If my analysis is helpful,
Please would like one booster button at the bottom.
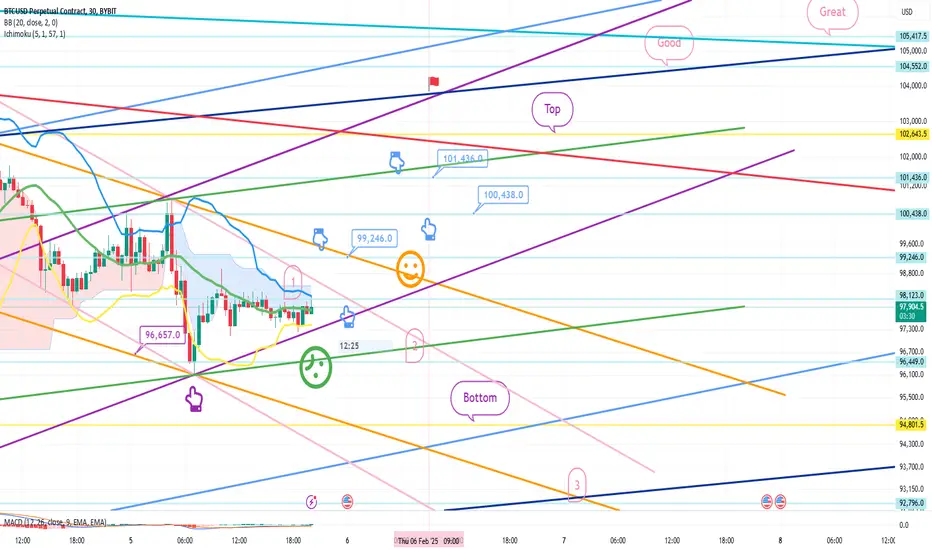
This is the Bitcoin 30-minute chart.
Shortly, at 10:30 and 12 o'clock, there will be a Nasdaq index announcement.
The purple finger on the lower left
is connected to the long position switching section of 96,657 dollars yesterday.
Currently, there is pressure from the MACD dead cross on the 4-hour and 6-hour charts,
and the short-term golden cross and the medium-term have already been imprinted,
so there is a very high possibility of a sideways movement.
To explain it simply,
If anyone sees a decline due to the 4-hour MACD dead cross,
I am using a strategy that holds on as much as possible even if it moves sideways,
and that there may be another rebound.
There is still time left this week.
First of all, it is because Nasdaq is basically ignoring all Bitcoin waves, patterns, and signals,
and because the rebound is continuing due to Trump's tariff suspension.
Instead, I held the stop loss tightly and
I created today's strategy by comparing it to Tether Dominance.
*When the blue finger moves,
Bidirectional neutral
Short->Long switching strategy or final long waiting strategy
1. $99,246 short position entry section / stop loss when orange resistance line is broken
2. $98,099, long position switching in section 1 / when green support line is broken
or when section 2 is touched
3. $101,436 long position 1st target -> Top section 2nd target
The top section is the center line of the Bollinger Band daily chart.
Since it is the first touch in this wave,
If it touches before the additional daily chart is created at 9 am tomorrow,
After liquidating the long, short short
If it reaches it after tomorrow, it can be raised with some force,
so let's solve it together while maintaining the long position. If the strategy is successful today, I have also indicated the additional long position entry section at the daily closing price, so please use it conveniently.
It has currently reached section 1,
but if it falls from the current position, it will fall vertically.
The section 2 at the bottom is the final long waiting section if it fails to touch the 99.2K short entry point at the top and
it goes down.
From section 2 below, the support line is Bottom -> Section 3.
Since the distance is far, I hope you operate well in real time.
Please use my analysis article as a reference and only
Please operate safely with principle trading and stop loss.
Thank you.
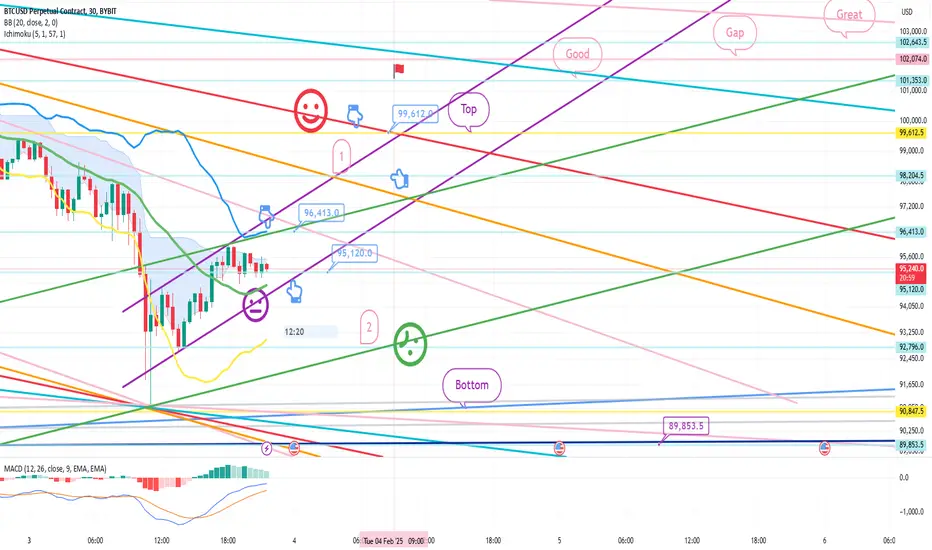
February 3 Bitcoin Bybit chart analysisHello
It's a Bitcoinguide.
If you have a "follower"
You can receive comment notifications on real-time travel routes and major sections.
If my analysis is helpful,
Please would like one booster button at the bottom.
This is the Bitcoin 30-minute chart.
Nasdaq indicators will be announced at 12 o'clock soon.
The Nasdaq variable and the Bitcoin weekly chart MACD dead cross are in progress, so the analysis difficulty is high.
I had a hard time finding the entry point and the stop loss price.
It will be hard, but let's hold on this week.
Also, if it falls from the current position,
Nasdaq will have a vertical decline condition, so you have to be careful.
In the case of Tether Dominance, there is no resistance line yet,
so if it doesn't crash all at once, it can be shaken by a short-term wave.
I created today's strategy focusing on this part.
* When the blue finger moves,
It is a two-way neutral
Short->Long switching or long position waiting strategy.
1. 96,413 dollars short position entry section / when pink resistance line is broken
or when section 1 is touched, stop loss price
2. 95,120 dollars long position switching / when purple support line is broken
or when section 2 is touched, stop loss price
3. 99,612 dollars short position switching / when red resistance line is broken
or when Good section is touched, stop loss price
96.4K short position at the top from the current position
If the entry point is not touched
Long waiting at section 2 below / stop loss price when green support line is broken.
Section 1 at the top is a sideways market
It is the second short position entry section of today.
The final long position target and
short position switching section that I expect
is the center line of the 4-hour Bollinger Band chart.
It is expected to be around the top section,
and if it rebounds to this section,
the weekly chart MACD dead cross will be released,
so you can press it again.
There are two conditions for the dead cross to be imprinted:
it is pushed to 86.5K at the bottom (major support line)
or it is imprinted naturally while moving sideways.
It won't be easy to break through all the resistance lines at once with a vertical rise
and touch the Bollinger band resistance line, right?
Of course, it is possible if the Nasdaq goes crazy while soaring.
This week, it can continue to shake while moving sideways,
and it doesn't look easy to see an upward trend,
so short-term trading seems advantageous.
I marked 89,853.5 dollars below the bottom,
and since it is a section where a newly created mid-term upward trend is maintained,
it seems safe to just hold this spot this week.
Above all, the Nasdaq movement is the most important,
so check it in real time.
Up to this point, I ask that you simply use my analysis for reference and use only.
I hope that you operate safely with the principle of trading and cut-off price.
Thank you for reading.
january 31 Bitcoin Bybit chart analysisHello
It's a Bitcoinguide.
If you have a "follower"
You can receive comment notifications on real-time travel routes and major sections.
If my analysis is helpful,
Please would like one booster button at the bottom.
This is Bitcoin's 30-minute chart.
There will be two Nasdaq indicators released at 10:30 in a little while.
There is a gap section at the top and bottom of Nasdaq,
so it seems likely that it will shake once.
Bitcoin has MACD dead cross pressure on the 4-hour chart.
I created today's strategy by comparing it to Tether Dominance.
*When the blue finger moves,
Bidirectional neutral
Short->Long switching, or long position waiting strategy
1. $104,641.5 short position entry section / Orange resistance line breakout, stop loss price
2. $103,12 long position switching / Green support line breakout, stop loss price
(If it comes down right away, 104.6K is the long position waiting section, same stop loss price)
3. $106,943 long position 1st target -> Target price in order
To ignore the 4-hour chart MACD dead cross,
The condition is that it touches the 1st section or more, the 4-hour chart resistance line of the Bollinger Band.
If not,
It should be imprinted while moving sideways until 9, 1, and 5 o'clock when the 4-hour candle is created,
and I created a strategy based on that.
The first section at the top is a sideways section / the blue support line at the bottom is
an upward trend line from a mid-term perspective.
If the green support line breaks,
you should be careful because it can go down to Bottom -> 2 at once.
I'm not in good condition today,
so I'll finish here and go in.
Please use my analysis so far as a reference and only
I hope you operate safely with principle trading and stop loss prices.
Thank you.

(Lunar New Year Special) january 24 Bitcoin Bybit chart analysisHello
It's a Bitcoinguide.
If you have a "follower"
You can receive comment notifications on real-time travel routes and major sections.
If my analysis is helpful,
Please would like one booster button at the bottom.
Bitcoin 4-hour chart
This is the main drawing section.
It seems to have taken about 2 and a half hours just to draw it.
The section where the flag is marked is the section where the daily chart is created,
and the last flag is January 31st, when the holiday ends.
This week, there has been absurd and bizarre repetition of
unasked rises and unasked falls.
The reason is that after the report was updated,
as I explained in detail in the last video,
it is right before the bitcoin price skyrockets.
Based on the Bollinger Band weekly chart, it is important to see whether the resistance line is touched first
(a major rise)
and whether the MACD dead cross on the weekly chart
will occur first,
and adjustments and sideways movements will occur.
Based on that, if you look at the high and low points on the right,
I have indicated the prices.
At the very top, 117,182 dollars touches the weekly chart resistance line,
moving towards a mid-term upward trend
If 99,703 dollars at the bottom is broken first,
it will be the place where the weekly candle low is broken.
It would be bad if the two light-colored sky-blue support lines I drew were broken.
Because it is the place where the sideways movement and support line are broken,
I calculated the main section, so
I think it would be good to refer to it.
This is a 30-minute chart of Tether Dominance moving in the opposite direction of the beat.
Today, in terms of the pattern,
it touched the 5-minute and 15-minute resistance lines,
and the 30-minute chart resistance line section order.
I carried out a short position strategy in the sky blue finger section/strong downward section.
In the case of Tether Dominance,
the 6-hour chart and 12-hour chart MACD dead cross are currently in progress.
I applied it to Bitcoin as is.
Here is the Bitcoin 30-minute chart.
There is a Nasdaq indicator announcement at 12 o'clock tonight.
The Nasdaq is in the process of a 6-hour MACD dead cross,
and I judged that this section is not very dangerous.
The short-term pattern is still alive,
and the MACD golden cross is imprinted on the weekly chart,
and even if there is a strong adjustment in Nasdaq,
since the 1+4 rising pattern is waiting,
I focused on the rise and proceeded with the strategy.
*One-way long position strategy when the red finger moves
1. $104,740 long position entry section / stop loss price when the green support line is broken
2. $109,231.5 long position 1st target -> target price in order from the top
Based on the Tether dominance movement and the Bitcoin pattern,
I focused on the rebound from the 30+1 pattern.
Up to the first section, it is a sideways movement, and from the top section, it is a new record, and if it reaches this point, it will continue to rise significantly.
In preparation for a strong adjustment in Nasdaq,
I maintained the stop loss price for the 30-minute support + 1-hour support of the second section, which is marked as the final long position waiting section.
If it touches the bottom section today,
It is not good because the daily chart low is broken.
If it falls to 101.4K at the very bottom,
Pay attention to the 6+12 pattern that was not recovered yesterday.
Basically, if it comes down to this section,
It is not good because the center line of the 12-hour Bollinger Band chart has been touched several times,
and the support line of the 6-hour chart is also open.
Please refer to the final support line explained at the mid-term point at the top.
Today, I explained it in detail for the first time in a while,
and I did my best to analyze a week's worth,
I hope it was helpful for your actual trading.
Up to this point, I ask that you simply use my analysis for reference and use only
and I hope that you operate safely with principle trading and stop loss prices.
Since it's a long holiday,
don't just look at the charts,
and I hope all my followers have a good time with their families next week on Lunar New Year.
Happy New Year.
Thank you always.

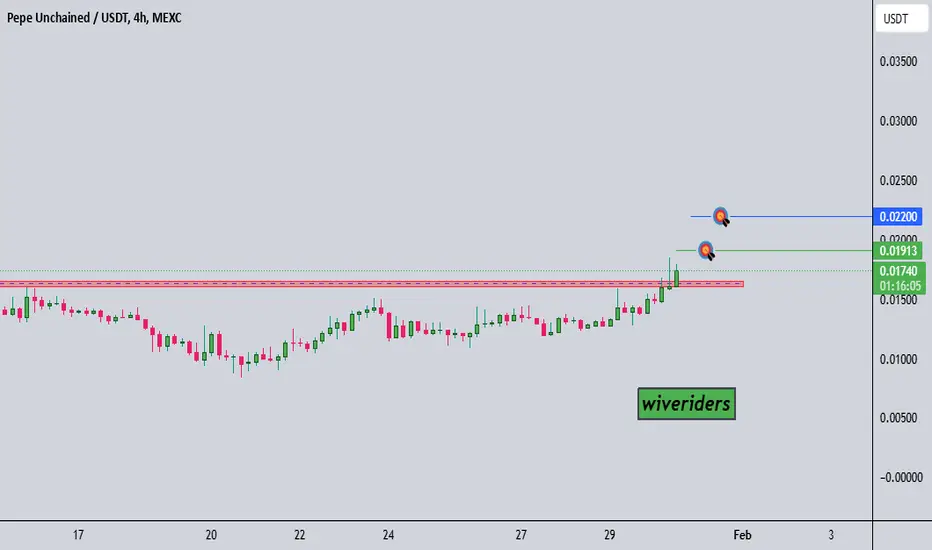
$PEPU/USDT AnalysisGETTEX:PEPU is breaking out of the red resistance zone.
🎯 Targets to Watch:
1️⃣ First Target: Green line level
2️⃣ Second Target: Blue line level
$ACS/USDT AnalysisBME:ACS is testing the red resistance zone again.
🎯 Targets if breakout occurs:
1️⃣ First Target: Green line level
2️⃣ Second Target: Blue line level

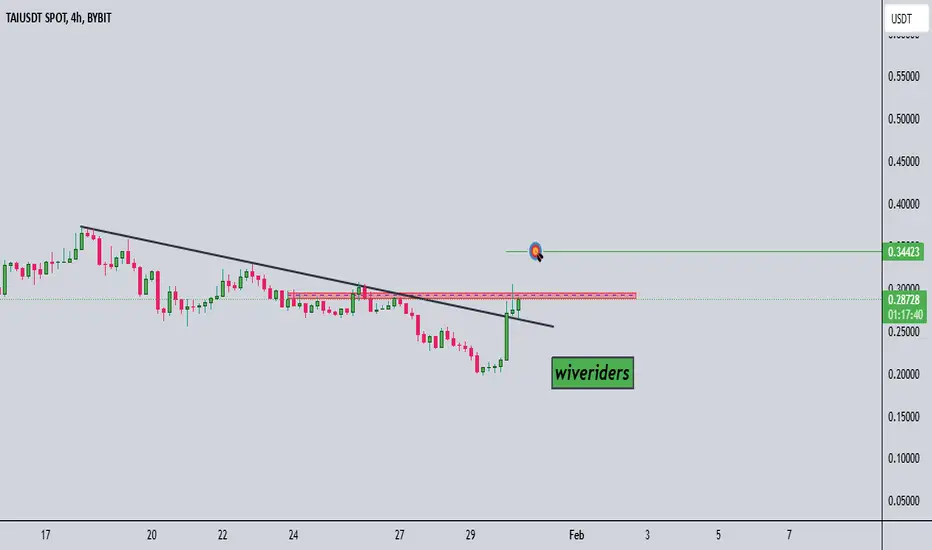
$TAI/USDT AnalysisCSE:TAI is testing the red resistance zone.
🎯 Targets if breakout occurs:
1️⃣ First Target: Green line level
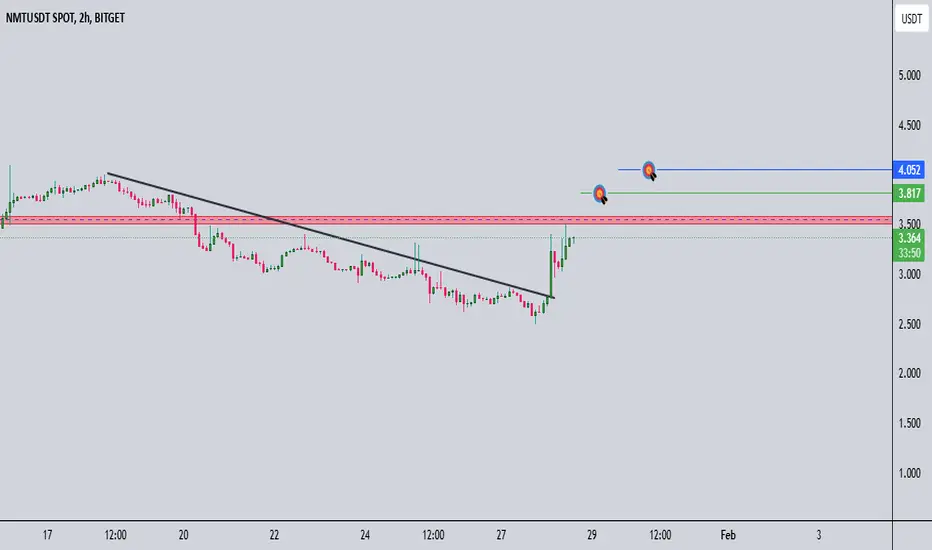
NMT/USDT AnalysisThe price is approaching the critical resistance in red again.
🎯 Targets if breakout occurs:
1️⃣ First Target: Green line level
2️⃣ Second Target: Blue line level
BUZZ/USDT AnalysisThe price is trying to break out of the red resistance zone.
🎯 Targets if breakout occurs:
1️⃣ First Target: Green line level
2️⃣ Second Target: Blue line level

FAI/USDT AnalysisThe price is breaking out of the red resistance zone.
🎯 Targets:
1️⃣ First Target: Green line level
2️⃣ Second Target: Blue line level
GRIFT/USDT AnalysisThe price is bouncing from the green zone.
🎯 Target:
1️⃣ Green line level
⚠️ Be cautious at the red resistance zone

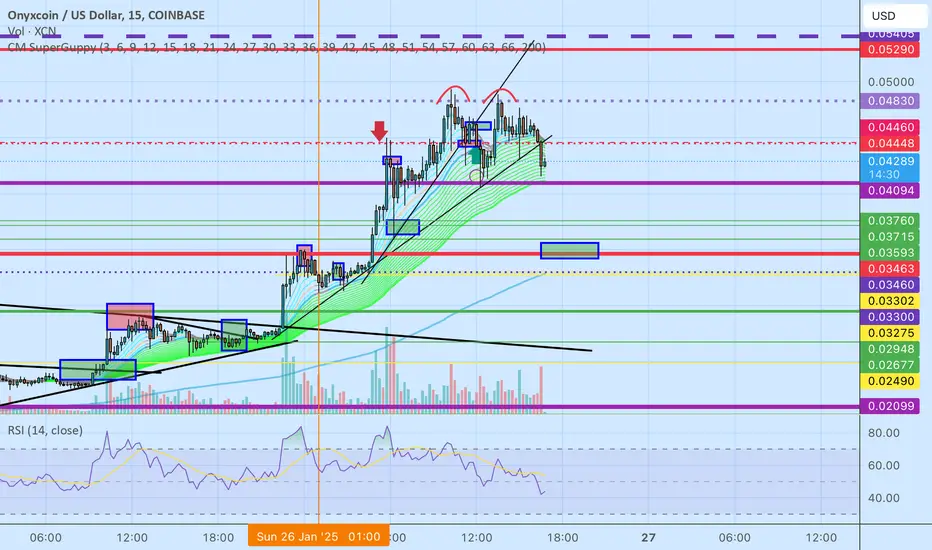
Crystal clearWe can see a clear double top on XCN this could push down to $0.3455 or a bit lower but it’s also supported by the 200ema.
after that we’re off the the races, I hope you enjoyed this 100% daily gain.
TOSHI, is the best decision to buy when Xcn was topping out hands down.
Good luck and have fun with it.
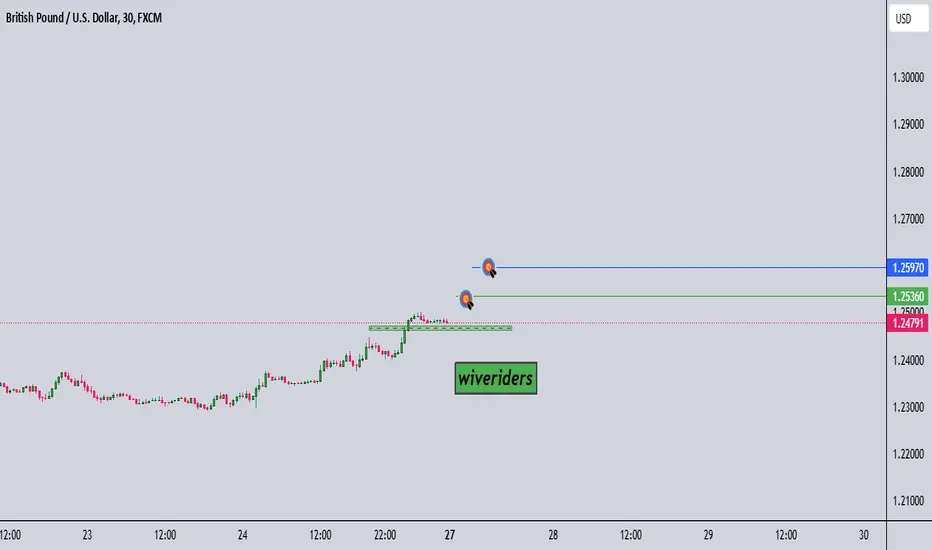
GBP/USD Analysis he price looks like it's making a pullback and could potentially bounce.
🎯 Targets:
1️⃣ First Target: Green line
2️⃣ Second Target: Blue line
HBAR/USDT AnalysisAfter breaking out of the resistance zone and pulling back, the price now looks like it will bounce.
🎯 Targets:
1️⃣ First Target: Green line
2️⃣ Second Target: Blue line

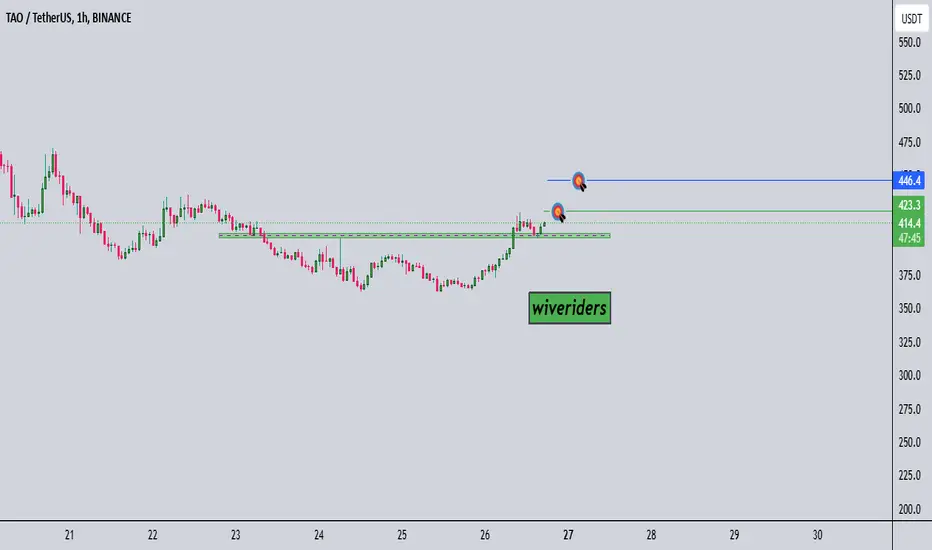
TAO/USDT AnalysisAfter breaking out of the resistance zone, the price is now pulling back and looks like it’s bouncing.
🎯 Targets:
1️⃣ First Target: Green line level
2️⃣ Second Target: Blue line zone
TRUMP/USDT AnalysisThe price is testing the red resistance zone.
🎯 Targets if breakout occurs:
1️⃣ First Target: Green line
2️⃣ Second Target: Blue line level
📊 Alternative Scenario:
If the price gets rejected and breaks the black support trendline, there could be a good entry opportunity at the green zone.

$HYPE/USDT AnalysisThe price has broken out of the black resistance trendline.
🎯 Target:
1️⃣ Green line level

RUNE/USDT AnalysisIf the price breaks out of the red resistance zone:
🎯 Targets:
1️⃣ First Target: Green line level
2️⃣ Second Target: Blue line level

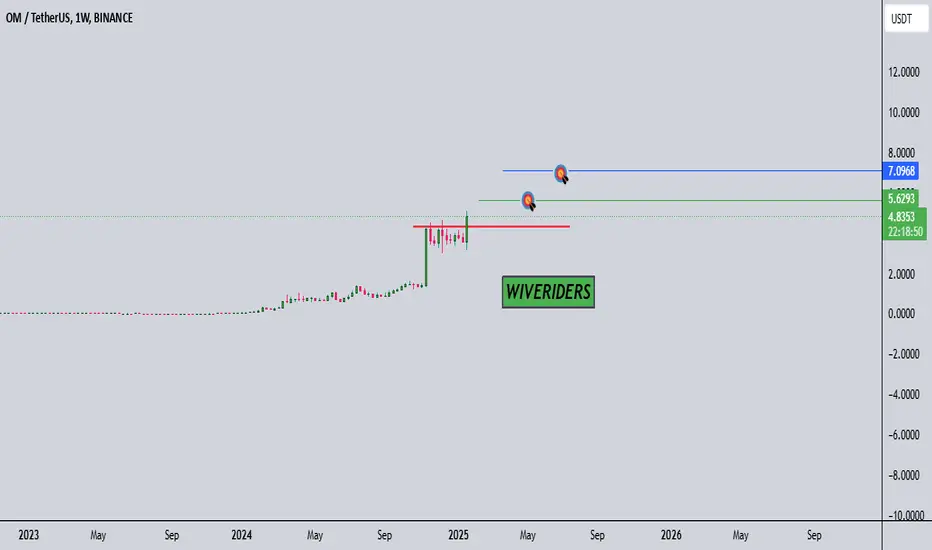
OM/USDT Analysis The price is breaking out of the red resistance zone.
🎯 Targets:
1️⃣ First Target: Green line level
2️⃣ Second Target: Blue line level