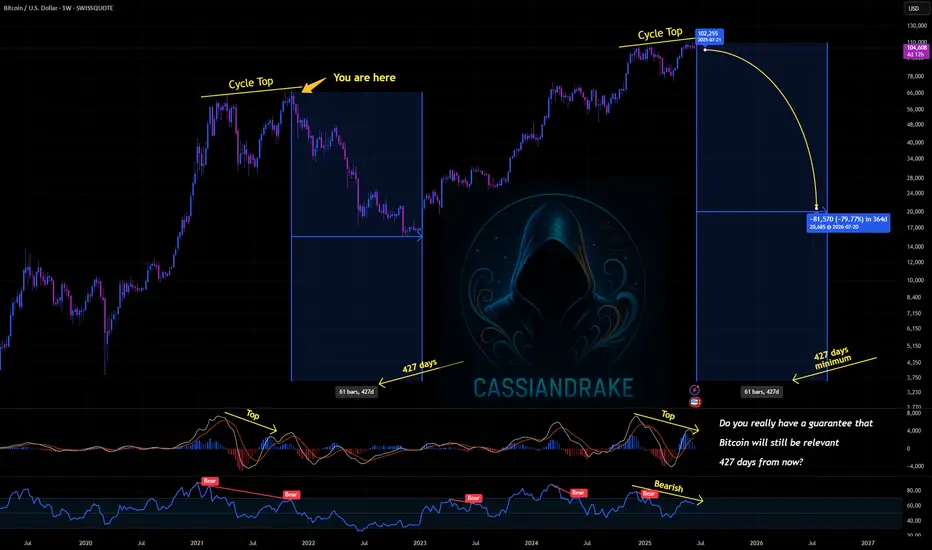
The Bitcoin Manipulation Trick - How They Lure You Into the Trap📉 Bitcoin spends more time in deep drawdowns than at its peaks. Historically, BTC has spent over 80% of its existence trading 80-90% below its all-time highs, yet people keep falling for the illusion of wealth.
🧐 Here’s how the cycle works:
1️⃣ They drive up the price to make it enticing for new buyers.
2️⃣ You FOMO in at the highs, believing in the "next big wave."
3️⃣ Then they crash it, wiping out weak holders.
4️⃣ They keep it suppressed for years, forcing everyone out, via margin calls, financial strain, or sheer exhaustion.
5️⃣ When enough have capitulated, they restart the cycle.
📊 Historical Evidence:
- 2013 Crash: Over 400 days down 80%+ before recovery.
- 2017 Crash: Nearly 3 years below 80% of ATH.
- 2021 Drop: More than a year stuck 75% below peak.
🔎 If you’re buying now, be ready to:
⛔ Lose access to your money
⛔ Keep covering margins
⛔ Wait years for recovery, if it ever happens …
They play the same trick, every time. If you don’t recognize it, you’re just another part of the cycle. 🚀🔥
INDEX:BTCUSD NASDAQ:MARA NASDAQ:COIN NASDAQ:TSLA TVC:GOLD TVC:SILVER NASDAQ:MSTR TVC:DXY NASDAQ:HOOD NYSE:CRCL
Michael
Bitcoin’s Decentralization Is a Fairy TaleBitcoin was born as a revolutionary, decentralized currency, promising financial freedom and independence from traditional banking systems. Yet, as we analyze its real-world distribution, it becomes clear that Bitcoin’s decentralization is more myth than reality.
🔍 The Illusion of Decentralization
Bitcoin operates on a decentralized blockchain, meaning no single entity controls the network. However, when we examine who actually owns Bitcoin, we see a highly concentrated wealth structure that mirrors traditional financial inequality.
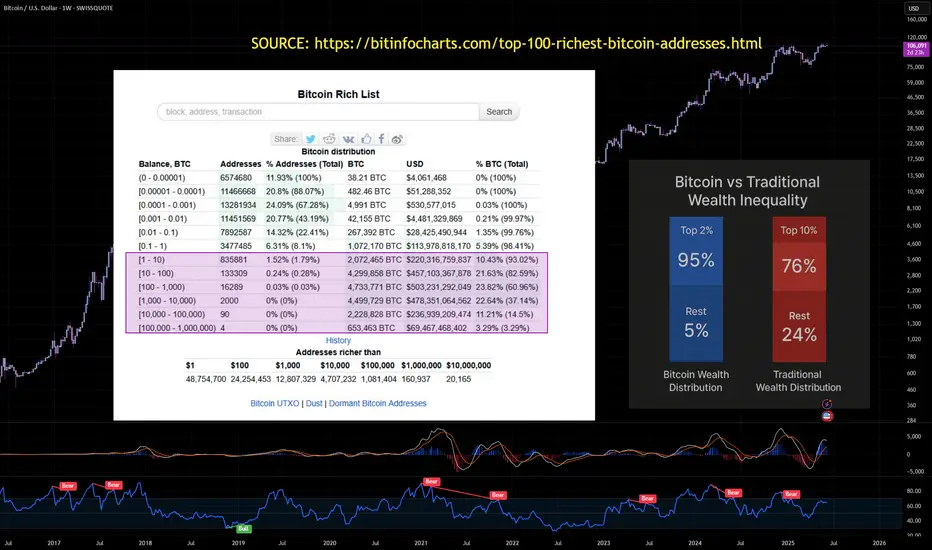
📊 Bitcoin’s Wealth Concentration
The top 0.01% of Bitcoin wallets control over 37% of total supply.
The top 1% of Bitcoin holders control over 40% of Bitcoin.
The top 2% of Bitcoin wallets control over 95% of total supply.
The bottom 98% of wallets hold less than 5% of Bitcoin.
The bottom 50% of wallets hold less than 0.03% of Bitcoin.
10,000 Bitcoin investors own 5 million BTC, worth $230 billion.
Institutional investors and early adopters dominate Bitcoin ownership.
This means that a tiny fraction of wallets dominate the entire market, while millions of small holders own completely insignificant amounts.
💰 Bitcoin vs Traditional Wealth Inequality
Bitcoin was supposed to be more equitable than traditional finance, but its wealth distribution is even more extreme than global financial inequality.
Bitcoin’s wealth gap is far worse than traditional financial inequality, proving that decentralization does not mean fair distribution.
📉 How Did Bitcoin Become So Centralized?
1. Early Adopters Accumulated Massive Holdings
Bitcoin’s first miners and tech-savvy investors acquired BTC when it was nearly worthless.
Many of these wallets still hold huge amounts, making redistribution difficult.
2. Institutional Investors Took Over
Hedge funds, exchanges, and corporations now control a massive portion of BTC.
Bitcoin ETFs and custodial wallets concentrate ownership even further.
3. Lost & Dormant Bitcoin Shrinks Circulating Supply
An estimated 29% of Bitcoin is lost or inactive, meaning fewer coins are available.
This makes the remaining BTC even more concentrated among active holders.
🚨 The Harsh Reality: Bitcoin Is Not Financial Freedom
Bitcoin was supposed to empower individuals, but in practice, it has become a playground for the wealthy.
Decentralization in theory ≠ decentralization in reality.
Institutional investors and exchanges hold a massive portion of BTC.
Bitcoin’s fixed supply (21 million BTC) makes redistribution nearly impossible.
Bitcoin is not the democratized financial system it was promised to be—it’s just another asset class where the rich get richer.
NASDAQ:MSTR NYSE:CRCL NASDAQ:COIN TVC:GOLD TVC:SILVER INDEX:BTCUSD NASDAQ:TSLA TVC:DXY NASDAQ:HOOD NASDAQ:MARA
It's going up forever Laura! Yeah, It's going up forever.
Everyone will copy MSTR and include BTC in their reserves.
Valuing companies will be much much simpler on Bitcoin standard.
This will contribute to the efficiency of society immensly.
Good luck!

The Michael Burry GEO tradeJust analyzing this purely technically because I like MB and as of now supposedly this is his only long holding. Now, keep in mind this is not a stock for everyone - "The GEO Group, Inc. is a publicly traded C corporation that invests in private prisons and mental health facilities in North America, Australia, South Africa, and the United Kingdom."
So yeah, a lot of people including myself will have problems giving money to this, but when we analyze it purely technically, I can see why MB is very bullish on this for the long term.
First of all, we've broken an enormous MONTHLY downtrend (right side chart is a monthly chart) and we're basing with bullish divergence on the daily chart (left side) - that's usually a good thing to be looking for when trying to ID possible bottoms. Buyers may not all be there, but sellers are starting to dry up. Could it go lower? Absolutely. Then there's the Monthly RSI on the right side chart - enormous bullish divergence within this basing. On the left chart we can see it is retesting a previous resistance area (7.25-7.50) which should now be strong support.
So, I can see why this is very interesting to Mr. Burry. I don't recommend anything, but I thought it was a good example of what these gurus see before things blow up.

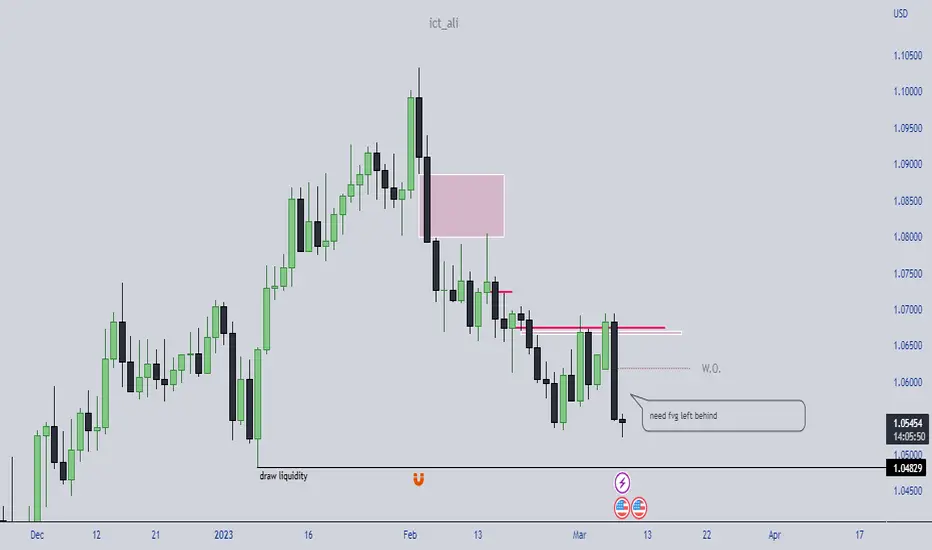
draw liquidity on eurusd wanna see run liquidity on Thursday or Friday
draw liquidity on eurusd ,note draw liquidity on daily timeframe
$PLTR: Have we finally found our inflection point? (Do or Die)ARKK making a strong name for itself after the Jackson Hole meeting. Are we nearing the breakout point or will we continue to see more waiting and what will ultimately happen with the ARKK index at this juncture? We will see! Good luck traders :)

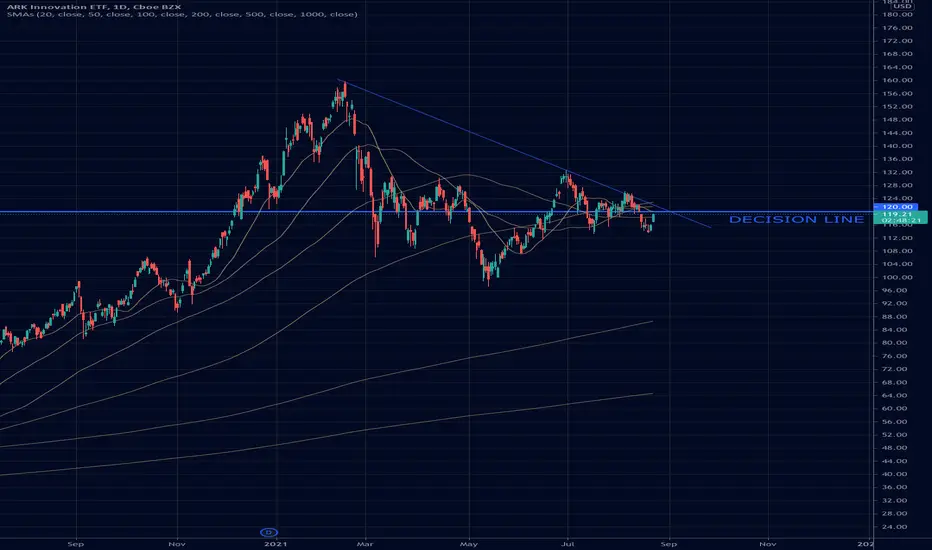
$ARKK: Cathie vs Burry, Which Side Will You Choose?The 120 level on ARKK continues to act as a very prominent level. What would you do?
ARKK 120 features a prominent low volume node and now we have a chance to meet this level with the falling trendline that starts from the Feb high to the June 2021 lower high. Together these forces will meet and ultimately decision in the coming weeks. I'll let time tell me which way I'll play this one but will the Russell 2000 be a canary in the coal mine or will it successfully squeeze bears like it's been known to do. You may also look to the Fed and forex markets to see how the dollars role may play apart. Good luck traders!

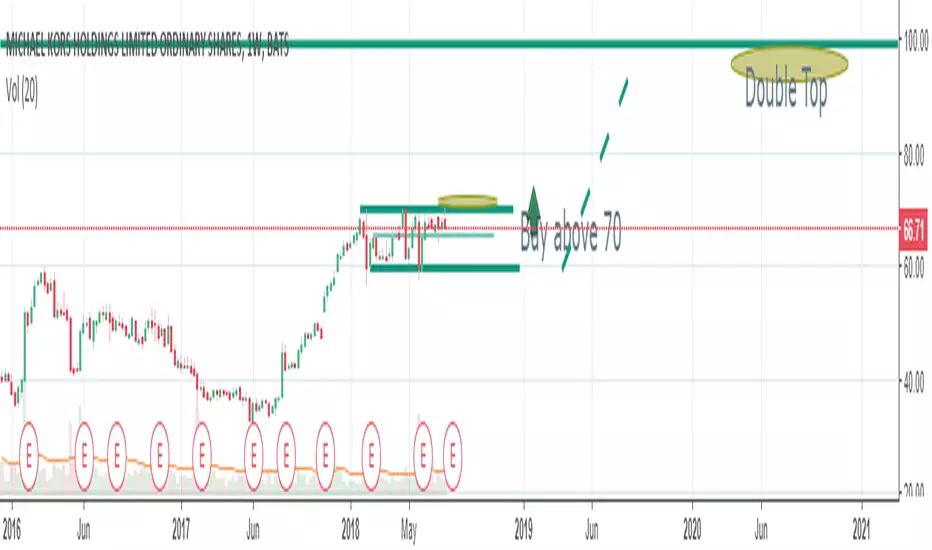
MICHAEL KORS - CORRECTION BEFORE ONE MORE WAVE UPMichael Kors charts seems in the middle of a 3 wave correction on the daily timeframe. I'm expecting the completion of this potential expanding flat before one more wave up. Bearish divergence and gap to fill.

Michael KorsMaking a Bull Flag consolidation
Had a previous uprun.
Look for declining volume within this pattern.
You could buy at the bottom of the consolidation but watch breaks below 60
Clear buy above 70.
Sell at double top at 99.
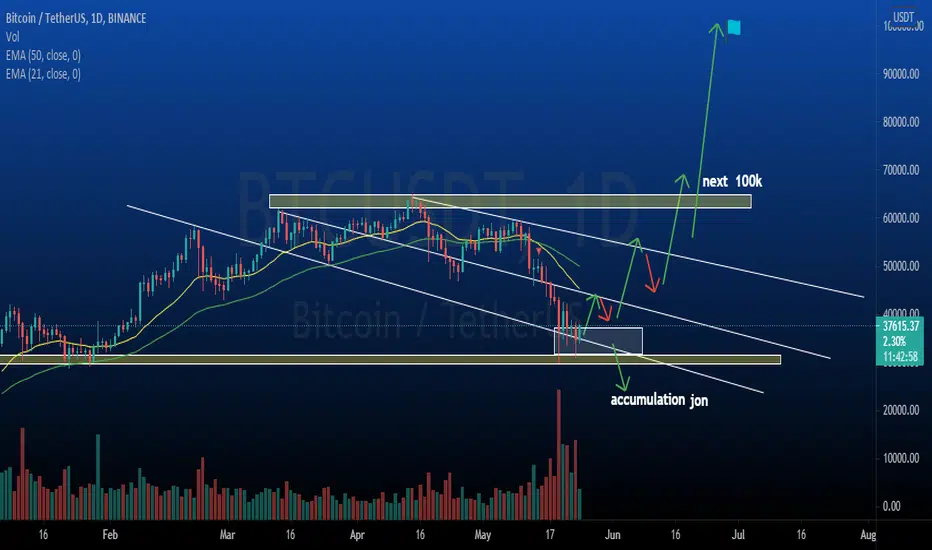
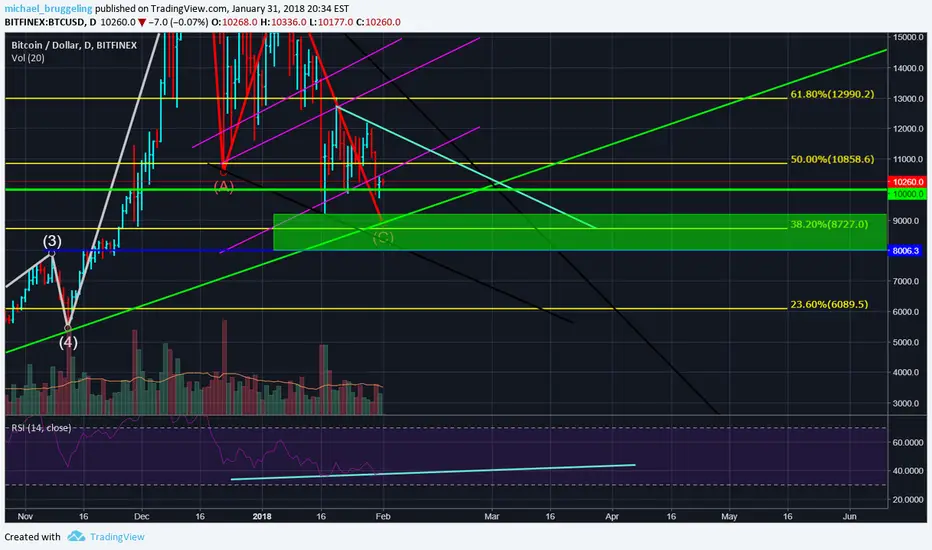
ButtcoinFor now bearish divergence.
Correction wave still active.
Much support, such waves. wow
Very messy and extra, so sorry.
8-9k such confluence of trendlines, previous tops, fib levels and lower end of channels.
Green = buy.
Let the good news come in from mid-february.
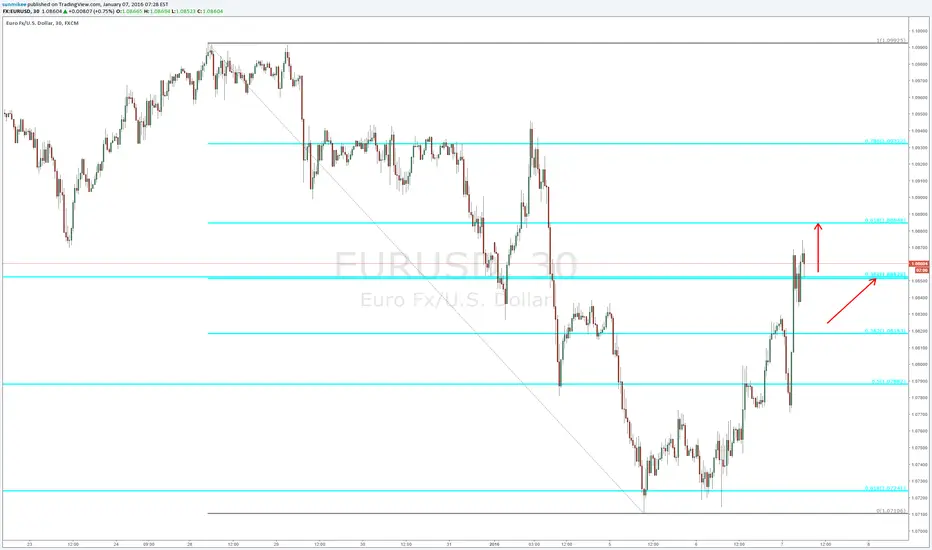
EURUSD - 30 min chart (updated) - temporary bullish (video).382 level has broken. Next one is 50% (by arrow)
Video Analysis in details is here:
www.youtube.com