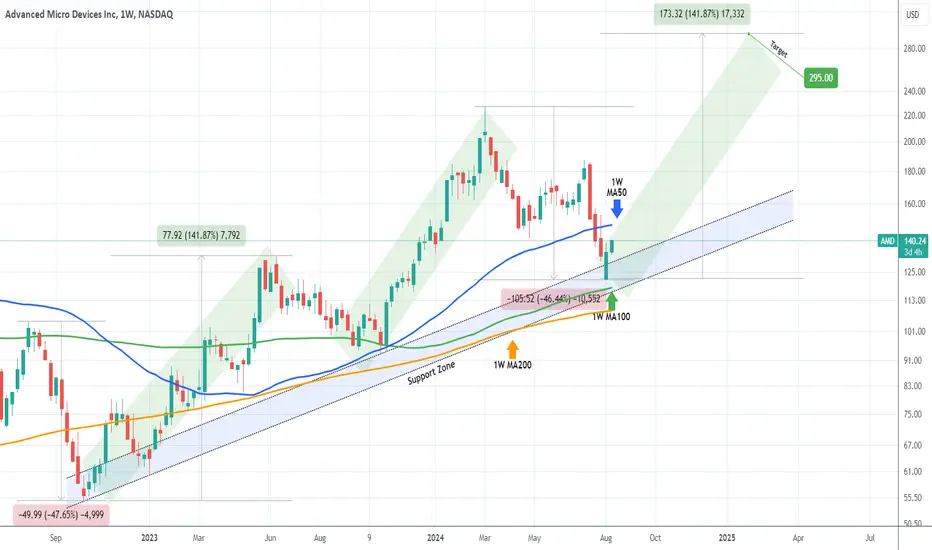
AMD Can it survive this horrific week?On August 13 (see chart below) we called the start of the new long-term Bullish Leg on Advanced Micro Devices (AMD), as a week before it entered the 2-year Higher Lows Zone and rebounded:
Still, the road (green Channel Up) isn't without its hurdles, and one of them is this week where the price is again being brutally sold towards the Higher Lows Zone. Notice that during the previous 2-week correction (August 26 - September 03 1W candles), the Zone's top was tested and held.
As a result, the multi-year trend remains bullish and will be this way for as long as the Higher Lows Zone holds.
It is interesting to observe at this point that the Bearish Phase of this pattern (March 04 - August 05) was in the shape of a Bearish Megaphone and can be compared to the one that bottomed on October 10 2022 and practically started the new Bull Cycle.
Notice also that so far each Bullish Leg (green Channel Up) rose by +141.87%. Within this comparison, and if we plot the Fibonacci levels from the Leg's bottom to top, we can see that the first Bullish Leg also had a rejection on the 0.618 Fib level and pull-back below the 0.786 into the Higher Lows Zone.
Obviously the current correction isn't ideal but it is not something we haven't seen and is within the tolerance levels of this 2-year pattern.
We expect another +141.87% rally to be concluded on this Bullish Leg, so our Target is straight up $295.00.
-------------------------------------------------------------------------------
** Please LIKE 👍, FOLLOW ✅, SHARE 🙌 and COMMENT ✍ if you enjoy this idea! Also share your ideas and charts in the comments section below! This is best way to keep it relevant, support us, keep the content here free and allow the idea to reach as many people as possible. **
-------------------------------------------------------------------------------
💸💸💸💸💸💸
👇 👇 👇 👇 👇 👇
Microprocessors

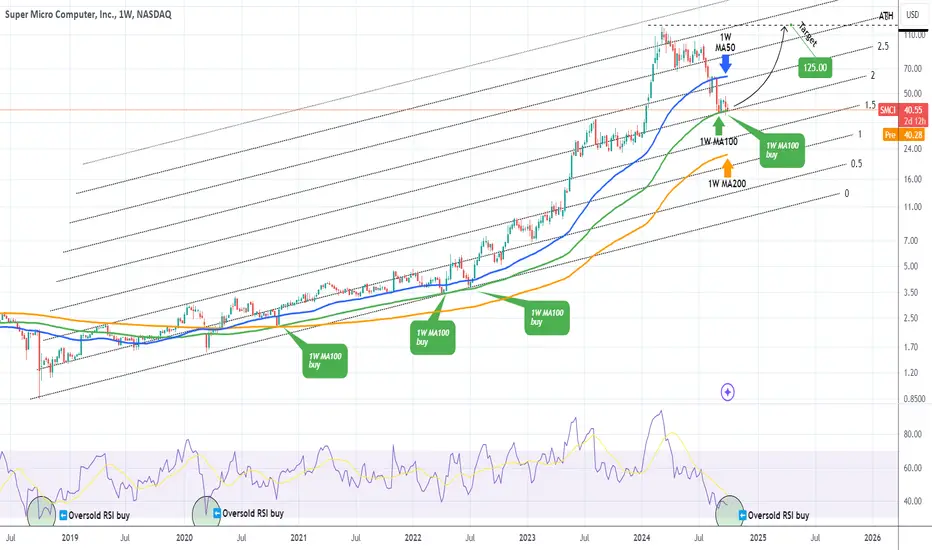
SMCI Is it a by after the stock split??Super Micro Computer Inc (SMCI) just had their 10-for-1 stock split and what's on everyone's mind now is this: Is it a buy? Well after a fresh 8-month Low last Thursday, the market certainly doesn't look at its best, quite the contrary, it is on the worst position it could be after the July 15 High and the start of a Channel Down with series of Lower Highs and Lower Lows.
There is a certain level though, where all of SMCI corrections came to an end since the March 23 2020 bullish break-out during the COVID flash crash, and that is the 1W MA100 (green trend-line).
As you can see, before the stock turned completely parabolic in May 2023, it was trading within a Channel Up since the October 01 2018 market bottom. With the use of the Fibonacci Channel levels, we can accurately put into context the subsequent parabolic move too, which extended all the way to almost the 4.0 Fibonacci extension on the week of March 04 2024 and the All Time High (ATH), before starting its correction.
In the meantime, notice the excellent Buy Signal that the 1W RSI is giving in the last 6 years, every time it approaches the 30.00 oversold barrier.
So as long as the 1W MA100 keeps closing the stocks weekly candles above it, we will be bullish, targeting $125.00 (the ATH). If that fails to support though, expect further downside to the 1W MA200 (orange trend-line), where we will place a second long-term buy.
-------------------------------------------------------------------------------
** Please LIKE 👍, FOLLOW ✅, SHARE 🙌 and COMMENT ✍ if you enjoy this idea! Also share your ideas and charts in the comments section below! This is best way to keep it relevant, support us, keep the content here free and allow the idea to reach as many people as possible. **
-------------------------------------------------------------------------------
💸💸💸💸💸💸
👇 👇 👇 👇 👇 👇
AMD Road to $295 has begun.The Advanced Micro Devices (AMD) is on the 2nd straight weekly bounce following the August 05 bottom. This is so far the strongest 2-week bullish reversal since November 06 2023, which was the previous bottom/ Higher Low on the 2-year Support Zone.
It is no coincidence that this rebound took place just before hitting the 1W MA100 (green trend-line). So far we have had two Bullish Legs arising from this Support Zone structure and currently we are expecting the 3rd.
Since the decline following the March 2024 High has been around -47%, similar to the September 2023 one, we expect the Bullish Leg to be equally strong. As a result, our new long-term Target is $295.00.
-------------------------------------------------------------------------------
** Please LIKE 👍, FOLLOW ✅, SHARE 🙌 and COMMENT ✍ if you enjoy this idea! Also share your ideas and charts in the comments section below! This is best way to keep it relevant, support us, keep the content here free and allow the idea to reach as many people as possible. **
-------------------------------------------------------------------------------
💸💸💸💸💸💸
👇 👇 👇 👇 👇 👇