Microsoft Soars to Record High Following Strong Earnings ReportMicrosoft Stock (MSFT) Soars to Record High Following Strong Earnings Report
As the chart illustrates, Microsoft (MSFT) shares surged sharply after the close of the regular trading session – an immediate market reaction to the company’s strong quarterly results.
According to available data, MSFT's post-market price jumped to $555 per share, exceeding its previous all-time high by more than 8%.
Why Did MSFT Share Price Rise?
The quarterly report provided several reasons for optimism, including:
→ Earnings per share (EPS) came in at $3.65, beating analysts’ expectations of $3.37 by over 8%. Revenue also exceeded forecasts, totalling $76.4 billion versus the projected $73.9 billion.
→ Microsoft’s cloud revenue rose by 27% to $46.7 billion, while Azure’s annualised revenue exceeded $75 billion, driven by growing demand for AI-related services.
In response to these results, Barclays analysts quickly raised their price target for Microsoft shares from $550 to $625.
Technical Analysis of MSFT Chart
It is worth noting that the previous quarterly report was also strong, resulting in the formation of a large bullish gap on 1 May, followed by a sustained upward trend (highlighted by the purple trendline S). Importantly, the gap in the $395–425 range remains unfilled.
Yesterday’s report is also likely to result in a large bullish gap at the market open today, though this time, the market context could lead to a different scenario.
The key factor here is the long-term ascending channel (shown in blue), which reflects MSFT’s price movements throughout 2024–2025. After the previous strong report, the share price moved from the median to the upper boundary of the channel without setting a new record high. However, following the most recent report, the price has surged deep into overbought territory, potentially setting a multi-month high on the RSI and achieving a significant breakout to a new record.
As a result, once the initial excitement around the earnings subsides – and the desire of investors to close long positions intensifies – MSFT could undergo a correction from the upper boundary of the channel. In this scenario, the following support levels could come into play:
→ The psychological level of $550 in the short term;
→ The S trendline, as a possible support during a deeper correction.
This article represents the opinion of the Companies operating under the FXOpen brand only. It is not to be construed as an offer, solicitation, or recommendation with respect to products and services provided by the Companies operating under the FXOpen brand, nor is it to be considered financial advice.
Microsoft
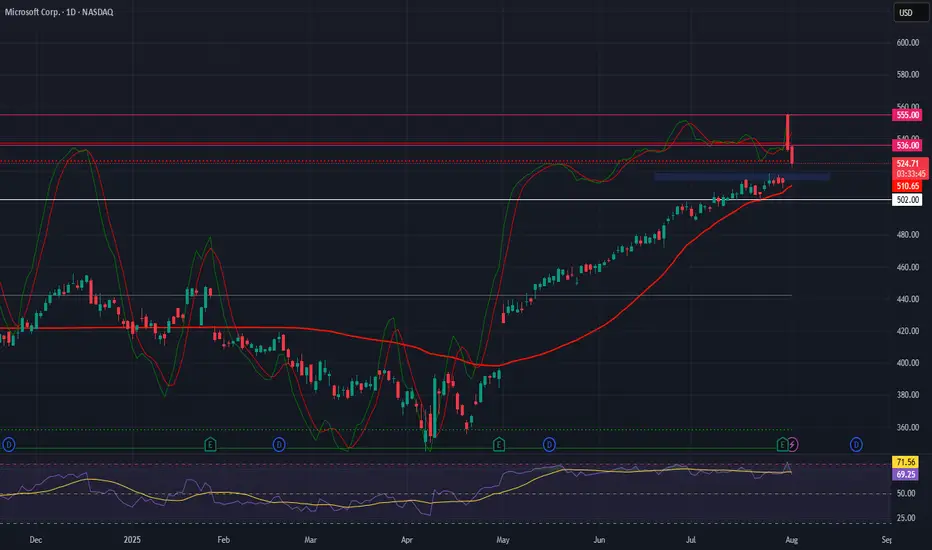
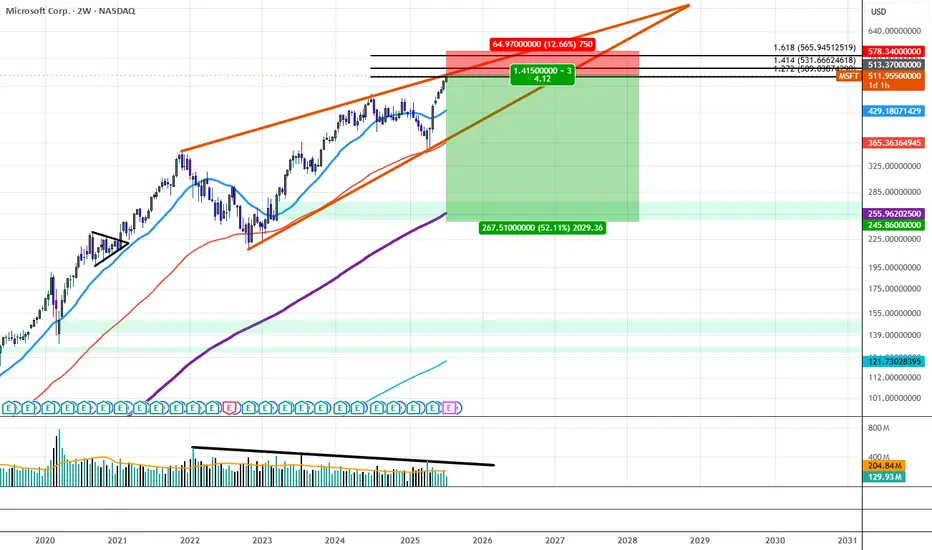
Microsoft (MSFT)–Watching for Pullback Entry After $4T MilestoneMicrosoft Corp. NASDAQ:MSFT has become the second company after Nvidia to cross the $4 trillion market cap, powered by strong AI and cloud demand.
Azure revenue grew 34% to $75B in 2024, with a $30B AI infrastructure investment fueling future growth. Q4 EPS came in at $3.65 on $76.4B revenue, showing strong fundamentals.
We are looking for a pullback to key support for a long entry:
Trade Plan:
Entry Zone: $515 – $518
Take Profit: $536, $555
Stop Loss: $502
#Microsoft #MSFT #Stocks #Trading #StockMarket #TechnicalAnalysis #AI #Cloud #BigTech #NASDAQ
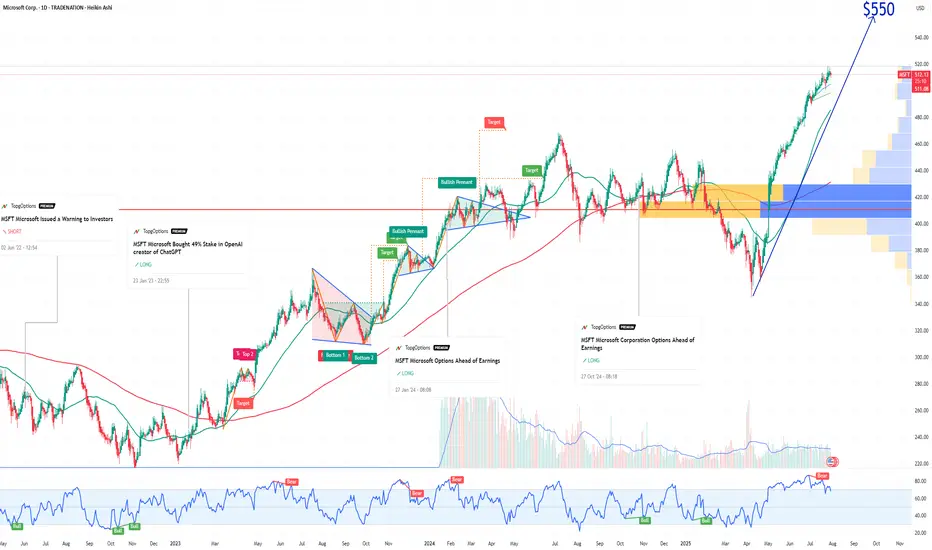
MSFT Microsoft Corporation Options Ahead of EarningsIf you haven`t bought MSFT when they announced the 49% stake in OpenAI:
Now analyzing the options chain and the chart patterns of MSFT Microsoft Corporation prior to the earnings report this week,
I would consider purchasing the 550usd strike price Calls with
an expiration date of 2025-12-19,
for a premium of approximately $14.75.
If these options prove to be profitable prior to the earnings release, I would sell at least half of them.
Disclosure: I am part of Trade Nation's Influencer program and receive a monthly fee for using their TradingView charts in my analysis.
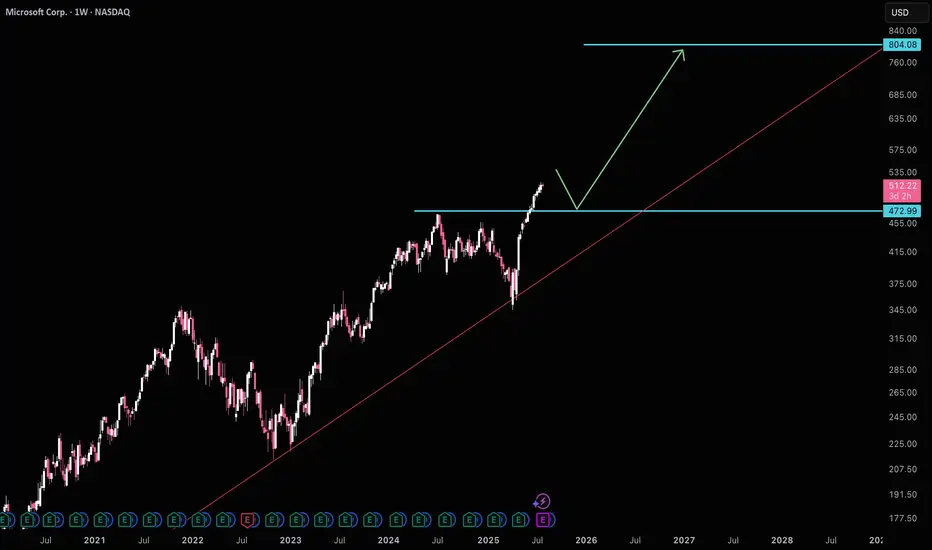
Mircrosoft wants to pullback to $470MSFT is likely to test $470 support before making it's move to $800. Another thing to be weary about is ratio MSFT/AAPL is at historical avg highs, which usually signals a bias towards AAPL. Waiting for $470 is a good idea before getting long again.
Good luck!
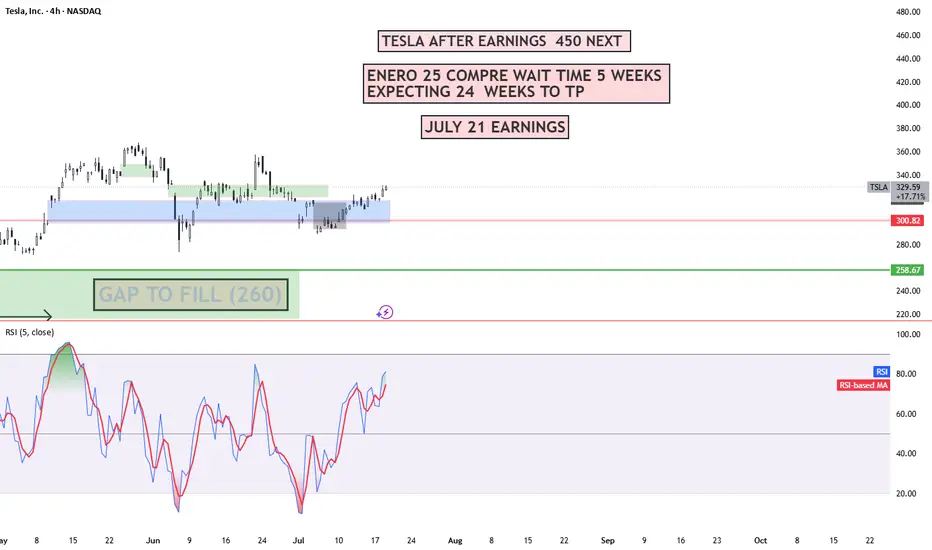
TESLA 400 BY END OF YEAR !! 5 REASONS !!!
1. **Strong Earnings and Revenue Growth**
Tesla has a track record of exceeding earnings expectations. If the company reports robust financial results in Q3 and Q4—driven by higher vehicle deliveries and growth in its energy storage business—investors are likely to gain confidence. This could push the stock price upward as Tesla demonstrates its ability to scale profitably.
2. **Advancements in Autonomous Driving**
Tesla’s Full Self-Driving (FSD) technology is a game-changer in the making. If Tesla achieves significant progress toward Level 4 or 5 autonomy—where vehicles can operate with little to no human intervention—it could position the company as a leader in transportation innovation. Such a breakthrough would likely excite investors and drive the stock price higher.
3. **Battery Technology Innovation**
Tesla is working on developing cheaper, longer-lasting batteries, which could lower production costs and improve profit margins. If the company announces advancements in battery tech—such as improvements from its Battery Day initiatives or new manufacturing processes—it could signal a competitive edge, boosting the stock to $400.
4. **Global Expansion and Production Increases**
Tesla’s new Gigafactories in Texas and Berlin are ramping up production, while potential market entries like India loom on the horizon. Increased output and access to new customers signal strong growth potential. If Tesla successfully scales its operations, investors may see this as a reason to push the stock price toward $400.
5. **Favorable Market Trends and Government Policies**
The global shift toward sustainable energy and electric vehicles (EVs) is accelerating, supported by government incentives and regulations favoring clean energy. If EV adoption continues to rise and policies provide a tailwind—such as subsidies or stricter emissions standards—Tesla, as an EV leader, could see increased demand and a higher stock valuation.
While reaching $400 by year-end is ambitious, Tesla’s strong brand, innovative edge, and leadership under Elon Musk could make it achievable. That said, risks like market volatility and growing competition from other EV makers could pose challenges. If these five factors align, however, Tesla’s stock has a solid shot at hitting that target.
Microsoft Sees Declining Trading Volume Despite All Time HighsSince December of 2021, MSFT traded within a Rising Wedge structure that has gradually resulted in lower and lower highs in volume, at the same time IV on the Options Chain has begun to price down the strikes above $515 while Shorter Term Downside IV has begun to price up all the way out to $240.00. If this trend continues we will likely see the $515 area act as strong resistance as liquid interest above it begins to dry out.
This could be the beginning of a move to break down the wedge and trade down to the lower strikes first targeting the $365 price level and resolving around $240 near the 200 Period SMA.
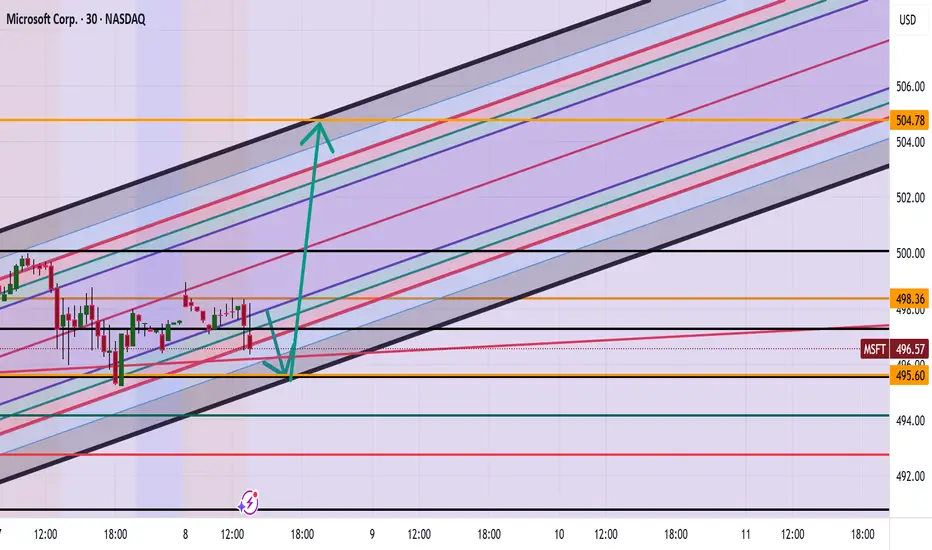
MSFT Correction then to 504?Morning everyone
Currently we are seeing a possible correction to the 495 zone with a possible break to the upside to 504 is what we are currently seeing.
Trade Smarter Live Better
Kris/Mindbloome Exchange
XLK ETF. TO WAR, OR NOT TO WAR — THAT IS THE QUESTION..US stock futures edged lower Wednesday evening ahead of Thursday’s market closure for Juneteenth.
The moves came after the Federal Reserve held interest rates steady, with Chair Jerome Powell striking a cautious tone amid rising geopolitical and economic uncertainty.
Powell reaffirmed a data-dependent approach, pointing to unclear inflation impacts from President Trump’s tariffs and the risk of stagflation.
Fed projections now include two rate cuts in 2025, alongside downgraded growth expectations and higher inflation forecasts.
Investor sentiment was further dampened by escalating tensions in the Middle East, as the ongoing Israel-Iran conflict stoked fears of deeper US involvement, while North Korea has recently launched 10 rockets from near capital Pyongyang.
Futures for 7 of the 11 S&P 500 sectors ended the Prime Day holiday in the red, led by declines in energy, while technology outperformed.
What is more important Technology sector is the one and only over 11 S&P 500 sectors that has printed recently new all the history high, just one - two days before Prime Day.
What is XLK The Technology Select Sector SPDR Fund ETF
AMEX:XLK ETF is respectively The Technology Select Sector ETF, that seeks to provide investment results correspond generally to the price and yield performance of the S&P 500 Technology Sector Index.
The largest 5 holdings of this ETF are Microsoft NASDAQ:MSFT , Nvidia NASDAQ:NVDA , Apple NASDAQ:AAPL , Broadcom NASDAQ:AVGO and Oracle NYSE:ORCL , while all together they weight nearly 50 percent of the fund by market cap.
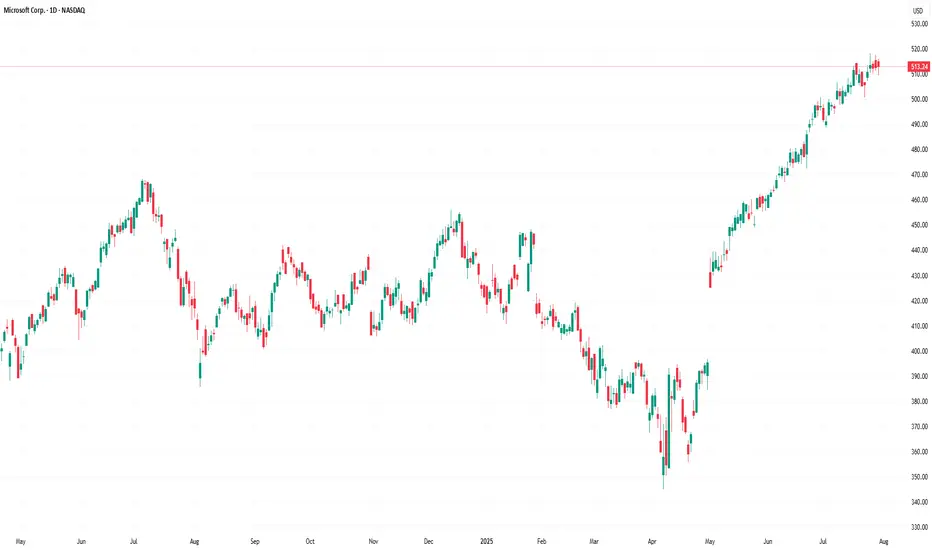
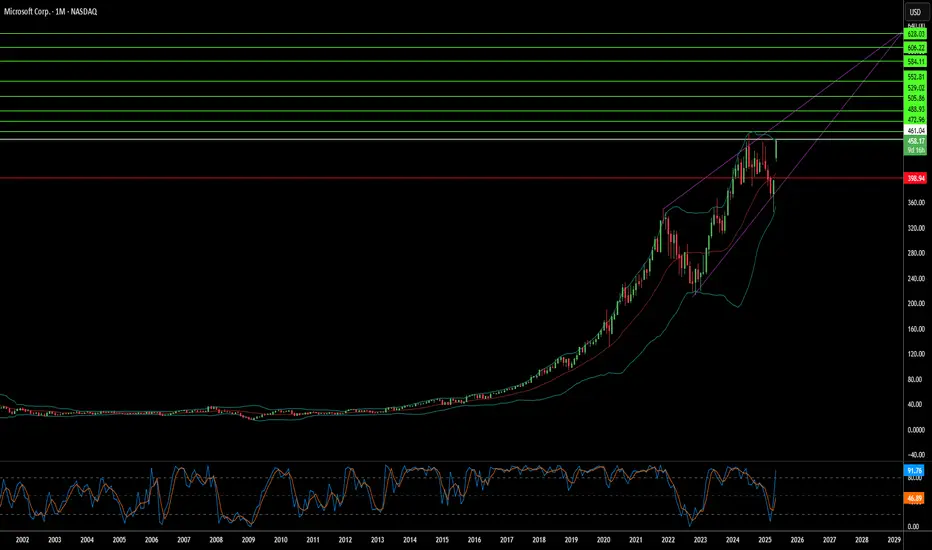
Microsoft NASDAQ:MSFT shares have experienced a significant upward trend in 2025, reaching new all-time highs and reflecting the company’s robust financial performance and strategic positioning in the technology sector.
Record Highs and Price Momentum
As of June 18, 2025, Microsoft’s stock closed at $480.24, marking its highest closing price ever. This price is just below its 52-week high of $481.00 and represents a 14% gain year-to-date, making Microsoft one of the best-performing stocks among the so-called “Magnificent Seven” tech giants in 2025. The stock’s average price over the past 52 weeks was $422.77, and its 52-week low was $344.79, which is 28.2% below the current level, highlighting the impressive rally over the past year.
Short-Term and Long-Term Performance
In the immediate term, Microsoft’s stock has shown steady gains. Over the past week, the share price rose by 2.03%, and over the past month, it increased by 6.36%. Looking at a broader horizon, the stock is up 6.79% over the last year, underscoring consistent investor confidence and the company’s ability to capitalize on growth opportunities.
Drivers Behind the Rally
Several factors have contributed to Microsoft’s recent share price surge:
Artificial Intelligence Investment. Microsoft continues to invest heavily in AI infrastructure, with plans to spend $80 billion in fiscal 2025. This aggressive investment is seen as crucial to maintaining a competitive edge in cloud computing and AI services, areas that are driving much of the company’s growth.
Cost Management. Despite the heavy spending on AI, Microsoft is also focused on controlling costs. The company is reportedly planning to trim thousands of jobs, particularly in sales, to offset rising expenses and protect profit margins. This follows earlier workforce reductions and reflects a broader trend among major tech firms to optimize operations amid escalating AI-related costs.
Diversified Revenue Streams. Microsoft’s strong position in software, cloud computing, and AI, along with its subscription-based business model and consistent dividend growth, have bolstered investor sentiment. The company’s cloud platform Azure and productivity tools continue to show strong adoption across industries.
Market and Analyst Sentiment
Microsoft’s market capitalization recently reached $3.55 trillion, with a price-to-earnings ratio of 36.94, indicating high investor expectations for future growth. Analysts’ price targets for MSFT range from $432 to $700, suggesting a wide spectrum of views but generally positive long-term sentiment.
Competitive and Operational Challenges
Despite its strong performance, Microsoft faces competitive pressures, particularly from OpenAI, which has been offering discounted ChatGPT subscriptions, impacting Microsoft’s own AI products like Copilot. Additionally, negotiations with OpenAI over continued access to its technology have reportedly stalled, introducing some uncertainty into Microsoft’s AI strategy.
Technical challenge and summary
While Microsoft shares have recently hit record highs, driven by aggressive AI investment, disciplined cost management, and strong core business performance, it robustly helped to all the Technology sector came back to 6-month key resistance after nearly 40 percent recovery rally.
While the market faces different challenges, we keep our strategic focus on next positions and further stock market development.
--
Best wishes,
@PandorraResearch Team 😎

MICROSOFT: 1D Golden Cross to slingshot it to $590MSFT turned overbought on its 1D technical outlook (RSI = 73.199, MACD = 13.580, ADX = 52.584), extending the rise to a new ATH today, having formed a 1D Golden Cross on June 9th. That was the first 1D Golden Cross since March 20th 2023, which validated a bullish extenstion to +71.50% from the bottom. Since the long term Channel Up has already started its new bullish wave, we are expecting the uptrend to continue up to +71.50% at least. Go long, TP = $590.
## If you like our free content follow our profile to get more daily ideas. ##
## Comments and likes are greatly appreciated. ##

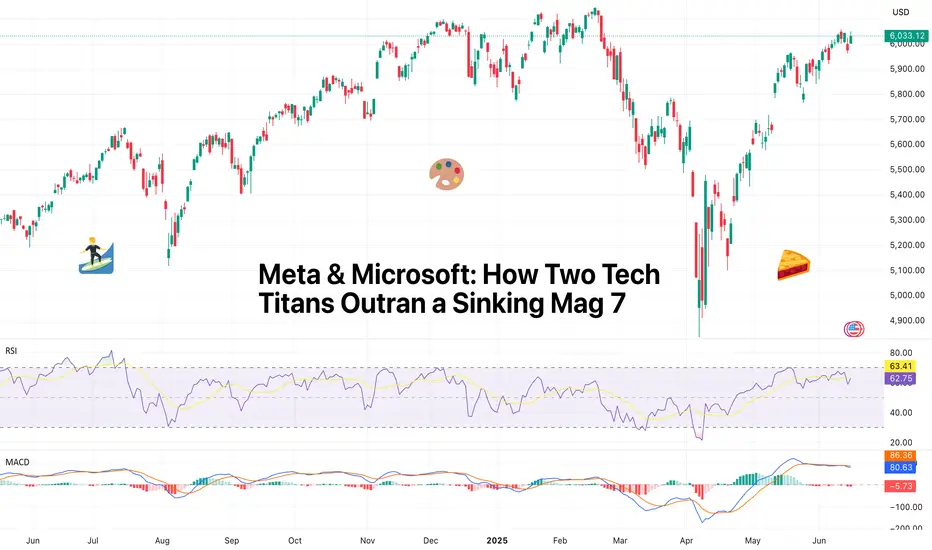
Meta & Microsoft: How Two Tech Titans Outran a Sinking Mag 7Forget about the Magnificent Seven and say hello to M&M — the only two winners of the year so far.
If you blinked during the first half of 2025, you might’ve missed it: the mighty Magnificent Seven are starting to look more like a Scraggly Five. While Tesla NASDAQ:TSLA fumbled its autonomy narrative and Apple NASDAQ:AAPL spent more time designing slides for the WWDC than in keynotes, two names quietly did the thing — created shareholder value.
Meta NASDAQ:META and Microsoft NASDAQ:MSFT
Both are up more than 13% year-to-date each, sitting comfortably at the top of the gains leaderboard. For comparison: Nvidia managed just 3% (and that’s with all the AI hype), and everyone else? Down. Flat. Or just ghosted by Wall Street. The iPhone maker? How’s 20% to the downside?
Let’s break down how Meta and Microsoft dodged the selloff.
📞 Meta: Not About That Meta
Meta NASDAQ:META came into 2025 like it had something to prove. Zuck had long gone full avatar with the metaverse. But now? Now he wants to win AI — and he’s putting his money where his data is. Meta’s latest foray into AI is a $14.3 billion investment into Scale AI.
A 49% non-voting stake in the AI darling isn’t for fun — but for function. It’s a full-court press to close the Llama-size gap between Meta’s in-house models and the heavyweights like OpenAI and Anthropic.
Scale AI, already one of Meta’s biggest vendors, processes and labels the data that fuels Meta’s large language models. It was only a matter of time before Zuck decided, “Hey, let’s just own a piece of the pipeline.”
And in true tech soap opera fashion, Scale CEO Alexandr Wang last week confirmed in an internal memo he’s leaving to join Meta full-time. For those keeping score: Wang, born in 1997, became the youngest billionaire in 2021. Now, he’s headed into the belly of the Menlo Park beast.
Wall Street seems to dig that. The stock shot up when the news leaked , as investors rewarded Meta for looking less like a social media giant and more like a serious AI player — even if it still serves your aunt’s minion memes.
👾 Microsoft: The OS of Enterprise Still Runs Smooth
Meanwhile in Redmond, Satya Nadella was out here quietly running the table.
Microsoft NASDAQ:MSFT hit an all-time high of $480 on June 12, pushing its market cap to a record-breaking $3.5 trillion. For about a day or two before that, Nvidia NASDAQ:NVDA was on top — and then Microsoft did what Microsoft always does: calmly pressed Ctrl+Alt+Delete on its competition and reclaimed its spot as Earth’s most valuable company .
How did that happen? Certainly not overnight.
Azure continues to gobble cloud market share, Microsoft 365 is still the gold standard for digital productivity, and Teams — love it or hate it — is now basically corporate law.
But don’t sleep on its AI game. Microsoft isn’t just throwing money at OpenAI, it’s embedding AI into everything it touches. Outlook, Excel, Word — all getting their Copilot upgrades. Want to finish that quarterly report faster? Let AI do it. Want it rewritten in pirate-speak? AI’s got you.
Microsoft isn’t just building tools. It’s establishing an infrastructure for the new AI economy. And traders see that. They understand that while Nvidia sells the shovels, Microsoft owns the mine.
👩🏻💻 Why the Rest of the Mag 7 Didn’t Make the Cut
Quick vibe check:
Apple NASDAQ:AAPL Still chasing the AI breakthrough. No one talks about the Vision Pro headset anymore, and the annual WWDC event wasn’t anything special. The stock is down 20% on the year.
Tesla NASDAQ:TSLA Robotaxis are coming ( maybe even this week ). But earnings pressure and margin squeeze made investors wish for more than tweets and timelines. The shares are underwater by 14% YTD.
Amazon NASDAQ:AMZN E-commerce growth hit cruise control, and its AI presence still feels more like an R&D lab than a monetized machine. The stock is staring at a 3.7% loss, largely thanks to Amazon getting slapped in the face from Trump’s tariffs .
Alphabet NASDAQ:GOOGL Search is still dominant, but Gemini’s bumpy launch and questionable performance has traders waiting for Google to actually ship something great, and not just strip the results from the iconic blue links . The stock is down 8%.
Nvidia NASDAQ:NVDA Yes, still the king of chips. And yes, it’s still delivering. But with valuation stretched like Lululemons in a CrossFit class and export bans weighing heavy , it’s getting harder to maintain the pace.
🍻 Trading Lesson: Leadership Rotates
If you’re a trader who’s been glued to Nvidia’s every tick or still buying dips on Apple because it “has to come back,” let this be your mid-year reminder: the market doesn’t care what used to lead.
Leadership rotates. Fundamentals shift. And sometimes, the best trade is the one hiding behind less hype and more function.
Case in point: While Apple’s been trying to find a catalyst, Meta just found a whole new business partner. While Nvidia’s been spinning plates on export rules, Microsoft’s just printing money off the back of Office subscriptions and Azure servers.
👀 What Happens Next?
With the second half of the year approaching, all eyes are on:
Meta’s AI ambitions — can the Scale deal accelerate model performance fast enough to close the gap with rivals?
Microsoft’s cloud dominance — can Azure continue its double-digit growth without hitting the regulatory radar?
Earnings, earnings, earnings — it’s almost the season again! Earnings reports kick off in about a month and things will get cracking.
Whatever happens, don’t bet the farm on what used to work. Watch the rotation. Track the strategy shifts. And for the love of charts — keep one eye on the Earnings Calendar .
💬 Final Thought
If Meta and Microsoft can shine while their peers flounder, what does that say about the real winners in this new AI economy? Maybe it’s not about who builds the flashiest model — but who actually knows how to monetize it. What’s your thought?
Microsoft - This might be the ultimate breakout!Microsoft - NASDAQ:MSFT - will break the all time high:
(click chart above to see the in depth analysis👆🏻)
If you wonder why Microsoft has been rallying +15% this month, market structure will give you an answer. In fact, the recent bullish break and retest was totally expected, and if we take into account the recent quite strong bullish behaviour, an all time high breakout will follow soon.
Levels to watch: $450
Keep your long term vision!
Philip (BasicTrading)

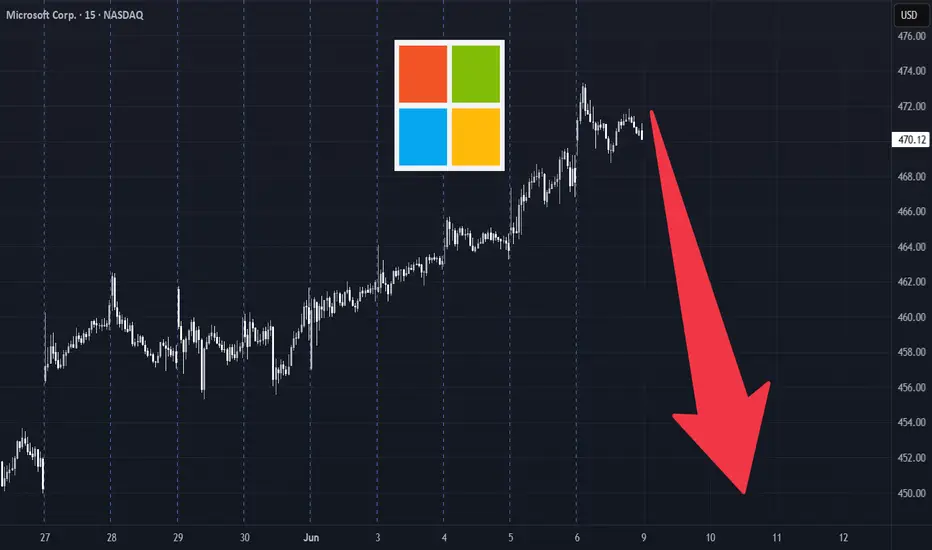
MSFT Weekly Options Play – 2025-06-09🧾 MSFT Weekly Options Play – 2025-06-09
Bias: Moderately Bearish
Timeframe: 5–6 days
Catalysts: Overbought RSI, weakening momentum, technical divergences
Trade Type: Single-leg put option
🧠 Model Summary Table
Model Direction Strike Entry Price Target Stop Loss Confidence
Grok Bearish 457.50P $0.76 $1.14 $0.19 65%
Claude Bearish 460.00P $1.03 $1.55 $0.72 70%
Gemini Bearish 457.50P $0.75 $1.20 $0.38 65%
DeepSeek Bearish 470.00P $3.65 $5.48 $2.56 70%
Llama Slightly Bullish 472.50C $3.15 $3.78 $2.83 68%
✅ Consensus: Short-term bearish trade setup
📉 Core Setup: Reversal from overbought with MACD divergence
⚠️ Outlier: Llama prefers bullish call due to longer-term trend strength
🔍 Technical & Sentiment Recap
Trend: Overextended rally, RSI (78.2) = overbought
Momentum: MACD shows bearish divergence on daily; 5-min weak
Sentiment: VIX ~16.7 = stable but cautious; mixed AI news & max pain at $460
Max Pain: $460 implies gravitational pull; current price may pull back
Volatility: Option premiums reflect narrow range, but directional edge favors downside
✅ Final Trade Recommendation
Parameter Value
Instrument MSFT
Strategy Single-leg PUT (weekly)
Strike $457.50
Entry Price $0.76 (ask)
Profit Target $1.22 (~60% gain)
Stop-Loss $0.38 (50% premium loss)
Size 1 contract
Entry Timing At market open
Confidence 65%
🎯 Rationale: Near-term exhaustion of upside, short-term technical reversal, and profit-taking setup with favorable risk/reward.
⚠️ Risk Checklist
Strong trend continuation could invalidate pullback thesis
Low VIX may reduce option gamma/velocity
Sector-wide positive catalyst (AI or rate cuts) can cause rapid rebound
Watch for closes above 10-EMA (~$461) to exit early if invalidated
📊 TRADE DETAILS SNAPSHOT
🎯 Instrument: MSFT
🔀 Direction: PUT (SHORT)
🎯 Strike: 457.50
💵 Entry Price: 0.76
🎯 Profit Target: 1.22
🛑 Stop Loss: 0.38
📅 Expiry: 2025-06-13
📏 Size: 1 contract
📈 Confidence: 65%
⏰ Entry Timing: open
🕒 Signal Time: 2025-06-09 01:44:06 EDT
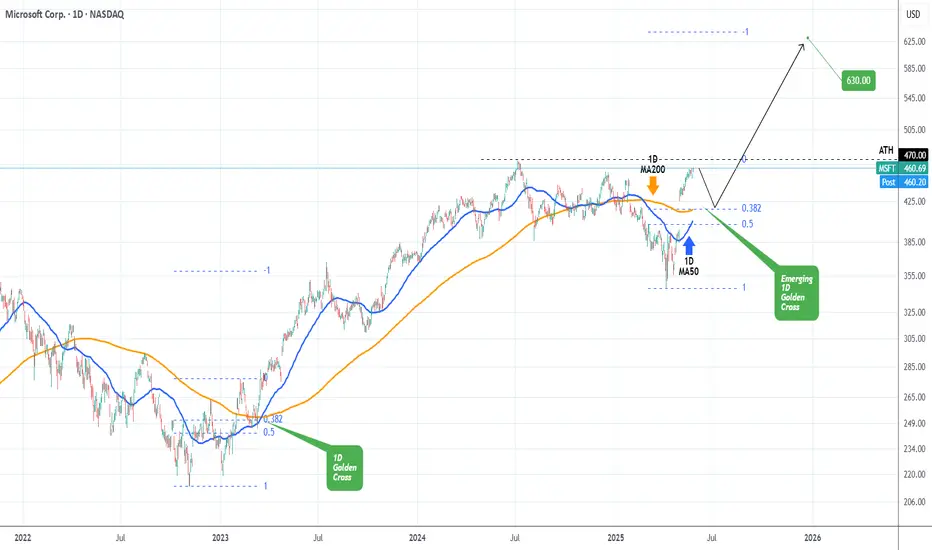
MICROSOFT Correction ahead of 1st 1D Golden Cross in 2 years?Microsoft (MSFT) is just below the $470 All Time High (ATH) and last technical Resistance, following the remarkable rally on the April 07 2025 bottom.
By the first week of June, it should technically form a 1D Golden Cross, which will be its first in more than 2 years (since March 17 2025). That Golden Cross was formed just after the price pulled-back on the 0.382 - 0.5 Fibonacci retracement Zone, finding support on its 1D MA50 (blue trend-line) and rebounding.
As a result, it is quite possible to see a short-term correction to at least $420 before the 1D Golden Cross restores the bullish sentiment. That previous structure eventually hit the -1.0 Fibonacci extension, before the next 1D MA50 test. We therefore expect to see $630 in 2025 before a 1D MA50 correction again.
-------------------------------------------------------------------------------
** Please LIKE 👍, FOLLOW ✅, SHARE 🙌 and COMMENT ✍ if you enjoy this idea! Also share your ideas and charts in the comments section below! This is best way to keep it relevant, support us, keep the content here free and allow the idea to reach as many people as possible. **
-------------------------------------------------------------------------------
💸💸💸💸💸💸
👇 👇 👇 👇 👇 👇
What Fuels Microsoft's Unstoppable Rise?Microsoft Corporation consistently demonstrates its market leadership, evidenced by its substantial valuation and strategic maneuvers in the artificial intelligence sector. The company's proactive approach to AI, particularly through its Azure cloud platform, positions it as a central hub for innovation. Azure now hosts a diverse array of leading AI models, including xAI’s Grok, alongside offerings from OpenAI and other industry players. This inclusive strategy, driven by CEO Satya Nadella's vision, aims to establish Azure as the definitive platform for emerging AI technologies, offering robust Service Level Agreements and direct billing for hosted models.
Microsoft's AI integration extends deeply into its product ecosystem, significantly enhancing enterprise productivity and developer capabilities. GitHub's new AI coding agent streamlines software development by automating routine tasks, allowing programmers to focus on complex challenges. Furthermore, Microsoft Dataverse is evolving into a powerful, secure platform for AI agents, leveraging features like prompt columns and the Model Context Protocol (MCP) server to transform structured data into dynamic, queryable knowledge. The seamless integration of Dynamics 365 data within Microsoft 365 Copilot further unifies business intelligence, enabling users to access comprehensive insights without switching contexts.
Beyond its core software offerings, Microsoft's Azure cloud provides critical infrastructure for transformative projects in highly regulated sectors. The UK's Met Office, for instance, successfully transitioned its supercomputing operations to Azure, improving weather forecasting accuracy and advancing climate research. Similarly, Finnish startup Gosta Labs utilizes Azure's secure and compliant environment to develop AI solutions that automate patient record-keeping, significantly reducing administrative burdens in healthcare. These strategic partnerships and technological advancements underscore Microsoft's foundational role in driving innovation across diverse industries, cementing its position as a dominant force in the global technology landscape.
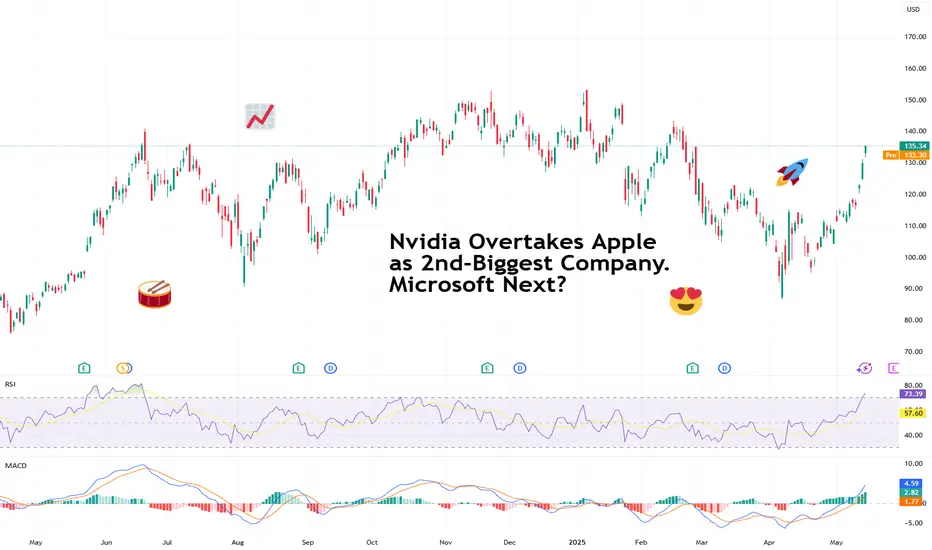
Nvidia Overtakes Apple as 2nd-Biggest Company. Microsoft Next?Well, well, well — if it isn’t the GPU-maker-turned-global-tech-Goliath lapping the iPhone factory on the market cap leaderboard . Again.
Nvidia NASDAQ:NVDA has officially snatched the second-largest company title from Apple NASDAQ:AAPL , bringing its market cap north of $3.3 trillion, while Apple sat there like a vintage iPod on shuffle at $3.17 trillion — playing the same valuation tune for days.
So, what’s powering this meteoric rise? It’s not just graphics cards for gamers — that’s 2015. And it’s not graphics cards for Big Tech — that’s 2024. It’s graphics cards paid for by Middle Eastern oil money.
😎 Saudi Chips: Not the Potato Kind
Here’s the scoop: Saudi Arabia and the UAE are ready to shell out billions to become AI superpowers. And who’s their go-to guy? Nvidia, of course.
CEO Jensen Huang, who was in Riyadh this week, announced that Nvidia will supply “several hundred thousand” of its most advanced processors to Humain, a state-backed Saudi firm tasked with building AI infrastructure across the desert kingdom. That includes 18,000 units of Nvidia’s cutting-edge GB300 Grace Blackwell chips — the stuff data scientists dream about.
Nvidia calls this initiative “sovereign AI” — governments building and running their own AI on national infrastructure. Think of it as building data sandcastles, except the sand is made of petrodollars and server farms.
The geopolitical context? President Trump’s Middle East tour is clearing regulatory roadblocks, scrapping AI export restrictions drawn up under Biden, and opening the region to top-shelf American tech.
And Wall Street is paying attention.
💪 Trump Dumps Diffusion Rule, Nvidia Pumps
One of the major tailwinds for Nvidia’s latest rally came in the form of a policy reversal. The Biden-era “AI Diffusion Rule,” which aimed to restrict exports of advanced chips, has now been tossed by the Trump administration.
According to the Bureau of Industry & Security, the rule would have “undermined US innovation” and strained diplomatic relations. Translation? Nvidia was about to have its international wings clipped — but now it's free to fly across the Persian Gulf with pallets of GB300s.
The rule reversal instantly boosts Nvidia’s global reach — and opens the floodgates for billions in international chip demand. Naturally, the stock responded positively, climbing 5.4% on Monday, 5.6% on Tuesday, and 4.1% on Wednesday.
🚂 Not Just a Hype Train (But Bring Snacks Anyway)
Nvidia’s rally isn’t just FOMO (but there is some froth every now and then ).
It’s backed by earnings, expansion, and actual demand. Every major AI player — from startups to sovereign nations — needs Nvidia chips. And there’s no clear rival. AMD NASDAQ:AMD is a step behind. Intel NASDAQ:INTC is still trying to remember how to make people excited again.
But at these levels, expectations are sky-high. Even a great quarter that’s not utterly perfect could trigger some profit-taking. After all, trees don’t grow to the sky — but apparently semiconductors are expected to .
👀 Eyes on Microsoft, But Timing Is Key
So what’s next? Can Nvidia dethrone Microsoft NASDAQ:MSFT , currently valued at just about $60 billion more, and become the biggest company in the world?
Easily, especially if Huang’s tech juggernaut keeps this pace and posts another monster earnings beat. Nvidia reports on May 28, and you can bet every institutional desk, Reddit thread, and our very own TradingView community will be glued to their multi-screen setups to get those numbers.
Microsoft still sits at the top with a $3.36 trillion valuation — within striking distance. All it would take is another ~1.8% pop for Nvidia and a sleepy session for Microsoft.
But be warned: Wall Street loves a Cinderella story until the glass slipper misses earnings by two cents.
🧐 Final Thoughts: Watch Out Everyone
Apple may have Siri. But Nvidia has the chips to build a thousand Siris — and a few Skynets while we're at it.
Whether it can overtake Microsoft depends on the next earnings report (or the lead-up hype).
So the question isn’t “Will Nvidia stay #2?” It’s: How long until it’s #1 — and what could possibly stop it?
And if you’ve got it on your watchlist, circle May 28 in red marker and don’t forget to pay attention to the earnings calendar .
Because that earnings print might just rewrite the leaderboard again.
Your move : Are you riding NASDAQ:NVDA to the top? Waiting for a pullback? Or nervously watching from the sidelines with popcorn and regret? Hit the comments with your play.
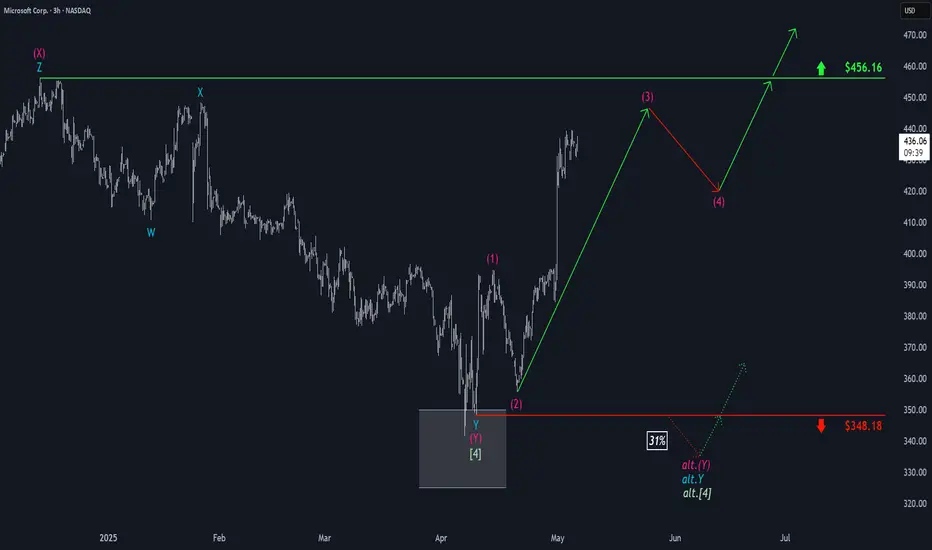
Microsoft: Progress!Microsoft successfully completed the magenta wave (2) and made further progress during the subsequent wave (3). Imminently, this wave (3) has some more room to rise, and after a temporary pullback in the following wave (4), the price should eventually overcome the resistance at $456.16. On the other hand, our 31% likely alternative scenario envisions a new low for the green wave alt. and would include a detour below the support at $348.18. Primarily, we consider the regular wave as already completed (in our previous Target Zone).
Microsoft (MSFT) Becomes the World’s Most Valuable CompanyMicrosoft (MSFT) Becomes the World’s Most Valuable Company
According to financial data, Microsoft’s market capitalisation currently stands at approximately $3.24 trillion, while the valuations of Apple and Nvidia — second and third on the list respectively — remain below $3 trillion.
This follows a sharp surge in Microsoft’s share price (MSFT), which has risen by over 26% from its April low.
Why has Microsoft’s share price risen?
The main driver behind the MSFT stock rally was last week’s quarterly report, which outperformed analysts’ expectations:
→ Earnings per share: actual = $3.46, forecast = $3.22;
→ Revenue: actual = $70 billion, forecast = $68.4 billion.
As reported in the media, investors responded positively to a notable increase in revenue from Azure cloud services.
Technical Analysis of Microsoft (MSFT) Shares
A wide bullish gap — over 7% — pushed the price above a key support line that had underpinned the 2024 uptrend in Microsoft stock.
However, following the report’s release, the price stabilised just below a resistance line drawn through previous key highs.
This provides grounds to interpret the current setup as a symmetrical triangle pattern with an axis around the $427 mark, suggesting short-term price consolidation within the defined boundaries.
Going forward, further key news related to Microsoft — a company less exposed to trade war impacts than Apple — could:
→ help maintain its status as the world’s most valuable firm;
→ support a potential bullish breakout through the resistance line and a continuation of the 2024 uptrend.
This article represents the opinion of the Companies operating under the FXOpen brand only. It is not to be construed as an offer, solicitation, or recommendation with respect to products and services provided by the Companies operating under the FXOpen brand, nor is it to be considered financial advice.
Microsoft (MSFT) Share Price Jumps Nearly 9% – What’s Next?Microsoft (MSFT) Share Price Jumps Nearly 9% – What’s Next?
As the chart shows, Microsoft (MSFT) shares surged sharply, forming a large bullish gap: while trading closed around $391 on 30 April, yesterday’s candlestick closed just below the $425 mark.
What Drove the Rally in Microsoft Shares?
Microsoft released its financial results for the first quarter of 2025, exceeding Wall Street expectations on both revenue (actual = $70.1 billion, 2.4% above forecasts) and earnings per share (actual = $3.46, 7.4% above forecasts).
Particular attention was drawn to the strong performance of Azure – revenue from Azure and other cloud services soared by 33% year-on-year. A significant part of this growth was fuelled by robust demand for artificial intelligence services, which helps ease concerns about the return on large-scale infrastructure investments related to AI.
In addition, Microsoft issued an upbeat outlook for the next quarter, which ultimately triggered the sharp rise in its share price.
Technical Analysis of MSFT Chart
Yesterday’s candlestick closed near its low (highlighted by the arrow), indicating that bears were active during the trading session. From a technical analysis perspective, this can be explained by the proximity of the price to two key resistance lines:
1 → The upper boundary of a descending channel drawn from significant price action patterns (marked in red). The relevance of this channel is confirmed by the price’s behaviour near its median line (dashed).
2 → A former trendline that served as support throughout 2024.
Therefore, a short-term correction cannot be ruled out following the sharp rally in MSFT shares, potentially tempering some of the enthusiasm generated by Microsoft’s strong quarterly report.
This article represents the opinion of the Companies operating under the FXOpen brand only. It is not to be construed as an offer, solicitation, or recommendation with respect to products and services provided by the Companies operating under the FXOpen brand, nor is it to be considered financial advice.

Bitcoin Vs Microsoft 🚨MartyBoots here , I have been trading for 17 years and sharing my thoughts on COINBASE:BTCUSD .
🚨
.
NASDAQ:MSFT vs COINBASE:BTCUSD
Do not miss out on COINBASE:BTCUSD as this is a great opportunity. You are still early
Watch video for more details

Tariffs, and Tumult: Wall Street Waits on Super WednesdayHello everyone, it’s April 30, 2025. The TVC:DJI just closed its sixth consecutive green session, with markets clinging to hope as rumors swirl of a first tariff deal—possibly with India—though nothing is confirmed. That tiny breadcrumb of optimism was enough to boost sentiment late in yesterday’s session, even if volatility is dipping below 25% and investor enthusiasm seems to be fading in lockstep.
U.S. macro data continues to paint a picture of “not great, but not terrible.” Consumer confidence and job openings (JOLTS) came in below expectations but not disastrously so, prompting markets to collectively shrug and declare everything “less worse than feared.” It’s a strategy now: ignore bad data as long as it isn’t apocalyptic.
As earnings roll in, companies are split between those who pretend the tariff storm is “manageable” (hello, NASDAQ:COKE ) and those flying blind through economic fog ( NYSE:UPS , Snap, and Super Micro—who might be losing a major client named Nvidia). The overall takeaway? Visibility is garbage, and most companies are bracing rather than building.
All eyes are now on today’s so-called Super Wednesday, packed with economic data (U.S. GDP, PCE, ADP jobs, Chicago PMI) and mega-earnings from NASDAQ:MSFT and NASDAQ:META . But as usual, expectations may outpace reality. Markets often dream of clarity and wake up to more noise.
Meanwhile, China flashed its first big red light: a manufacturing PMI of 49, signaling contraction—the lowest in two years. No shock, considering their ongoing trade war with the U.S., which seems to be giving the global economy the flu.
On the political front, Trump celebrated his 100 days in office with a campaign-style detour to Detroit, throwing shade at Fed Chair Jerome Powell while declaring the economy in perfect health (despite the worst market performance since Nixon’s early days). He promised tax cuts, again, while doubling down on trade threats. Powell, of course, is just trying to survive the week.
Oil briefly dipped under $60 as markets considered the broader implications of economic warfare, gold sits at $3,311, and Bitcoin hovers around $95,000—looking resilient despite the madness.
As for corporate earnings, Starbucks missed on sales due to weak U.S. demand, Pfizer beat on EPS but saw revenue fall, and Visa continues to rake in profits as Americans keep spending like inflation isn’t real. Novartis crushed it but got no love from the market because apparently, +22% net income just isn’t sexy enough.
In short: chaos remains king. Markets seem oddly calm on the surface, but under the hood, it’s still all about tariffs, Trump tweets, and the fantasy that maybe—just maybe—some clarity will come today. Don’t hold your breath.
Enjoy the ride, and see you tomorrow for more market mayhem.
Microsoft in Focus Ahead of Key Earnings, AI Outlook Under WatchMacro:
- Microsoft (MSFT) climbed on cautious optimism ahead of major earnings and economic data.
- Four of the “Magnificent Seven,” AMZN, AAPL, META, and MSFT, are set to report, with investors focusing on Microsoft (MSFT) today.
- Wall Street expects EPS of 3.22 USD and revenue of 68.44 B USD, both up YoY. Microsoft’s strength in AI, cloud, and enterprise software, along with its continued investment in AI talent and solid dividend history, makes this a closely watched report.
- Key drivers will be its results, AI/cloud growth outlook, and forward guidance, while any surprises could shift the stock sharply.
Technical:
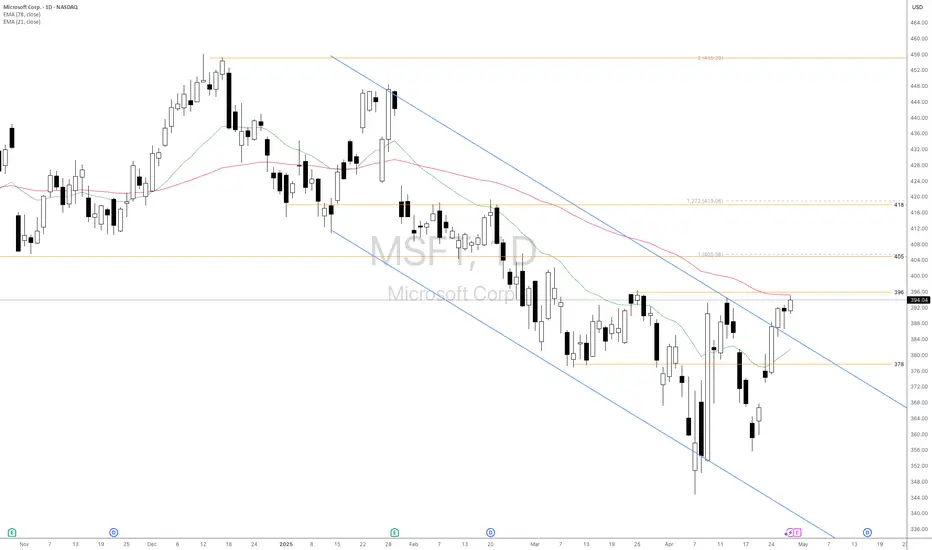
- MSFT recovered and tested the resistance at around 396, confluence with EMA78. The price is sideways, and we await a clearer breakout to determine the following direction.
- If MSFT breaks above 396, the price may approach the following resistance at 405, confluence with the 100% Fibonancci Extension.
- On the contrary, remaining below 396 may prompt a retest to the support at around 378, confluence with the broken descending channel.
Analysis by: Dat Tong, Senior Financial Markets Strategist at Exness
Microsoft's Downtrend Poised for Deeper RetracementsMSFT 4D TECHNICAL ANALYSIS 📉
OVERALL TREND
📉 DOWNTREND — Confirmed by the descending pivot structure, cluster of recent lower highs, and bearish rejection from the 430–455 zone. The downtrend is confirmed with a moderately confident score of 23.8%, with a Trend Score of -0.50.
🔴RESISTANCE ZONE
🔴 468.3500 — SELL STOPLOSS | PIVOT HIGH
🔴 455.7494 — SELL ORDER 2
🔴 430.2472 — SELL ORDER 1
🎯ENTRIES & TARGETS
🎯 381.6944 — SELL ORDER & | TP 1
🎯 340.8905 — SELL ORDER & | TP 2 | MID-PIVOT
🎯 310.8399 — SELL ORDER & TP 3
🎯 264.4180 — EXIT SELL & TP 4
🟢SUPPORT ZONE
🟢 253.2621 — BUY ORDER 1
🟢 226.1769 — BUY ORDER 2
🟢 213.4130 — BUY STOPLOSS | PIVOT LOW
✍️STRUCTURAL NOTES
Major lower high rejection seen near 455–468 zone—clearly defined by the last bullish failure to break above
Recent candles show moderate bullish defense near 380, but unable to create a higher high
All key short-term MAs (10–50) are bearish, with crossover confirmation stacking downward
Longer-term moving averages (100–200) show mixed signals; short-term selling strength remains dominant
Oscillators show mixed-to-weak bearish signals, with MACD and Awesome Oscillator suggesting negative momentum
📉TRADE OUTLOOK
📉 Bearish Continuation Bias with potential downside continuation toward TP3 @ 310.84 and TP4 @ 264.41
📈 Temporary bounce possible at 381.69–340.89 range, but expected to be corrective unless higher highs are confirmed
🔍 Watch for retest and rejection at 430.24 or 455.74 zones to validate reentry setups on the short side
🧪STRATEGY RECOMMENDATION
CONSERVATIVE APPROACH (Trend-Following):
— Entry: 381.69 (on rejection confirmation)
— TP: 340.89 / 310.84 / 264.41
— SL: Above 430.25
AGGRESSIVE REVERSAL PLAY:
— Entry: 253.26 (Buy Order)
— TP: 310.84 / 340.89
— SL: Below 213.41
“Discipline | Consistency | PAY-tience™”

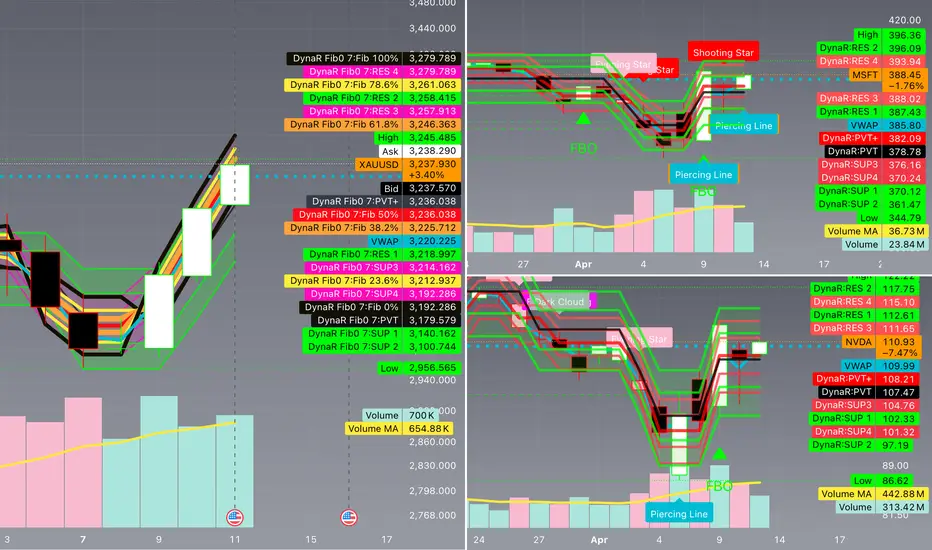
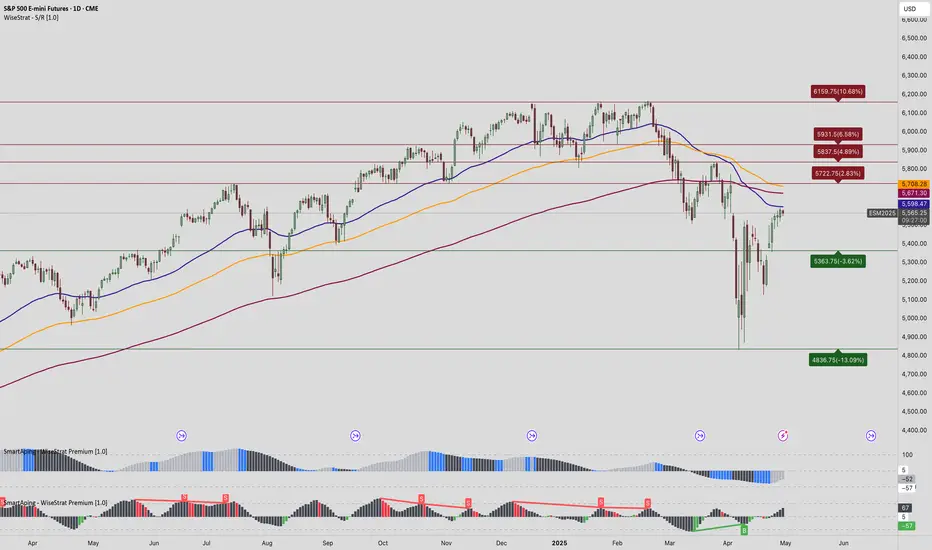
Margin Meltdown & the Golden Surge: How Tech Cracks Fueled Gold?Margin Meltdown & the Golden Surge: How Tech Cracks Fueled Gold’s Breakout in April 2025
Fear-Driven Flight to Gold is Real
If margin calls continue and top stocks like Microsoft and NVIDIA keep showing weakness:
• Expect more bond market stress
• A persistently weak dollar
• And a sustained gold rally
Gold is the cleanest beneficiary of the current chaos. Every chart, every data point, every political move validates it.
////////=====////////
What’s Happening in the Stock Market and Trump’s Tariffs – Simple Summary (Updated & Validated)
1. Margin Loans:
Many investors borrowed money using their stock portfolios as collateral. For example, if someone owns $100,000 in Microsoft stock (now trading at $388.45), they could borrow up to 90% of that value — $90,000 — and use it to buy other stocks like NVIDIA ($110.93).
2. Margin Calls:
When the market fell earlier this month, Microsoft and NVIDIA dropped sharply. Brokers issued margin calls, forcing investors to either deposit more funds or sell off assets to cover their positions.
3. Forced Selling:
As stocks fell further, more investors were forced to liquidate. This increased selling pressure pushed prices down even harder.
4. Vicious Cycle:
The deeper the drop, the more margin calls got triggered, which led to even more forced sales — a self-perpetuating loop of destruction.
5. Bond Selling Instead of Stocks:
Some investors didn’t want to sell their stock positions and instead began selling bonds to raise cash — including even U.S. Treasuries.
6. Bond Market Shock:
This rare, broad-scale bond selloff shook up the entire fixed-income market — everything from corporate to government bonds dumped.
7. Rising Yields:
As bond prices fell, yields spiked. But this wasn’t due to strong growth — it was pure fear-driven liquidation.
8. Unexpected Dollar Weakness:
Usually, during times of crisis, the dollar strengthens. But not this time. The U.S. dollar fell, while currencies like the euro and Swiss franc gained. The Chinese yuan stayed weak under its own pressures.
9. Trump’s Reaction:
In response to the chaos, Trump’s administration paused tariffs for 90 days — a political move under pressure. But the damage to market psychology was already done.
10. Tax-Loss Harvesting by Smart Investors:
During the crash, savvy investors sold declining stocks like Microsoft to lock in tax deductions, then bought similar alternatives like NVIDIA to stay in the market while writing off losses.
Impact on Gold (XAU/USD) – Real-Time Validation
As of April 12, 2025, Gold (XAU/USD) is trading at:
$3,235.91 (+$60.13 for the day | +12.02% over the past month)
Let’s validate the theory with what actually happened:
1. Gold vs. Stocks and Bonds:
While Microsoft and NVIDIA were collapsing earlier this month, gold surged. This shift confirms a flight to safety — gold became the preferred hedge during equity and bond volatility.
2. Falling Dollar = Bullish for Gold:
With the dollar under pressure, gold became cheaper in foreign currencies — driving international demand and pushing prices even higher.
3. Rising Yields – But Driven by Panic:
Normally, higher yields compete with gold. But this time, yields rose because bonds were being dumped, not because of economic strength. That fear drove even more capital into gold.
4. Policy Uncertainty:
Trump’s late response and inconsistent trade policies fueled further market unease. That pushed more investors toward gold as a non-political store of value.
5. Liquidity Crunch Risk:
Some gold may have been sold during the panic to raise quick cash, but overall, the trend shows that gold held firm and then broke out even harder — a textbook crisis hedge move.
Real Example: Microsoft and NVIDIA Margin Trap
Let’s walk through the actual setup:
• An investor owns $100,000 in Microsoft (MSFT at $388.45).
• They take a $90,000 margin loan to buy NVIDIA (NVDA at $110.93).
• Early April:
• MSFT dropped below $320.
• NVDA fell under $100.
This triggers:
• Margin calls.
• Forced selling of both positions.
• Possibly even bond liquidation.
• And systemic panic across portfolios.
Result?
• Tech sold off.
• Bonds dropped.
• Yields rose.
• Dollar weakened.
• Gold exploded.
///////======//////
Impact on Gold (XAU/USD): Real Events, Real Movement
• Microsoft & NVIDIA Down: Confirmed panic in tech.
• Bond Selloff = Higher Yields: But from fear, not confidence.
• Weaker Dollar: Confirmed.
• Gold Breakout: Real.
• RSI above 70
• ADX shows trend strength
• Volume surging
• Price broke $3,200 and held
Gold moved exactly how a textbook safe haven asset should behave in this
//////======///////
XAUUSD market behavior and trader mindset:
1. Monday: Continuation After Breakout (Euphoria Phase)
Psychological Insight:
Traders and institutions are chasing momentum. After a clean breakout, FOMO kicks in, especially for those who missed the first leg. They buy pullbacks aggressively, creating a bullish Monday.
Projection: Bullish continuation
Range: 3,230 – 3,270
Bias: Buy dips
Reason: Momentum from last week’s breakout still pushing higher. RSI >70 but not topping, and no reversal pattern on daily chart. Weak USD persists.
2. Tuesday: Pullback from Overextension (Reality Check)
Psychological Insight:
Once price pushes too far, short-term traders start locking profits. This creates a dip. But smart money (institutions) sees the pullback as cheap entry — especially with no bearish reversal confirmation.
This is textbook reaccumulation psychology.
Projection: Intraday pullback, then bounce
Range: 3,250 – 3,280
Bias: Buy on VWAP pullback
Reason: Small retracement likely due to overextension. Support at VWAP (~3,219). Bullish engulfing pattern might trigger dip-buyers.
3. Wednesday: Retest / Breakout (Conviction Phase)
Psychological Insight:
After a healthy pullback and hold, traders regain confidence in the trend. Breakout traders load in here — and weak shorts get squeezed. This is where bullish conviction peaks, triggering high-volume moves.
Projection: Breakout attempt
Range: 3,265 – 3,310
Bias: Scalpers can long breakout
Reason: If momentum holds, this is likely the day gold retests highs and pushes through short-term resistance (~3,300 psychological + fib extension zone).
4. Thursday: Sideways Chop (Indecision / Distribution)
Psychological Insight:
Market participants are split. Some want to hold into the weekend; others fear a Friday sell-off.
You see hesitation, tighter ranges, and volume drop-off — classic signs of short-term indecision and distribution by early buyers.
Projection: Consolidation / Sideways
Range: 3,280 – 3,310
Bias: Neutral-to-bullish
Reason: After a breakout, price typically stalls for distribution/re-accumulation. Expect reduced volatility unless triggered by macro news (watch bond yields).
5. Friday: Final Move (Greed vs. Fear Showdown)
Psychological Insight:
End-of-week decisions are all about book-squaring. If the week was strong and the narrative holds, we get greedy breakouts into the weekend.
If uncertainty creeps in (e.g. Fed noise, geopolitical tension), profit-taking overrides conviction, leading to a dip.
Projection: Second leg breakout or profit-taking
Range: 3,270 – 3,330
Bias: Depends on Thursday’s behavior
Scenario 1: If Thursday consolidates tightly, breakout possible.
Scenario 2: If extended already, profit-taking dip possible into close.
/////=====/////
Weekly Summary:
• High probability: Gold hits $3,300 – $3,330 this week
• Support zones: $3,219 (VWAP), $3,175 (previous breakout zone)
• Resistance zones: $3,298 (fib cluster), $3,330 (round number magnet)
This projection isn’t just TA — it’s behavioral trading at its core, based on how traders actually react:
• FOMO,
• profit-protection,
• fear of reversal,
• and end-of-week positioning.
Every day’s move is driven by human emotion wrapped around market structure.