Microsoft Soars to Record High Following Strong Earnings ReportMicrosoft Stock (MSFT) Soars to Record High Following Strong Earnings Report
As the chart illustrates, Microsoft (MSFT) shares surged sharply after the close of the regular trading session – an immediate market reaction to the company’s strong quarterly results.
According to available data, MSFT's post-market price jumped to $555 per share, exceeding its previous all-time high by more than 8%.
Why Did MSFT Share Price Rise?
The quarterly report provided several reasons for optimism, including:
→ Earnings per share (EPS) came in at $3.65, beating analysts’ expectations of $3.37 by over 8%. Revenue also exceeded forecasts, totalling $76.4 billion versus the projected $73.9 billion.
→ Microsoft’s cloud revenue rose by 27% to $46.7 billion, while Azure’s annualised revenue exceeded $75 billion, driven by growing demand for AI-related services.
In response to these results, Barclays analysts quickly raised their price target for Microsoft shares from $550 to $625.
Technical Analysis of MSFT Chart
It is worth noting that the previous quarterly report was also strong, resulting in the formation of a large bullish gap on 1 May, followed by a sustained upward trend (highlighted by the purple trendline S). Importantly, the gap in the $395–425 range remains unfilled.
Yesterday’s report is also likely to result in a large bullish gap at the market open today, though this time, the market context could lead to a different scenario.
The key factor here is the long-term ascending channel (shown in blue), which reflects MSFT’s price movements throughout 2024–2025. After the previous strong report, the share price moved from the median to the upper boundary of the channel without setting a new record high. However, following the most recent report, the price has surged deep into overbought territory, potentially setting a multi-month high on the RSI and achieving a significant breakout to a new record.
As a result, once the initial excitement around the earnings subsides – and the desire of investors to close long positions intensifies – MSFT could undergo a correction from the upper boundary of the channel. In this scenario, the following support levels could come into play:
→ The psychological level of $550 in the short term;
→ The S trendline, as a possible support during a deeper correction.
This article represents the opinion of the Companies operating under the FXOpen brand only. It is not to be construed as an offer, solicitation, or recommendation with respect to products and services provided by the Companies operating under the FXOpen brand, nor is it to be considered financial advice.
Microsoftforecast
Microsoft (MSFT): What’s Next? Will It Break $455.34 Morning, Trading Family! Let’s Talk About Microsoft (MSFT): Will It Break $455.34 or Head Lower?
Microsoft’s stock is at a key level, and the next move could set the tone for what’s ahead. The magic number right now is $455.34. Will we see a breakout to new highs, or could the price dip lower before bouncing back? Let’s break it down step by step so everyone’s ready!
If Microsoft Breaks Above $455.34
If the stock moves above $455.34 and holds steady, it could signal that buyers are in control.
What could happen?
The price might head up toward $460 or even $465. These levels could be the next spots where the stock takes a breather.
What should we watch?
Look for strong movement above $455.34 with good trading volume (lots of action). If the price quickly dips back below, it could mean the breakout isn’t real yet.
How can we trade it?
If the price holds above $455.34, it might be a good time to think about buying with a target around $460. Just make sure to use a stop-loss in case the trade doesn’t go as planned.
If Microsoft Drops Below $455.34
If the stock struggles to stay above $455.34, we could see a pullback.
The first key level:
Watch $449. This is the next area where buyers might step in to stop the price from falling.
If $449 doesn’t hold:
The price could drop further, landing somewhere in the $443–$438 range, where stronger support is likely.
How can we trade it?
Be patient! If the price dips, wait for signs that it’s stabilizing at a support level before making any moves.
What If the Price Drops Below $438?
If MSFT falls below $438, it could mean the stock is turning more bearish. At that point, we’ll need to step back and reassess the trend.
Tips for Today’s Trading
If you’re bullish: Wait for the price to break and hold above $455.34 before jumping in.
If you’re bearish: Watch for a clean break below $449 for potential short opportunities.
Always: Use stop-losses to protect yourself and trade with a plan!
Bottom Line:
The $455.34 level is the line in the sand. If we break above, it’s good news for the bulls. If not, we could see a dip to $449 or lower.
Kris/ Mindbloome Exchange
Trade What You See

Microsoft: Progress!The Microsoft stock has now successfully completed wave B in turquoise at $444.95. So, now we locate the price in the subsequent wave C, which is set to finalize the overarching three-part wave in dark green. This suggests further declines, with an ideal low just below $400. Following the low of the overarching wave , Microsoft should initiate a new upward impulse. While there’s a 25% chance that wave alt. in dark green has already hit its low, this alternative scenario will only be confirmed if the stock breaks above $469.55.

Microsoft Analysis 23.11.2022Hello Traders,
welcome to this free and educational analysis.
I am going to explain where I think this asset is going to go over the next few days and weeks and where I would look for trading opportunities.
If you have any questions or suggestions which asset I should analyse tomorrow, please leave a comment below.
I will personally reply to every single comment!
If you enjoyed this analysis, I would definitely appreciate it, if you smash that like button and maybe consider following my channel.
Thank you for watching and I will see you tomorrow!

🟢 MSFT - 3D (07.10.2022)🟢 MSFT
TF: 3D
Side: Long
SL: $232.73
TP 1: $260.33
TP 2: $277.40
TP 3: $291.20
Spotted some bullish divergence on the Microsoft 3D chart.
I am expecting a relief bounce here that could last several weeks.
1W RSI and MACD also look ready to support the movement.

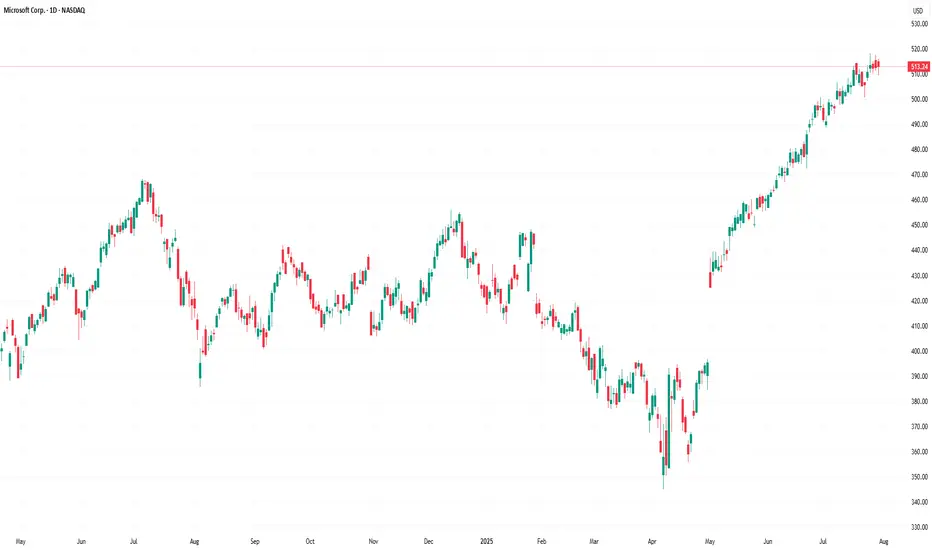
MICROSOFT LONGHi there,
As you can see it is following the channel well. Back in 2020 it dropped then over the next 6 months, it went up 50% more than the previous peak. Since it is at the lower end of the channel and the BULLISH uptrend since 2007, we can expect MICROSOFT to bounce back.
HOWEVER, we shall WAIT for the CLOSURE of the candle when MARKET opens and we SHALL wait further to let it BREATH then enter the trade and let it ROLL for a nice LONG SWING.
Kind regards

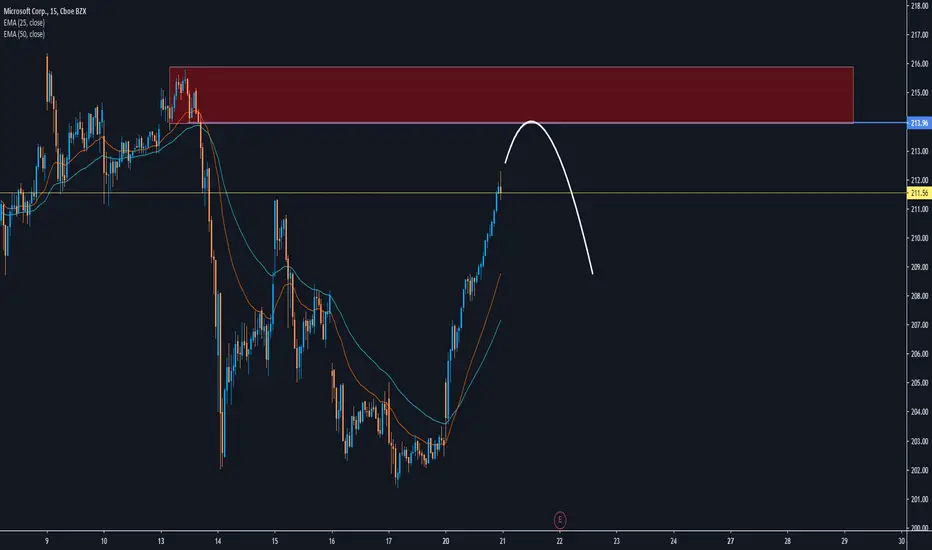
Short opportunity on MICROSOFTOur view on this Stock for today
Entry 214
SL 216.2
TP 209
----
Stay connected with us for further trades
Trading Kitchen