Microsoft -> All Timeframes Are BullishHello Traders,
welcome to this free and educational multi-timeframe technical analysis .
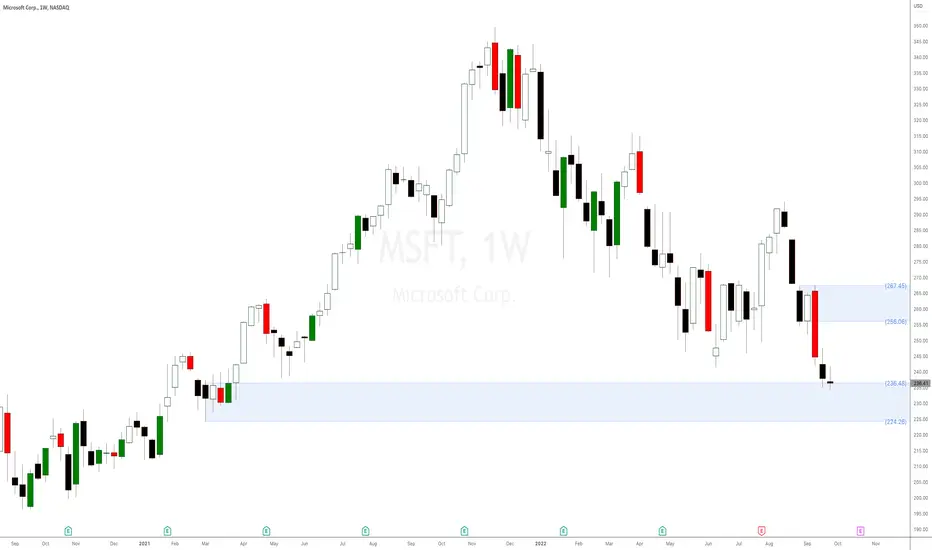
Microsoft is looking extremely juicy right now. From a weekly perspective we just created a long term double bottom and we also broke above a long term downtrend line.
There is definitely the possibility that after a short term pullback, we will start the next bullrun from here, creating new all-time-highs in the process.
From a daily perspective I am just waiting for a short term retest of the weekly neckline of the double bottom and then there is a very high chance that we will also see the daily continuation to the upside from here.
Thank you for watching and I will see you tomorrow!
You can also check out my previous analysis of this asset:
Microsoftstock

Microsoft -> Very Bullish Inverted Head And ShouldersHello Traders,
welcome to this free and educational multi-timeframe technical analysis.
Microsoft just recently perfectly tested and rejected a quite strong and obvious previous support/resistance zone towards the upside. It also seems like Microsoft is about to create a double bottom from a weekly perspective, which is generally speaking a very bullish pattern, leading to more upside potential.
On the daily timeframe we actually have a quite interesting situation. You can see that the market is currently crating an inverted head and shoulders and just yesterday and today broke above and retested the neckline, which again is simply previous resistance which is now turned support.
Now from here I do expect further continuation towards the upside, confirming the bullish inverted head and shoulders pattern.
Thank you for watching and I will see you tomorrow!

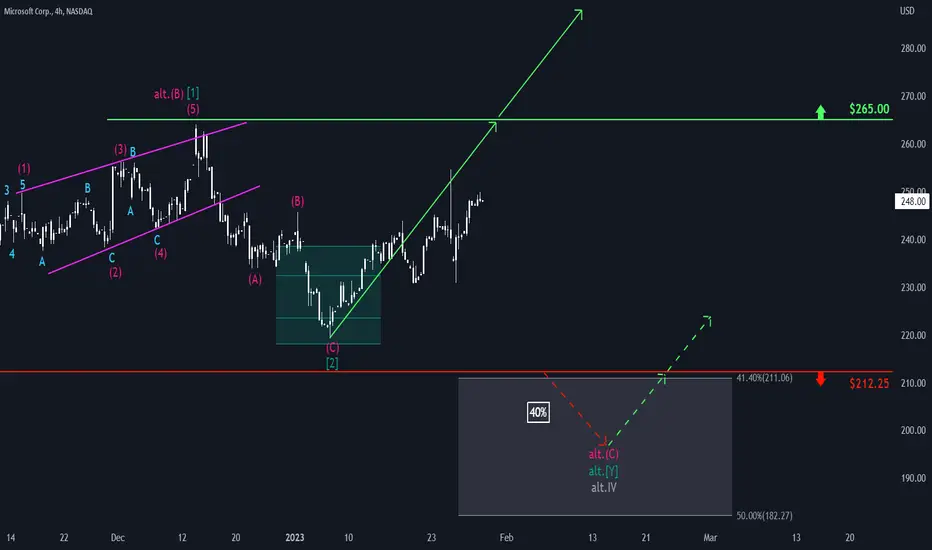
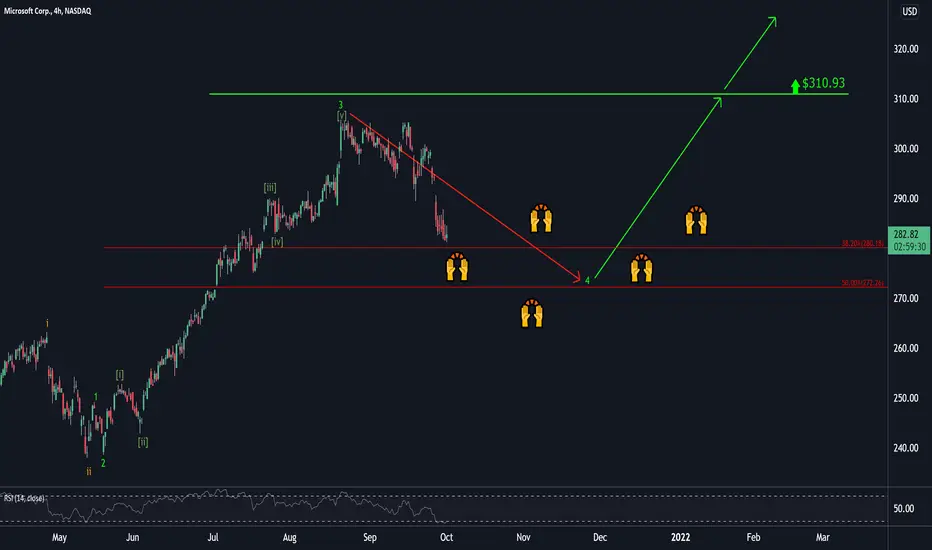
Microsoft: You can do it 💻Despite the recent outage, Microsoft is fighting its way back to the top and should exceed the resistance line at $265.00 soon to continue its upwards slope. Our alternative scenario with a probability of 40% implies that the stock could tire and drop below the support line at $212.25, instead of rising to the top. In this case, the course would sink into the grey target zone to fulfill the superior grey wave alt. IV before heading back North in the longterm.
Microsoft Analysis 01.12.2022Hello Traders,
welcome to this free and educational analysis.
I am going to explain where I think this asset is going to go over the next few days and weeks and where I would look for trading opportunities.
If you have any questions or suggestions which asset I should analyse tomorrow, please leave a comment below.
I will personally reply to every single comment!
If you enjoyed this analysis, I would definitely appreciate it, if you smash that like button and maybe consider following my channel.
Thank you for watching and I will see you tomorrow!

Microsoft Analysis 23.11.2022Hello Traders,
welcome to this free and educational analysis.
I am going to explain where I think this asset is going to go over the next few days and weeks and where I would look for trading opportunities.
If you have any questions or suggestions which asset I should analyse tomorrow, please leave a comment below.
I will personally reply to every single comment!
If you enjoyed this analysis, I would definitely appreciate it, if you smash that like button and maybe consider following my channel.
Thank you for watching and I will see you tomorrow!

MSFT Microsoft Corporation Technical ReboundIf you haven`t sold MSFT after they Issued the Warning to Investors:
Then you should know that the chart reached our price target perfectly and is now ready for a technical rebound.
A technical rebound refers to a recovery from a prior period of losses when technical signals indicate that the move was oversold.
In this case, the Relative Strength Index momentum indicator of MSFT Microsoft Corporation is at 24.30.
Even though i am overall bearish on the economy, buying a strong financial instrument when the RSI is below 30, would make a case for a potential short term reversal.
Looking forward to read your opinion about it.

Microsoft Stock Analysis. Biggest sell-off in history happeningMicrosoft Stock Analysis. The biggest sell-off in history has been happening since the end of 2021. Long-term shorts are playing out on Microsoft stock.
New supply levels are being created on the weekly timeframe; the last one is located at $256 per share. Microsoft's stock price today is still bearish. The stock might take some time to pull back to the supply imbalance shown in the Microsoft stock video analysis and prediction.
The expectations for the IT giant are very negative, regardless of any positive news, earnings, or new products and acquisitions. MSFT stock price could drop as far down as $65 in the following months. You can use bearish stock option strategies to take advantage of the sell-off in Microsoft stock.
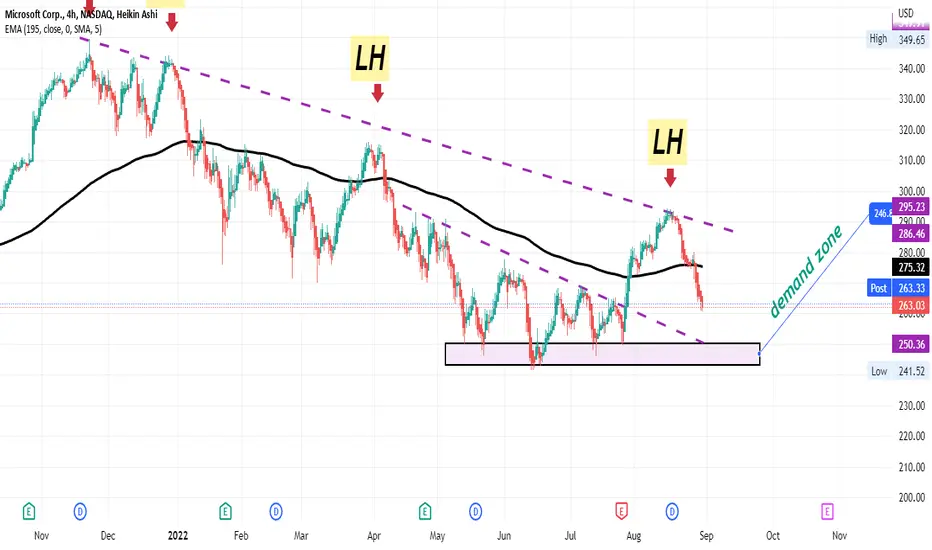
MICROSOFT CORP.Ascending to the strongest bounced peak from which descending peaks were formed to the end of the strong demand area and upon arrival wool is determined the target precisely
Microsoft pulling back?Microsoft
Short Term
We look to Buy at 273.34 (stop at 266.24)
Previous resistance at 275.00 now becomes support. Choppy price action seen. We can see no technical reason for a change of trend. We therefore, prefer to fade into the dip with a tight stop in anticipation of a move back higher.
Our profit targets will be 292.57 and 303.00
Resistance: 293.00 / 315.00 / 320.00
Support: 275.00 / 250.00 / 200.00
Disclaimer – Saxo Bank Group. Please be reminded – you alone are responsible for your trading – both gains and losses. There is a very high degree of risk involved in trading. The technical analysis, like any and all indicators, strategies, columns, articles and other features accessible on/though this site (including those from Signal Centre) are for informational purposes only and should not be construed as investment advice by you. Such technical analysis are believed to be obtained from sources believed to be reliable, but not warrant their respective completeness or accuracy, or warrant any results from the use of the information. Your use of the technical analysis, as would also your use of any and all mentioned indicators, strategies, columns, articles and all other features, is entirely at your own risk and it is your sole responsibility to evaluate the accuracy, completeness and usefulness (including suitability) of the information. You should assess the risk of any trade with your financial adviser and make your own independent decision(s) regarding any tradable products which may be the subject matter of the technical analysis or any of the said indicators, strategies, columns, articles and all other features.
Please also be reminded that if despite the above, any of the said technical analysis (or any of the said indicators, strategies, columns, articles and other features accessible on/through this site) is found to be advisory or a recommendation; and not merely informational in nature, the same is in any event provided with the intention of being for general circulation and availability only. As such it is not intended to and does not form part of any offer or recommendation directed at you specifically, or have any regard to the investment objectives, financial situation or needs of yourself or any other specific person. Before committing to a trade or investment therefore, please seek advice from a financial or other professional adviser regarding the suitability of the product for you and (where available) read the relevant product offer/description documents, including the risk disclosures. If you do not wish to seek such financial advice, please still exercise your mind and consider carefully whether the product is suitable for you because you alone remain responsible for your trading – both gains and losses.

MSFT beating analysts' expectationsAdj EPS: $2.22 vs $2.19 expected
Revenue: $49.4 billion vs $49 billion expected
Cloud: $19.05 billion vs $18.9 billion expected
Revenues for Azure, its flagship cloud offering, rose 46% from last year.
My price target fo MSFT this year is $307.
Looking forward to read your opinion about it.

Microsoft at Key SupportMicrosoft
Short Term - We look to Buy at 273.03 (stop at 269.68)
Preferred trade is to buy on dips. A higher correction is expected. Previous support located at 280.00. 280.00 continues to hold back the bears. The bias is still for higher levels and we look for any dips to be limited.
Our profit targets will be 302.57 and 309.50
Resistance: 300.00 / 315.00 / 350.00
Support: 280.00 / 260.00 / 250.00
Disclaimer – Saxo Bank Group. Please be reminded – you alone are responsible for your trading – both gains and losses. There is a very high degree of risk involved in trading. The technical analysis, like any and all indicators, strategies, columns, articles and other features accessible on/though this site (including those from Signal Centre) are for informational purposes only and should not be construed as investment advice by you. Such technical analysis are believed to be obtained from sources believed to be reliable, but not warrant their respective completeness or accuracy, or warrant any results from the use of the information. Your use of the technical analysis, as would also your use of any and all mentioned indicators, strategies, columns, articles and all other features, is entirely at your own risk and it is your sole responsibility to evaluate the accuracy, completeness and usefulness (including suitability) of the information. You should assess the risk of any trade with your financial adviser and make your own independent decision(s) regarding any tradable products which may be the subject matter of the technical analysis or any of the said indicators, strategies, columns, articles and all other features.
Please also be reminded that if despite the above, any of the said technical analysis (or any of the said indicators, strategies, columns, articles and other features accessible on/through this site) is found to be advisory or a recommendation; and not merely informational in nature, the same is in any event provided with the intention of being for general circulation and availability only. As such it is not intended to and does not form part of any offer or recommendation directed at you specifically, or have any regard to the investment objectives, financial situation or needs of yourself or any other specific person. Before committing to a trade or investment therefore, please seek advice from a financial or other professional adviser regarding the suitability of the product for you and (where available) read the relevant product offer/description documents, including the risk disclosures. If you do not wish to seek such financial advice, please still exercise your mind and consider carefully whether the product is suitable for you because you alone remain responsible for your trading – both gains and losses.

MICROSOFT LONGHi there,
As you can see it is following the channel well. Back in 2020 it dropped then over the next 6 months, it went up 50% more than the previous peak. Since it is at the lower end of the channel and the BULLISH uptrend since 2007, we can expect MICROSOFT to bounce back.
HOWEVER, we shall WAIT for the CLOSURE of the candle when MARKET opens and we SHALL wait further to let it BREATH then enter the trade and let it ROLL for a nice LONG SWING.
Kind regards

Microsoft Analysis 26.01.2022Hello Traders,
welcome to this free and educational analysis.
I am going to explain where I think this asset is going to go over the next few days and weeks and where I would look for trading opportunities.
If you have any questions or suggestions which asset I should analyse tomorrow, please leave a comment below.
I will personally reply to every single comment!
If you enjoyed this analysis, I would definitely appreciate it, if you smash that like button and maybe consider following my channel.
Thank you for watching and I will see you tomorrow!

MSFT Microsoft TrendlineMicrosoft’s buyout of Activision Blizzard for $69 billion would be the largest tech deal of all time.
And Microsoft needs Activision to be a major gaming developer and metaverse competitor.
Microsoft is still in the bullish trendline before the earnings this week.
My price target is $331.
looking forward to read your opinion about it.

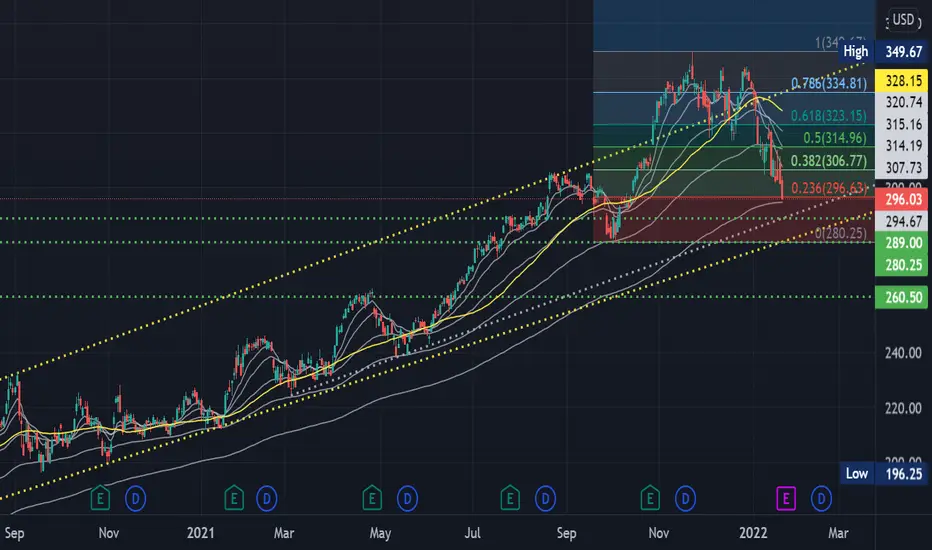
Will the 200 day EMA save Microsoft? Microsoft looks technically interesting. On one hand a double or even triple top argument could be made that flushed the stock down lower after it rallied to break a multi-year resistance TL but failed to hold it, and on the other hand it has not made any multi-month lower lows since September 2020. Stock holders are hoping that 294 will find buyers at the 200 day EMA ahead of earnings but it does not appear that there are any buyers in-sight just yet. 289/290 if reached next week will coincide with March 2021 TL support followed by much bigger support around 280/282 if we get there, where major bounces are expected. The intriguing question will be if buyers are willing show up aggressively under the 200 day to act on these supports because if not, 260 will not be far from reach. Upcoming earnings will determine the longer-term picture.
Is Microsoft in a bubble? Is it overvalued? Judge for yourself.
Microsoft PE Ratio as of January 21: 33.11
PE Ratio Range in the Past 5 Years:
Minimum: 22.35, JUL 03 2017
Maximum: 62.43, MAR 12 2018
Average: 34.68
Median: 32.84
Microsoft Analysis 13.01.2022Hello Traders,
welcome to this free and educational analysis.
I am going to explain where I think this asset is going to go over the next few days and weeks and where I would look for trading opportunities.
If you have any questions or suggestions which asset I should analyse tomorrow, please leave a comment below.
I will personally reply to every single comment!
If you enjoyed this analysis, I would definitely appreciate it, if you smash that like button and maybe consider following my channel.
Thank you for watching and I will see you tomorrow!

Microsoft Analysis 20.12.2021Hello Traders,
welcome to this free and educational analysis.
I am going to explain where I think this asset is going to go over the next few days and weeks and where I would look for trading opportunities.
If you have any questions or suggestions which asset I should analyse tomorrow, please leave a comment below.
I will personally reply to every single comment!
If you enjoyed this analysis, I would definitely appreciate it, if you smash that like button and maybe consider following my channel.
Thank you for watching and I will see you tomorrow!

Microsoft | Fundamental Analysis | Must Read...Microsoft's stock price reached an all-time high after the tech behemoth published its first-quarter earnings report last Tuesday. The company's revenue increased 22% year-over-year to $45.3 billion, beating analysts' forecasts by $1.3 billion. Adjusted earnings surged 25% to $2.27 per share, $0.19 above expectations.
For the second quarter, Microsoft management expects revenue growth of 16% to 18% year-over-year, which also beat analysts' expectations of 14%.
Microsoft's performance is majestic, but some investors may not crave to buy its stock after its price has already risen almost 50% in 2021. Let's look at a few reasons to buy Microsoft stock, as well as one argument for selling it, to see if it is still an attractive investment at these prices.
First and foremost, of course, is the growth of Microsoft Cloud Computing.
Microsoft's dramatic growth over the past seven years has been booste by the expansion of its cloud services, particularly Azure, Office 365, Dynamics, LinkedIn, and other cloud software. The business records the performance of these businesses together as "Microsoft Cloud."
In the first quarter, Microsoft Cloud's revenue grew 36% year over year to $20.7 billion, matching the 36% growth rate in the fourth quarter.
Revenue from Azure, the most thoroughly supervised segment of Microsoft Cloud, grew 48% on a constant currency basis. That represents an acceleration from Azure's 45% growth on a constant currency basis in the fourth quarter and should allay fears of a possible slowdown.
Azure's share of the global cloud infrastructure market also grew from 19% to 21% between the third quarters of 2020 and 2021, according to Canalys. That puts it in second place behind Amazon Web Services (AWS), whose year-over-year market share was unchanged at 32%.
Microsoft probably could not have achieved this growth without Satya Nadella, who took over as third CEO in 2014 and aggressively expanded these services with his mantra "mobile first, cloud first."
Second, we should not forget the recovery of favorable trends.
Over the past few years, Microsoft has become a fast-growth company again, but it continues to return tens of billions of dollars to its investors.
During the pandemic, several Microsoft enterprise services, including Office 365 Commercial, Dynamics 365, and LinkedIn Marketing Solutions, were disrupted as businesses closed.
However, as businesses resumed operations, those factors eased. In the first quarter, Office 365 and Dynamics 365 provided an acceleration in growth on a constant currency basis, and LinkedIn Marketing continued to grow.
The growth of these "resurgent" segments, along with the continued growth of Azure and other cloud services, is offsetting the slowdown in Microsoft's Surface and Xbox units, which suffered from chip shortages and other supply chains constraints in the first quarter.
Finally, it's returning a lot of cash to shareholders.
In the fiscal year 2021, Microsoft spent more than $39 billion on dividends and stock buybacks, accounting for about 70% of free cash flow (FCF). The company will spend another $10.9 billion, or 58% of FCF, on both activities in the first quarter of 2022.
Microsoft's forward dividend yield of 0.8% won't drag serious investors, but the company has reduced its stock by nearly 10% over the past seven years, offsetting the dilution from stock-based compensation plans.
Still, there is one single reason to sell Microsoft: its valuation.
Today Microsoft is worth $2.4 trillion, about eight times its market value of $300 billion when Satya Nadella became its CEO.
The company's stock currently trades at 13 times this year's sales forecast and 35 times its earnings forecast. Those estimates are slightly overstated compared to analysts' expectations for sales growth of 14% and earnings growth of 9% this year.
Massive market capitalization and high valuations could make it tough for Microsoft to repeat its multiple growth over the past seven years.
Microsoft stock is priced very high, but bears have been sounding the alarm about th is for years while the company's stock has been soaring. Still, most would agree that Microsoft deserves such a high valuation because it is still a perfect long-term investment that will continue to profit from the expanding cloud services market.

Microsoft: It ain’t over! 🙌🙌🙌In our current analysis of the Microsoft stock, we have identified a turnaround area around $272.26. After reaching a low there, the stock should soar to new heights around $330.
Happy weekend!
MICROSOFT Daily TIMEFRAMESNIPER STRATEGY
This magical strategy works like a clock on almost any charts
Although I have to say it can’t predict pullbacks, so I do not suggest this strategy for leverage trading.
It will not give you the whole wave like any other strategy out there but it will give you huge part of the wave.
The best timeframe for this strategy is Daily, Weekly and Monthly however it can work any timeframe above three minutes.
Start believing in this strategy because it will reward believers with huge profit.
There is a lot more about this strategy.
It can predict and also it can give you almost exact buy or sell time on the spot.
I am developing it even more so stay tuned and start to follow me for more signals and forecasts.

$MSFT Healthy Pullback? Cyclical Movement Video update and breakdown on $MSFT
Holding that 285 level after earnings well.

MSTF 1H What Can Stop Microsoft's grow Supercycle?Today, we will look at the behavior of the share price of Microsoft Corporation on a global chart.
Patient investors have been gaining the position of Msft shares for 13 long years, and the price itself during this period was stuck in the consolidation of $20-37
However, look at the result: as of now, the share price has risen +1000% , and the super cycle of growth itself has been going on for 8 years.
Moreover, during this long super cycle of growth, there have not yet been significant corrections. The recent news that the Pentagon is breaking a $10 billion contract with Microsoft shook the share price down 1%, but the next day, Msft's share price updated its all-time high.
Even during the Covid market drop in February-March 2020, Msft shares fell by only -30% and left the price within the parabolic rally. For example, then the S&P500 fell by -35%, the DJI index -38%, and for example, the hypes TSLA shares by as much as -60%
By the way, yesterday we made an idea for TESLA, we invite you to view:
For ourselves, we set the bar for the growth of Msft shares to $349-350 , from where a long correction may begin. Of course, against the backdrop of such a powerful growth, it is hard to believe in such a deep correction, but it would be nice to test the strength of the top level of $60 per share for Microsoft
An alternative scenario is a breakout and consolidation of the price above $350 , then nothing will prevent the price from moving further with parabolic growth, and the zone of $825-880 per share of MicrosoftCorporation will wait from above

$MSFT Looking For Support VIDEO UPDATEVideo update on $MSFT After we have a lower time frame support break of the ascending wedge.
More details within!
