DODODODO doesn´t look bad. RRR more than 6.
Range is consolidating few months. Good oportunity to buy.
SL under the green zone wicks.
TP amazing... (you can take some on the way up)
Midterm


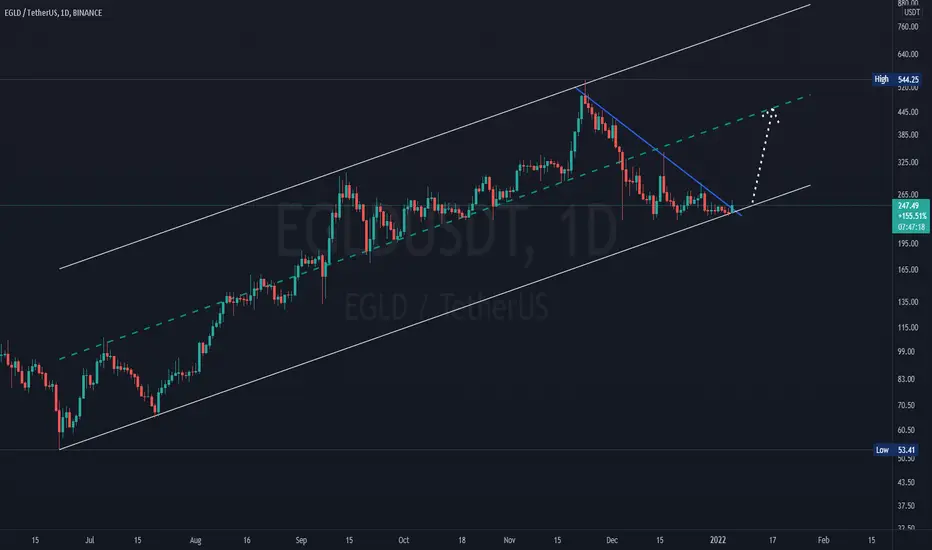
We hold #EGLD Here.As we stay inside the channel, and we broke the trendline we are holding some EGLD in the pocket.
Targets Massive: 285 - 325 - 375 - 500
Stop loss if market go crazy and close daily below $200
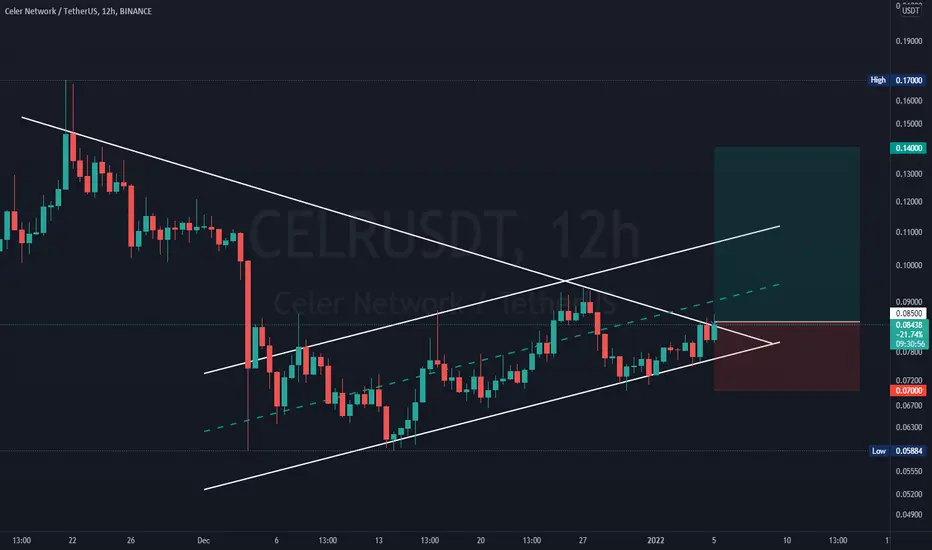
CELR Long HereFollowing Rising Channel
Buy Between: 0.078 - 0.085
Targets: 0.093 - 0.105 - 0.120 - 0.140
Stop Loss: 0.07
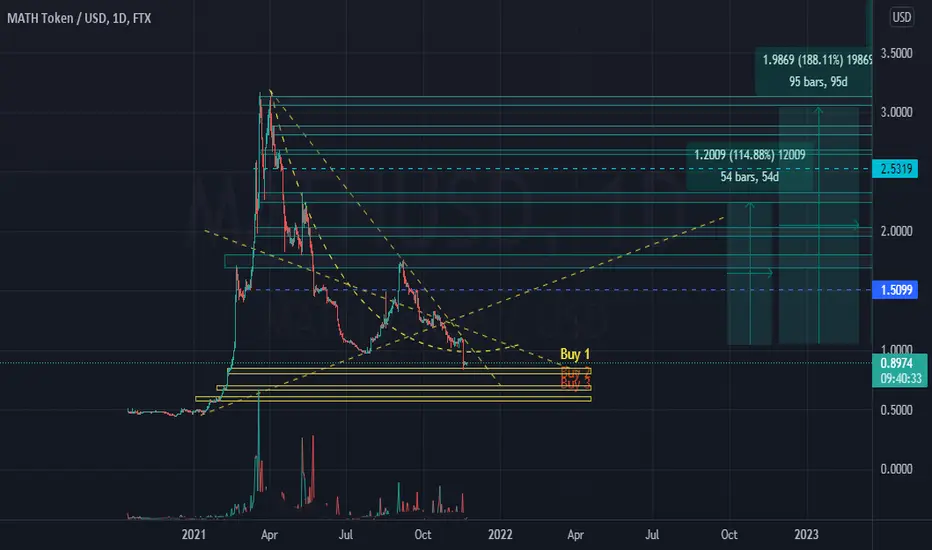
Rising wedge forming on Matic ? We have little data available, despite this the weekly chart offers us a rising wedge with a negative breakout around January / February .
Major support around 0.61 Fibonacci from the first run at $ 1.13
Moment around which according to my latest analysis on BTC it too should touch its major support before continuing with a large positive rebound .

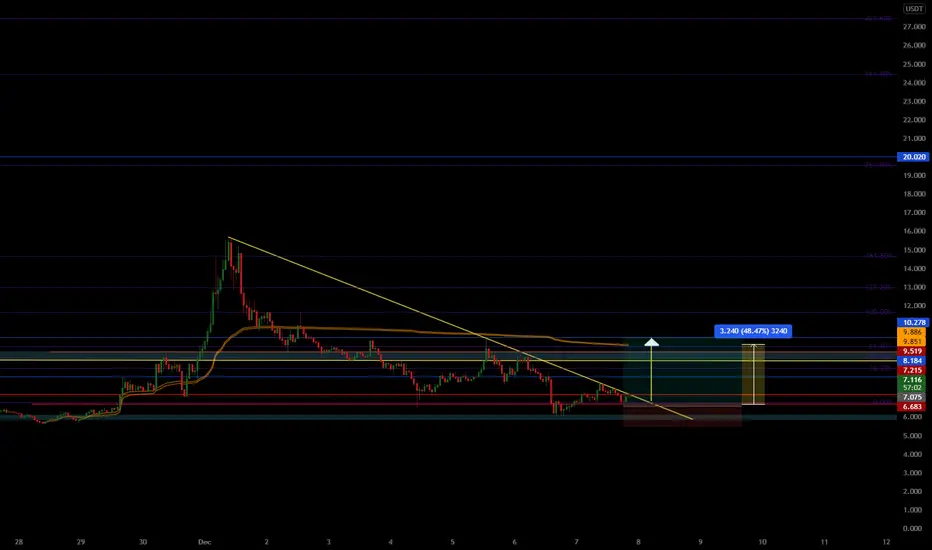
MBOX/USDTbuy zone at after break out stop loss will be below 5.7$
sell target = 9
target # 2 = 9.5
target #3 = 10.3 almost 50% profit
plz like my idea becoz
May very happy when you like my idea.
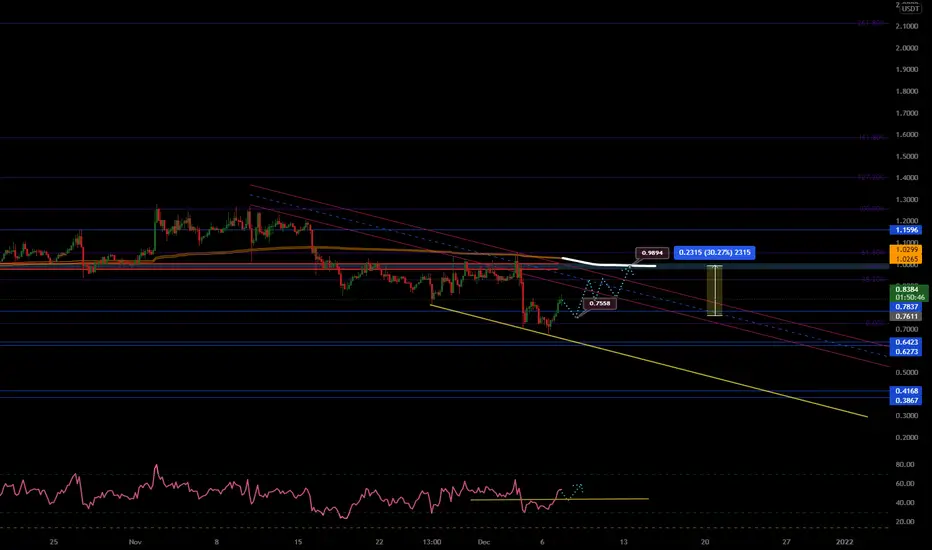
ALPHA/USDT / BINANCE / TECHNICAL ANALYSIStomorrow is the event of alpha usdt
so i will share our analysis with u
buy/sell
buy alpha at 0.75
sell target = 0.98 almost 30% profit
our only 1 request with u are u satisfy with my idea soo don't forgot to like
becoz i am much happy after gaining likes :)
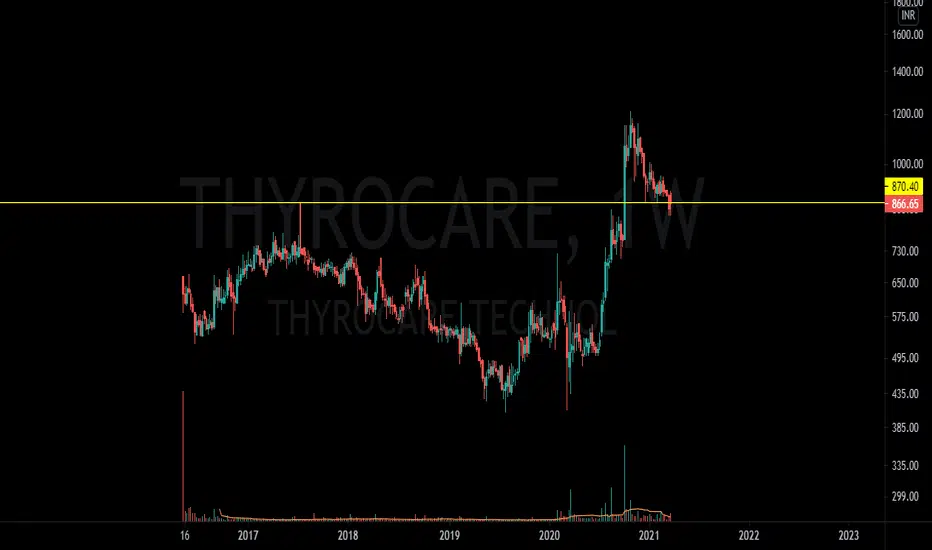
Thyrocare: Buy If Closes & Holds 910 levels ahead [CMP 866.65]Another chart for study the price action;
Thyrocare: Buy Above 910 levels for Mid-Long term : CMP 866.65
TGT 1 = 1010,
TGT 2 = 1200,
ROI 1 = 11%
ROI 2 = 32%
Hold with Patience for Greater Reward, To Manage risk - Consult your Financial advisor
BTC/USDTtechnically i can expect btc at 49 to 50k
then 52k
57k is the strong resistance of btc
it is technical resistance of btc
after bad news btc will dump hard
i fell like 40k , 35k , 30 to 31k is the best support of btc
so let see the market whats happen next
:)

MANA/USDTbuy zone at after break out stop loss will be below 4.1$
sell target = 6.3 almost 28% profit
target # 2 = 6.9 almost 38% profit
target #3 = 7.7 almost 60% profit
plz like my idea becoz
May very happy when you like my idea.

ETH midterm gann fansHere is my view on eth with midterm gann:
I´d trade yellow short and green long.
Depending on what we get first.
The target is determined by the respective next gann line.

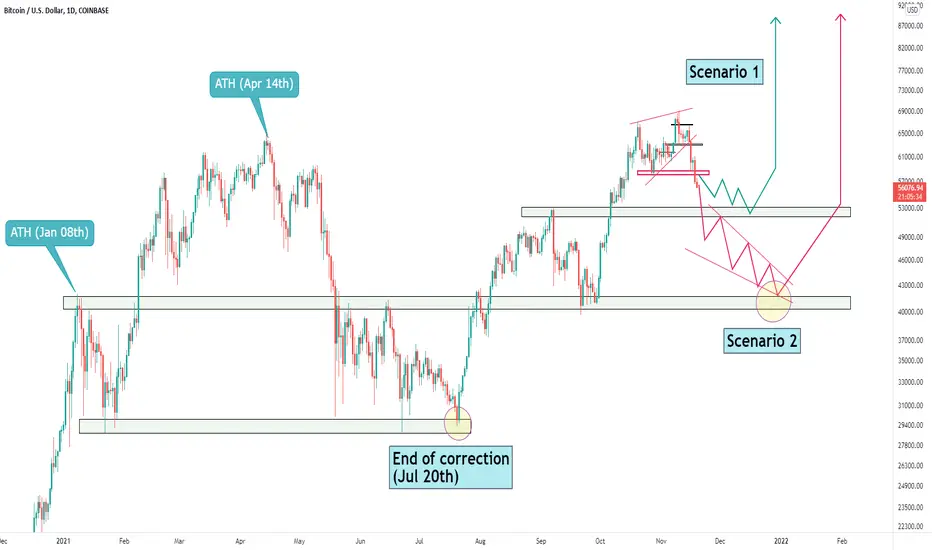
BTCUSD - mid term outlookHello all,
Recently BTCUSD has set a new ATH and now it is trading in a correction.
It has already broken out of the rising wedge like pattern and the short term
structural support. If we take a look at the previous structural ATH (Apr 2021)
then we could forecast the possible endpoint of the correction.
Anyways there are 2 possible scenarios which are illustrated on the graph.
Disclaimer: Any risk related to trading this cryptocurrency is solely on you. Please, think thoroughly before making any trading decision.
EOS/USDTif u satisfy with my analysis plzz donot forgot to like
don't follow our signals its just chek me our analysis i am right or not
if u satisfy with my analysis plzz donot forgot to like
buy at current price = 4.950
sell targets # 1 = 5.400
target # 2 = 5.800

Btcusdt MidtermBtcusdt Midterm
Tp1: 69500
Tp2: 97000
Sl: 39000
Bitcoin breaks the trading range and made a new all-time high. Bitcoin is super bullish now. The accumulation is done and BTC tested the support of $60,000 many times. The next major resistance is $69500. The support for now is $65,000 and $63,500 area. We will see the rally continues in coming days.

ATOM/USDTbuy for long term buy now and hold tight best support = 35$
sell at = 39$ , 45$ , 52$ , 61$
39$ short target ___ 45$ midterm _____ 52$ , 61$ for long

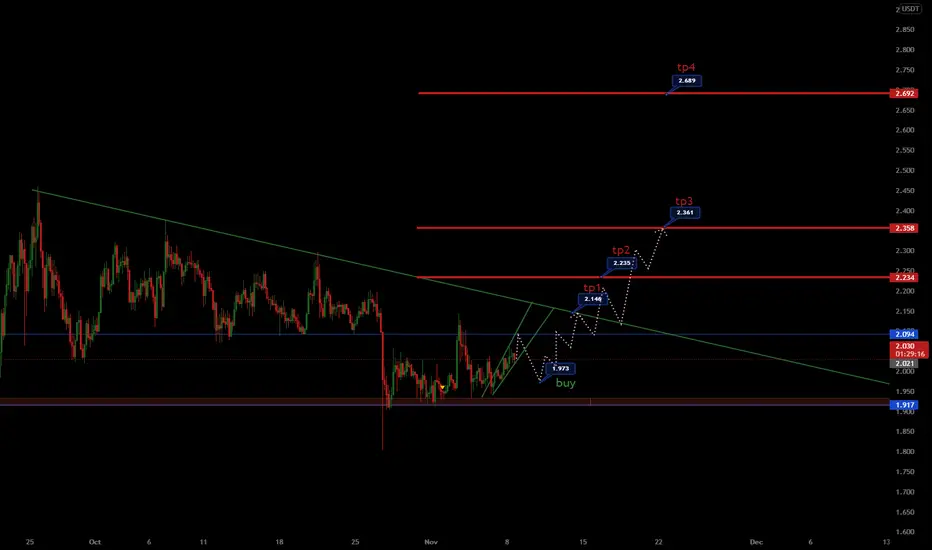
ADA/USDTjust test me our analysis not recommended to enter in this trade
buy zone = 1970
sell at
tp 1 = 2.150
tp 2 = 2.230
tp 3 = 2.350
tp 4 = 2.650
short/mid/long
1inch/USDT1inch soon to the moon ^^^^^^^^
buy now
tps = 5.5 , 5.9 , 6.3 , 7.7 , 8.7 , 9.9
mid or long
for short 4.7 easily touch
if u satisfy with my idea pls don't forgot to like ^ ___ ^
if u satisfy with my idea pls don't forgot to like ^ ___ ^
if u satisfy with my idea pls don't forgot to like ^ ___ ^

KCS/USDT 1hr SETUP - Poss Bullish Retest & S/R Flip!Chart is pretty self explanatory.
KCS is in a macro ascending triangle pattern and broke above the 200 SMA on the 1hr-- the 200 on the 4hr acted as resistance, and now it's retesting a very significant Support/Resistance level. If it can hold this level, expect upside.
This is an aggressive buy at the bottom of a macro pattern. Higher risk, higher reward - potentially a strong mid term hold (assuming bull rally continues).
Kucoin has been getting a lot more attention recently, especially in the US, as Binance is now requiring KYS for all users (effectively banning all users in restricted countries who had been getting by with a VPN).
Kucoin is the only good exchange that offers margin trading and a lot of small cap alts (and XRP lol) to the US market.
My trading group has been posting a lot more Kucoin setups in recent weeks/months, and with these insane small cap pumps, I expect more S-coin traders to get involved too. So I'm bullish on Kucoin as a mid term hold.
happy trades,
CD

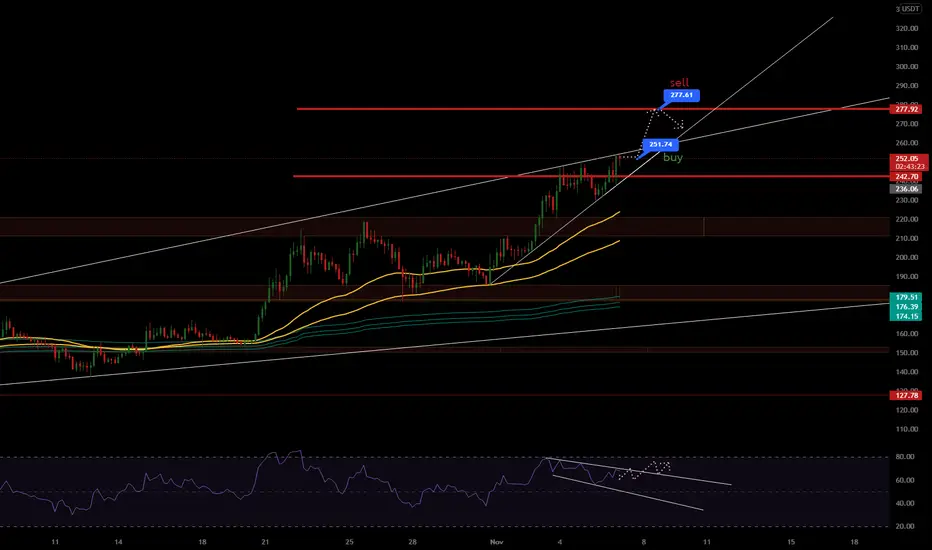
SOL/USDTbuy at = 251
sell at = 277
if u happy with my idea pls like our idea my sweet followers
^__=__^
LONG BAND DOUBLE BOTTOM MID TERM + TPsLooks nice after retest, BTC pair just broke a 145 days triangle. I will keep u updated guys so dont forget to drop a follow. ;)

elliot wave for uniusdtHello every one
I think that path of uniusdt will be according to this analyse

