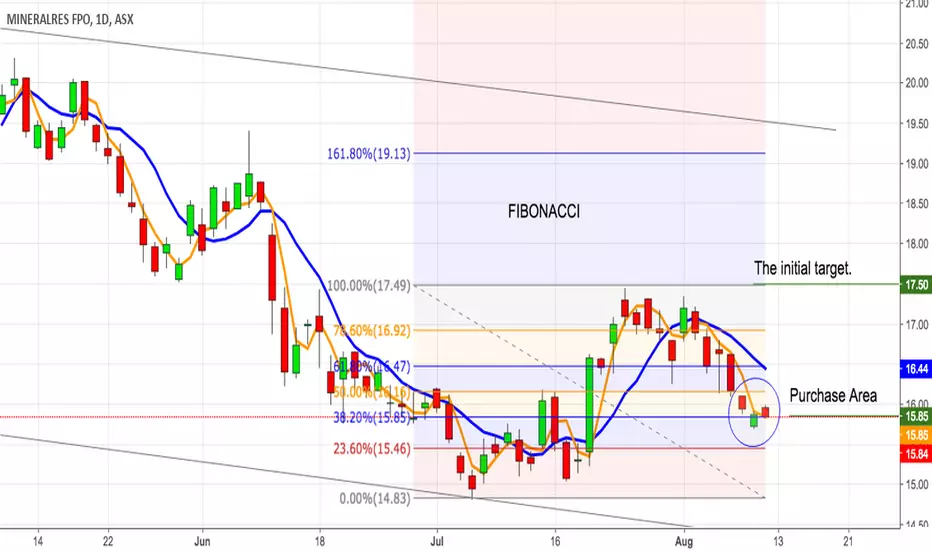
MIN MINERALRES FPO -> On FIBONACCIIf will be confirmed the end of L2 line from Fibonacci, then will start (today or tomorrow) the L3 line, which means that the asset must exceed $ 17.50 as the initial target.
Miners
LONG [AUDUSD] BUY SUPPORT BREAKOUTPotential BOTTOM on chart. If the pair will manages to Hold support, take long position on closing bar with stop below the low. The main trend is still bearish , so use a small (speculative) size, but at the same time, we have a good R/R (<1:3).

Gold Time is nowThe timing on the GOLD chart XAUUSD is certainly right for a major reversal. Could happen any day, when it does, it will be very rewarding. JNUG and NUGT should really run higher.

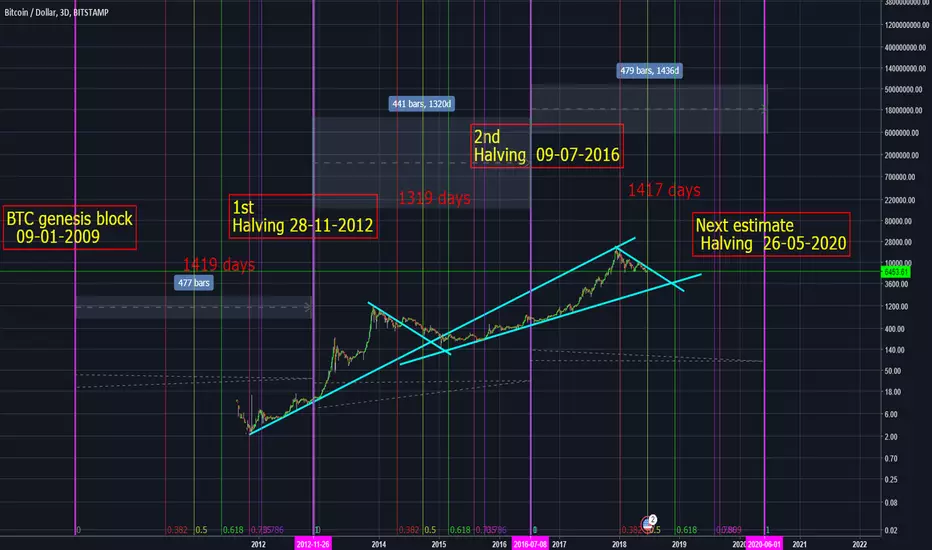
BTC Analysis based on Block frame and halving this is not financial advise just my thought about BTC treatment .
i think its more helpful we check fractal or trend line base on block frame .
since BTC network created we experienced 2 halving .
i showed 2+1 halving time with vertical pink line.
3 period mentioned in chart :
First era - 1419 days from beginning to the first halving (28-11-2012) that include CPU, GPU and FPGA mining
Second era- 1319 days (28-11-2012 to 09-07-2016) in the early of the 2013 we faced to ASIC miners started with 2 TH , 16 nm chip developed in mid 2015
Third era- estimate to be 1417 days ( 09-07-2016 to 26-05-2020 !!!) ( refer to the website www.bitcoinblockhalf.com) 16 nm chip (last ASIC technology) released in 2017-May-31
whenever Bitmain company released new devices we see new rally for example :
a- Gen 1 55 nm chip Nov 2011 price increased
b- Gen 2 28 nm Apr 2014
c- Gen 3 28 nm semi-custom sep 2014
d- Gen 4 28 nm full custom aug 2015 , price increased
e- Antminer s9 16 nm full-custom may 2017 price increased
i expect to see new power full miner devices in next 3 month .
continue ...
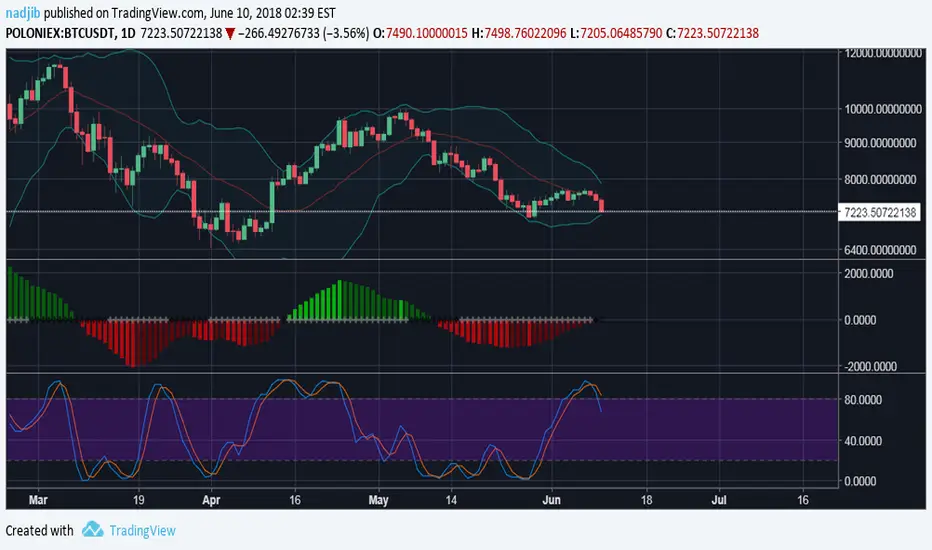
BTC never under 5k and this is why !!!!BTC ECONOMIC BASIC
There are a lot of speculations that bitcoin would go to 3000... well those who tell you that don't have a clue what they are talking about. Bitcoin/altcoins can be compared to stocks/gold/silver etc. Now some of you will be shouting at me that it is not the same but this is just a example.
In this case we take a look at gold. To mine gold you need employees, materials and insurance etc. When you add all those things up you will get a price that you have to earn from selling the gold to at least break even with the costs of mining the gold.
This is the same as bitcoin mining. It takes a lot of energy to mine 1 bitcoin and the equipment is also pricey. The average costs to mine 1 bitcoin is 4700 - 4800 dollar. If bitcoin would drop below this price a lot of miners would shut their systems down. Only the big companies would be able to mine with a small profit. We think whales/major investors would never let this happen. If you see the price dropping beneath this price range... sell every single crypto you have because we are going to shut down!
This is just some basic economics. If it the costs to mine something are higher than the sold product... why should you do it?
AG: From loved to hated to lovedHighly likely that AG has seen the bottom and is now climbing the wall of worry in a choppy way before trend is commencing. Expected path outlined on chart.

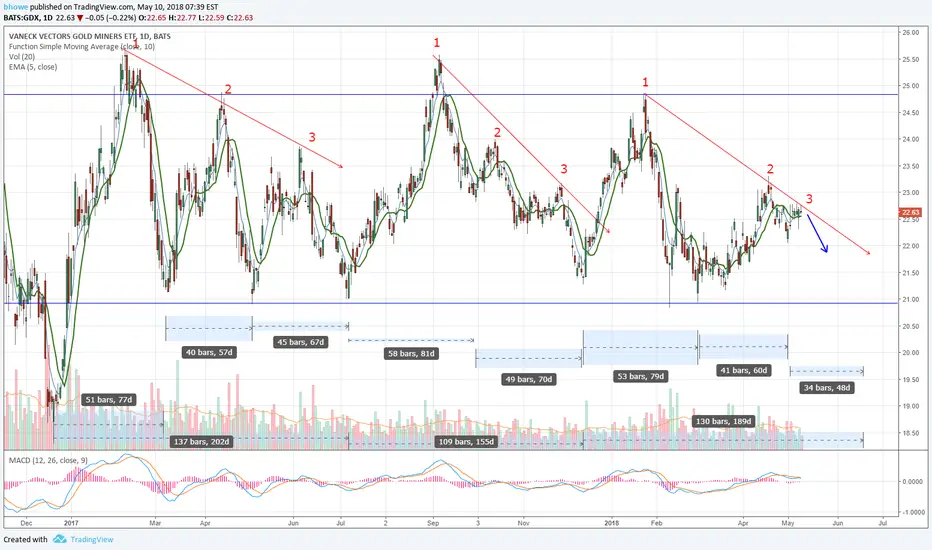
GDX Miners CautionHere's my 2 cents on the miners. Based on the last 7 months or so, it looks like we had 2 cycles and are currently in a 3rd. They range about 109-137 days. In each of these waves you can see three minor waves. If we are currently in the 3rd wave of the 3rd cycle then I would expect it to be LT and drop fairly soon. It shouldn't take out the highs of April unless there is a new trend higher happening? The peaks at "1" have each been lower than the previous, where the lows have all been about the same. I'm really not sure what to make of all this, just sharing...........
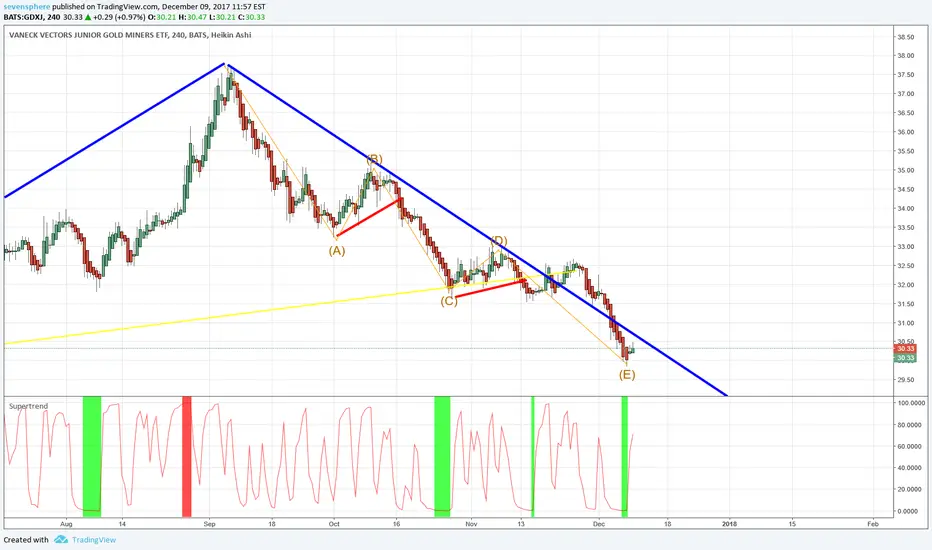
After years, could there be a bulltrend?I have a possible pathway for the Junior Gold Miners, which could turn bullish together with gold of-course and other precious metals. I think if it eventually goes the uptrend, it will hopefully do it continuously like the downtrend...

US sanctions on Rusal send Aluminium prices higherUS sanctions on Rusal send Aluminium prices higher.
Can Aluminium complete the trend reversal and
head into an new uptrend ?
Needs to break 3.802 to really confirm a new trend

US Sanctions on Evraz - putting a big dent in its bull runUS sanctions affecting Evraz share price
today, plus many others e.g. Polymetal.

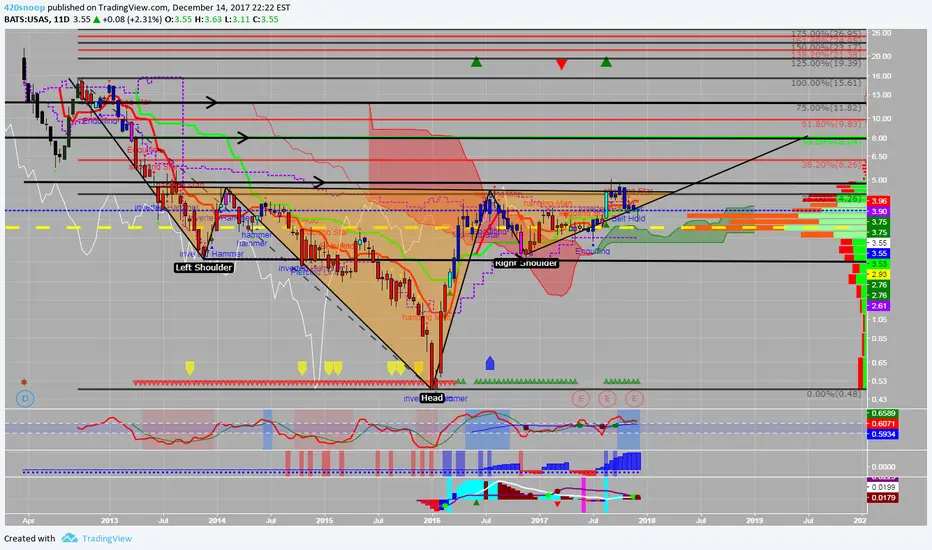
$ilver Technical Analysis: Bulli$h Breakout$ilver is trading inside of a symmetric triangle. These triangles are continuation patterns 75% of the time. The triangle should break higher or lower within the next couple of weeks. In addition, an inverse head and shoulders is also in play. My play on this move is TAHO, BCEKF, FSM and HL. LOCKED AND LOADED BABY. FOMC day is next Wednesday at 2:00pm ET. This decision could decided which way $ilver will breakout. I am BULLI$H.
Here is information on symmetric triangles and inverse head and shoulder patterns:
Symmetric triangle: stockcharts.com
Inverse head and shoulder:https://www.investopedia.com/…/i/inverseheadandshoulders.asp

Miners/Metals Liftoff (Wave 3)Metals/Miners Liftoff (Wave 3) : This chart is a bit complicated for some, but it clearly shows the pricing pressure that is building for a massive price move in the Metals/Miners sector. I've been considering the move and what would likely be the catalyst for any explosive upside rally in this sector and I believe it will be related to global concerns with Debt and Real Estate. IMO, right now is the perfect opportunity to prepare for this upside move. I believe this is still Wave A of Wave 3 to the upside. In other words, the upside potential is actually 20~60% for this first Wave A leg or more).

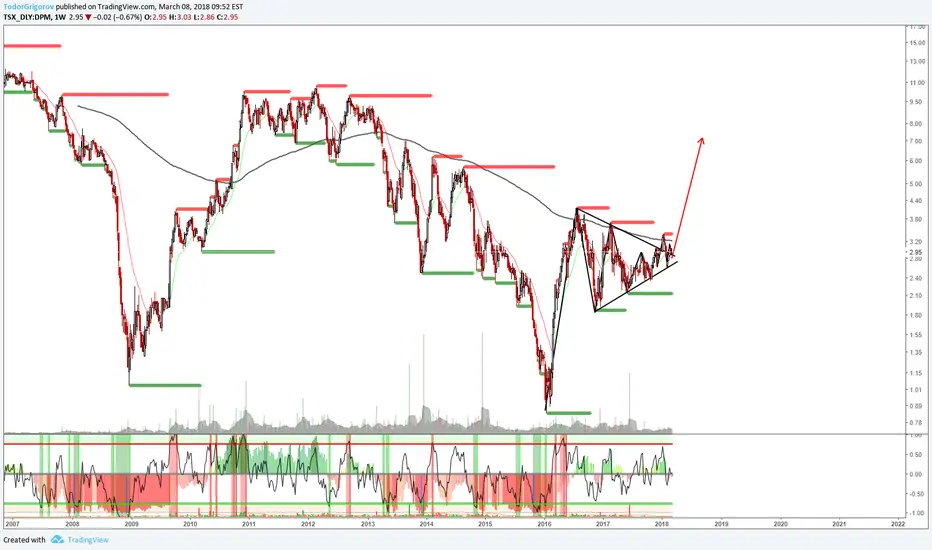
Dundee Precious Metals LONGDPM Canadian gold mining company mining in Bulgaria. 68% increased output and by recent research there is much more concentrated gold,silver etc... in the ground. Look at Financial Statements Debts have been decreasing for a while. Price of GOLD is going up so the mined gold reserves could be sold for a good price and FCFF will rise sharply. Very bullish on that company. Technical analysis tells the same story. Since the last 2Q price went up from 2$ - 3$. I am expecting further appreciation of that stock. Recently broke above pattern and the way up seems to be clear. GOOD LUCK
GDX Long IdeaWell here we go again. GDX is at the lower side of the trading box. A buy here with a stop directly below should produce a good risk reward trade. It won't be a straight line higher, but could reach the top of the box eventually.

THE MINERS ARE PREDICTING A BIG BULL RUN IN PRECIOUS METAL. The pattern is clear. Like the previous falling wedge happened at the end of 2015, we are approaching a similar structure. It is just a matter of time. I am optimistic. Dollar will collapse.

SILVER PRICE FORECAST AND THE BREAKOUT ZONE. Break-out will happen when EUR/USD will clean up the 1.26 zone, at the same time DXY will fall again. Is just a matter of time. The entire dollar picture is deteriorating.
The dollar will confirm a multi year decline when this will happen. Gold & Silver stocks are supposed to be the best investment for long term gains.

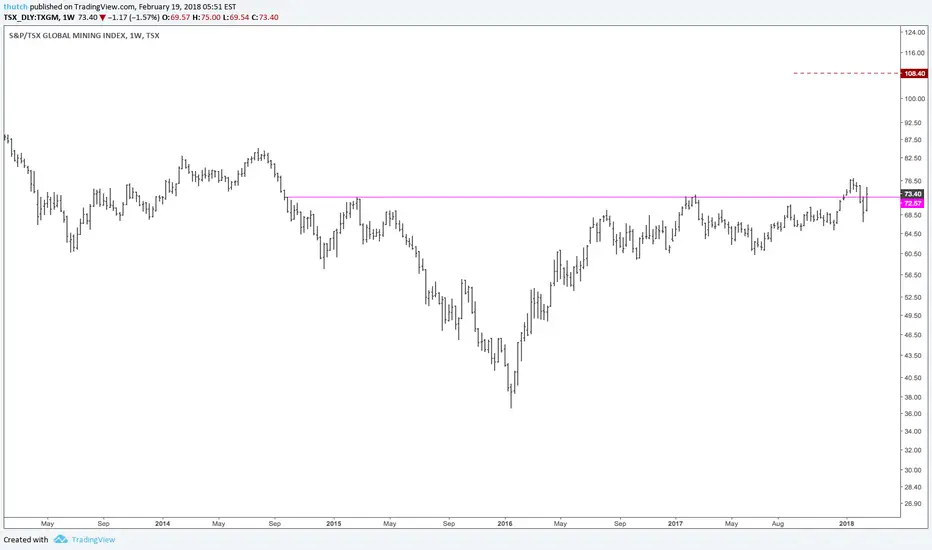
Major breakout with inverted head & shoulders bottomThe mining sector has been through the ringer for 5+ years.
3-year inverted H&S bottom has completed. Including a hard retest the last 2 weeks.
Target around 108

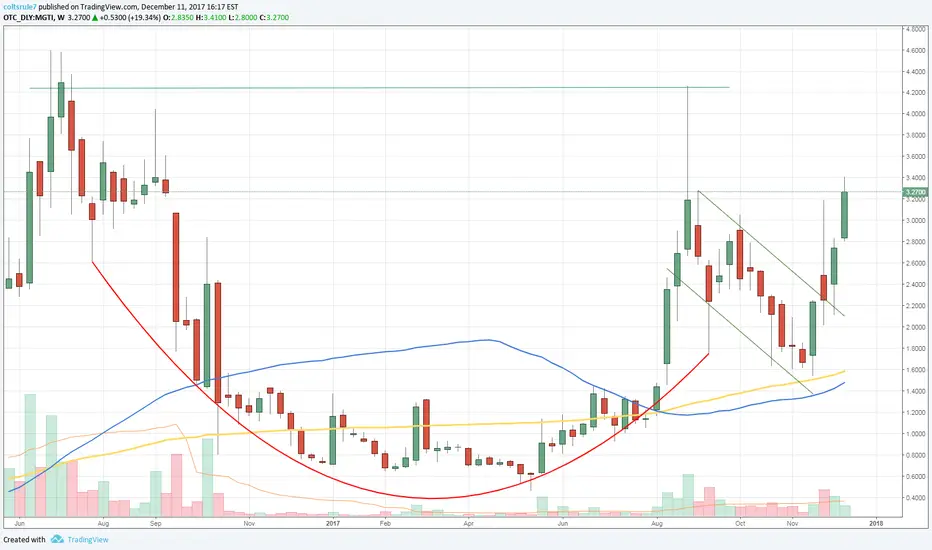
MGTI Cup and handle on the weekly chart!If you are one of the many who are looking at the stock price for the largest US Bitcoin mining company and are afraid that after todays 20% move that you missed out. Think again. MGTI is in a weekly cup and handle pattern meaning that a strong bullish move is just beginning. A price target into the mid 4s and higher is not unlikely.
Commercial bank covering their shortFinally a buy opportunity that fit the fifth wave.
Trade at your own risk!
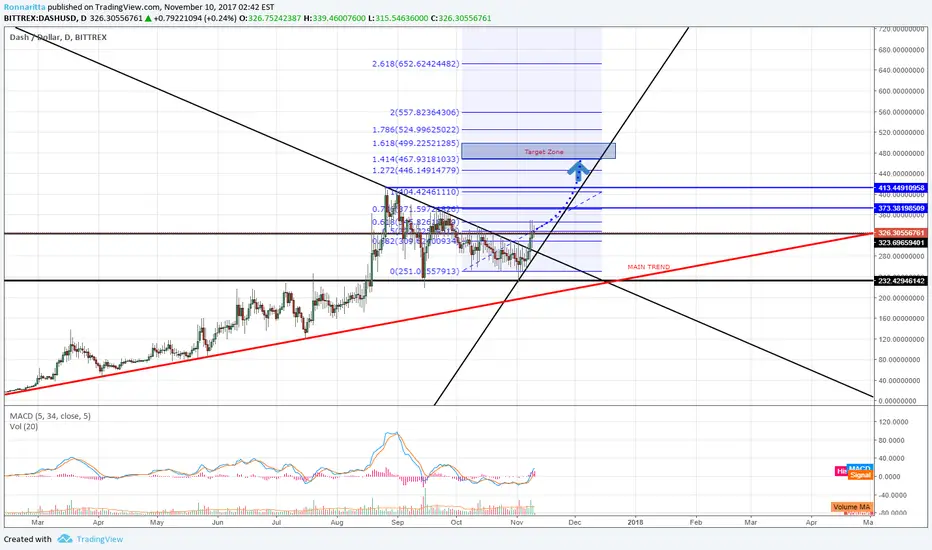
DASH(ing) to $500? LONGDASH Buy: Target pice 470-500
Stop lost: 280
Resistance, 373, 413
For fast trader you can lock out your position if the price falls below the recent uptrend line.
I go for LONG in dash with $500 target. We are talking about longer trades here,an investment even, maybe towards the new year. The MACD rises above and the price stands on longer term EMA.
Base on smaller time frame chart in 4H the coin can retrace to 280 areas again to test the break out and that too should be our stop if it doesnt hold.
We see similar break out triangle pattern in some of the coins in the ALT coin market. This is one of the pattern that I look for.
The coin had break out of the downtrend line in daily chart. The previous high can be trace back to the 400 areas.
Note: There are miners out their servicing the crypto world, asics and gpus. This is one coin that can be mine with the X11 algorithm asic miners. I understand that the ROI of the new miners have been extended with massive increase in difficulties. So I hope this post can benefit both miners and traders.
Best of luck, please feel free to comment, I am open to constructive discussion :)