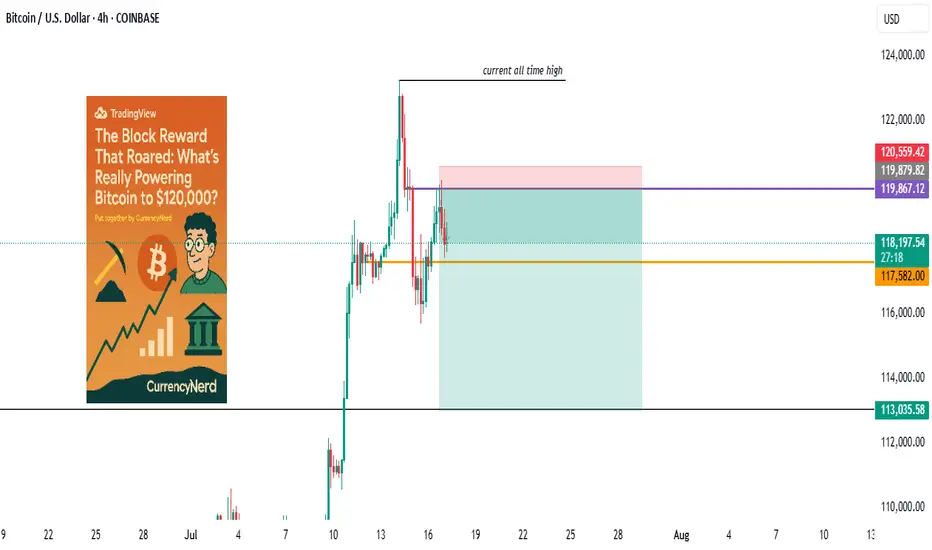
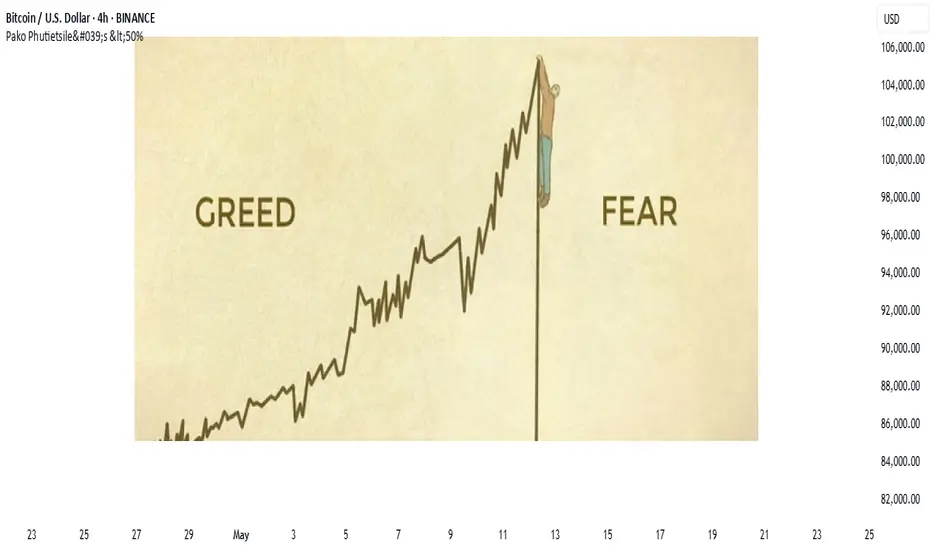
wall Street has set camp on Satoshi's backyard...Bitcoin didn’t just wake up and choose violence. It chose velocity.
As BTC blasts through the six-figure ceiling and fiddles $120k with laser precision, everyone’s pointing to “the halving” like it’s some magical switch. But let's be real, Bitcoin bull runs don’t run on fairy dust and hope. They run on liquidity, macro dislocations, structural demand shifts, and a pinch of regulatory chaos.
Here’s the nerdy breakdown of what’s really driving the Bitcoin Rocketship (and why this one’s different):
1. The Halving Effect (Not Just the Halving)
Yes, the April 2024 halving slashed miner rewards from 6.25 to 3.125 BTC. But this time, the reflexivity is louder. Miners now have to sell less, and buyers (especially ETFs) have to beg for more.
Miners = Reduced Sell Pressure.
ETFs = Constant Buy Pressure.
That’s a one-way order book squeeze. Simple math, but powerful dynamics.
2. ETF Flows: The "Spot" That Launched a Thousand Rallies
When the SEC finally gave the green light to Bitcoin spot ETFs, TradFi didn’t walk in—they stormed in.
Think BlackRock, Fidelity, and friends becoming daily buyers. It's not retail FOMO anymore, it's Wall Street with billions in dry powder doing dollar-cost averaging with institutional consistency.
🧠 Nerd Note: The top 5 U.S. spot ETFs alone are now hoarding more BTC than MicroStrategy.
3. Dollar Liquidity is Leaking Again
Despite Fed jawboning, real rates are still under pressure and global liquidity is quietly creeping back. Look at the TGA drawdowns, reverse repo usage, and China’s stealth QE.
Bitcoin, being the apex predator of liquidity, smells it from a mile away.
“In a world flooded with fiat, Bitcoin doesn’t float. It flies.”
4. Sovereigns Are Quietly Watching
El Salvador lit the match. Now, Argentina, Turkey, and even Gulf countries are tiptoeing toward a Bitcoin pivot, hedging USD exposure without broadcasting it to CNN.
Central banks don’t need to love BTC to stack it. They just need to fear the dollar system enough.
5. Scarcity Narrative Goes 3D
With 99% of BTC supply already mined and over 70% HODLed for over 6 months, every new buyer is bidding for a smaller slice of the pie. ETFs and institutions are trying to drink from a faucet that only drips.
This is not a market with elastic supply. This is financial physics with a scarcity twist.
6. Market Microstructure is Fragile AF
Order books are thin. Real liquidity is fragmented. And the sell-side has PTSD from getting blown out at $70k.
This creates a “skateboard-on-a-freeway” scenario, when a few billion in inflows hit, prices don’t just rise. They gap.
Nerdy Bonus: The Memecoin Effect (No, Really)
The memecoin mania on Solana, Base, and Ethereum has been injecting dopamine into degens—and their profits are increasingly flowing into the OG digital gold.
It’s the 2021 cycle all over again, just with more liquidity bridges and fewer inhibitions.
Nerdy Insight: The Bull Run Has Layers
What’s driving BTC to $120,000 isn’t a single headline. It’s a stacked convergence of macro, structure, psychology, and coded scarcity.
Bitcoin isn’t “going up” just because of hope or halving hype. It’s going up because it’s the cleanest asset in a dirty system, and now both retail and institutions agree.
Still shorting? That’s not “fading the crowd.” That’s fighting thermodynamics.
Stay nerdy, stay sharp.
put together by : @currencynerd as Pako Phutietsile
Mirko_atlega
watch the laws, not just the charts.stablecoins were once the rebels of finance—anchored to fiat yet untethered from traditional banking laws, but the tides are turning. Across major economies, lawmakers are drawing up legal frameworks that place stablecoins inside the banking sector rather than outside of it. This shift could be the most pivotal regulatory development since Bitcoin was born.
But what does this really mean for traders, investors, and markets?
In this @TradingView blog we’ll unpack the new laws on stablecoins entering the banking realm, and what their ripple effect might look like, using past regulatory shifts as a lens to foresee market behavior.
🧾 Section 1: What the New Stablecoin Laws Say
Many regions—especially the EU, UK, Japan, and the US—are moving toward a model where stablecoin issuers must register as banks or hold full banking licenses, or at minimum, comply with banking-like oversight.
Key pillars of these laws include:
Full reserve requirements (1:1 backing in liquid assets)
Audited transparency on reserves and redemptions
KYC/AML compliance for users and issuers
Supervision by central banks or financial regulators
In the US, the House Financial Services Committee recently advanced a bill that would make the Fed the ultimate overseer of dollar-backed stablecoins.
In the EU, MiCA (Markets in Crypto-Assets) requires issuers of e-money tokens to be regulated financial institutions.
Japan now allows banks and trust companies to issue stablecoins under strict regulations.
💥 Section 2: Why This Is a Big Deal
Bringing stablecoins into the banking system could change how liquidity flows, how DeFi operates, and how capital moves across borders.
Potential market impacts:
Increased trust = more institutional money entering stablecoins and crypto markets.
DeFi restrictions = protocols may face scrutiny if they allow unverified stablecoin usage.
Flight from algorithmic or offshore stables to regulated, bank-issued stablecoins (e.g., USDC, PYUSD).
On-chain surveillance increases, potentially limiting pseudonymous finance.
Think of it as crypto’s "Too Big To Ignore" moment—where stablecoins become infrastructure, not outlaws.
📉 Section 3: Past Laws That Shaped Crypto Markets
Let’s examine how previous regulations have affected crypto markets—offering clues about what to expect.
🧱 1. China’s Crypto Ban (2017–2021)
Kicked off a massive market crash in 2018.
Pushed mining and trading activity overseas, especially to the US and Southeast Asia.
Resulted in more global decentralization, ironically strengthening Bitcoin’s resilience.
🪙 2. SEC Lawsuits Against XRP & ICO Projects
Ripple’s XRP lawsuit caused delistings and volatility.
Set a precedent for how tokens are treated under securities law.
Resulted in more structured token launches (via SAFEs, Reg D, etc.).
🧮 3. MiCA Regulation in Europe (2023 Onward)
Provided regulatory clarity, prompting institutions to engage more with regulated entities.
Boosted legitimacy of Euro-backed stablecoins like EURS and Circle’s Euro Coin.
Sparked a race among exchanges to gain EU registration (e.g., Binance France, Coinbase Ireland).
Each of these regulatory waves caused temporary volatility, followed by long-term growth—as clarity invited capital.
📊 Section 4: The Possible Scenarios for the Market
Here’s how things might play out as stablecoin laws become mainstream:
Golden Path-Regulated stablecoins coexist with DeFi; innovation meets compliance - Bullish for crypto adoption and capital inflows.
Walled Garden-Only bank-issued stablecoins are allowed; DeFi stifled -Neutral or bearish short-term, bullish long-term.
Backlash-Overregulation pushes stables offshore or into non-compliant zones - Bearish, liquidity fragmentation returns.
🔍 Nerdy Conclusion:
Stablecoins are no longer just tools for traders—they’re becoming the backbone of digital finance. Their formal entrance into banking law marks a turning point that traders must understand.
While regulation has historically caused short-term fear, it often leads to long-term maturity in crypto markets. The stablecoin laws now in motion could unlock the next chapter of institutional adoption, cross-border finance, and perhaps, the integration of crypto into the real-world economy at scale.
💡 Nerdy Thought:
When a technology becomes systemically important, it stops being ignored—it gets integrated. Stablecoins have reached that level.
put together by : @currencynerd as Pako Phutietsile
Price action is the vehicle—but these charts show the road aheadIn the world of trading, technical analysis often gets the spotlight—candlesticks, moving averages, and indicators. But beneath every price movement lies a deeper current: macroeconomic forces. These forces shape the environment in which all trades happen.
Great traders don’t just react to price—they understand the context behind it. That context is found in macro charts: the financial “weather maps” of markets. These charts reveal whether capital is flowing toward risk or safety, whether inflation is heating up or cooling down, and whether liquidity is expanding or shrinking.
In this post, we’ll explore 10 macro charts that can elevate your edge, backed by proven examples of how they’ve helped traders stay on the right side of the market. These aren't just charts—they’re market truths in visual form.
1️⃣ DXY – U.S. Dollar Index
Why it matters:
The U.S. dollar affects everything: commodities, stocks, global trade, and especially forex. The DXY measures its strength against major currencies.
📉 Chart Reference:
In 2022, DXY surged past 110 due to aggressive Fed rate hikes. This crushed EURUSD, pressured gold, and triggered a global risk-off move. Traders who tracked DXY rode USD strength across the board.
💡 Use it to: Confirm trends in FX and commodities. Strong DXY = bearish pressure on gold and risk assets.
2️⃣ US10Y – 10-Year Treasury Yield
Why it matters:
This is the benchmark for interest rates and inflation expectations. It guides borrowing costs, equity valuations, and safe-haven flows.
📉 Chart Reference:
In 2023, the 10Y spiked from 3.5% to nearly 5%, leading to weakness in growth stocks and boosting USD/JPY. Bond traders saw it first—equities followed.
💡 Use it to: Anticipate moves in growth vs. value stocks, and confirm macro themes like inflation or deflation.
3️⃣ Fed Dot Plot
Why it matters:
This is the Fed’s forward guidance in visual form. Each dot shows where a policymaker expects interest rates to be in the future.
📉 Chart Reference:
In Dec 2021, the dot plot signaled a faster pace of hikes than the market expected. Those who caught the shift front-ran the USD rally and equity correction in early 2022.
💡 Use it to: Predict future rate policy and align your macro bias with the Fed's path.
4️⃣ M2 Money Supply (US)
Why it matters:
This chart tracks the amount of money in the system. More liquidity = fuel for risk. Less = tightening conditions.
📉 Chart Reference:
After COVID hit, M2 exploded, leading to a major bull run in stocks and crypto. When M2 began contracting in 2022, asset prices peaked and reversed.
💡 Use it to: Gauge macro liquidity conditions. Expansion is bullish; contraction is dangerous.
5️⃣ Copper/Gold Ratio
Why it matters:
Copper is a growth metal; gold is a fear hedge. Their ratio acts as a risk-on/risk-off indicator.
📉 Chart Reference:
In 2021, the copper/gold ratio surged—signaling growth and optimism. This preceded strong gains in cyclical equities and commodity currencies like AUD and CAD.
💡 Use it to: Confirm risk sentiment and lead equity or FX trends.
6️⃣ VIX – Volatility Index
Why it matters:
VIX tracks expected volatility in the S&P 500. It's often called the "fear index."
📉Chart Reference :
In March 2020, VIX spiked to nearly 90 as COVID panic set in. This extreme fear was followed by one of the greatest buying opportunities of the decade.
💡 Use it to: Time entries and exits. High VIX = fear = possible reversal. Low VIX = complacency = caution.
7️⃣ Real Yields (10Y TIPS - CPI)
Why it matters:
Shows the inflation-adjusted return on bonds. Real yields affect gold, tech, and risk appetite.
📉Chart Reference :
In 2022, real yields went from deeply negative to positive—crushing gold and high-growth stocks.
💡 Use it to: Confirm direction in gold, NASDAQ, and broad macro trends.
8️⃣ Oil Prices (WTI or Brent)
Why it matters:
Oil is both a growth and inflation input. Rising prices mean higher costs and often precede policy tightening.
📉Chart Reference :
Oil’s rally in early 2022 foreshadowed CPI spikes and led central banks to turn hawkish. Traders who tracked it saw inflation risks building early.
💡 Use it to: Forecast inflation, assess energy-related equities, and understand global demand.
9️⃣ Global PMIs (Purchasing Managers’ Indexes)
Why it matters:
Leading indicator of economic health. PMIs above 50 = expansion. Below 50 = contraction.
📉 Chart Reference:
In 2023, China’s PMI consistently printed below 50—signaling manufacturing weakness and global demand concerns. This helped traders avoid overexposure to emerging markets.
💡 Use it to: Gauge growth momentum globally and regionally.
🔟 SPX vs. Equal-Weighted SPX (Breadth Divergence)
Why it matters:
Shows whether the S&P 500 rally is broad-based or just driven by a few megacaps.
📉Chart Reference :
In early 2024, the index made new highs—but the equal-weighted version lagged badly. That divergence warned traders of a fragile rally.
💡 Use it to: Detect weakness beneath the surface and avoid false confidence in rallies.
🧠 Nerdy Tip: Macro Is the Invisible Hand
These charts don’t give you trade entries—but they give you conviction, timing, and perspective.
When you combine macro context with technical setups, you trade in sync with the market’s deeper rhythm.
So before you place your next trade, ask yourself:
What are yields doing?
Is liquidity expanding or drying up?
Is risk appetite rising or falling?
put together by : @currencynerd as Pako Phutietsile
when Jerome says spike, the markets asks how low/high"Watch what they do, but also how they say it."
In the high-stakes world of central banking, few things move markets like the subtle wording of a Fed statement, But beyond the headlines and soundbites, one market absorbs this information faster—and with greater clarity—than almost any other: the bond market.
💬 What Is "Fed Speak"?
"Fed speak" refers to the nuanced and often deliberately vague language used by U.S. Federal Reserve officials when communicating policy expectations. It includes:
FOMC statements
Dot plot projections
Press conferences
Individual speeches from Fed officials
nerdy tip: the Fed aims to influence expectations without committing to specific outcomes, maintaining flexibility while steering market psychology.
📈 The Bond Market as a Decoder
The bond market, particularly the U.S. Treasury market, is where real-time interpretation of Fed policy plays out. Here's how it typically reacts:
1. Short-Term Yields (2Y, 3M) = Fed Expectation Barometer
These are the most sensitive to near-term interest rate expectations. If the Fed sounds hawkish (more rate hikes), short-term yields jump. If dovish (hinting cuts), they fall. At the May 7, 2025 FOMC meeting, the 2-year Treasury yield (US02Y) experienced a modest but clear reaction:
Just before the release, yields were hovering around 3.79%.
In the first hour following the 2:00 PM ET (20:00 UTC+2) statement, the yield ticked up by approximately +8 basis points, temporarily reaching about 3.87%.
Later that day, it eased back to around 3.79%, ending the day roughly unchanged—a sharp, immediate spike followed by a reversion.
2. Long-Term Yields (10Y, 30Y) = Growth + Inflation Expectations
Longer-dated yields reflect how the market sees the economy unfolding over time. After a Fed speech:
Rising long-term yields = stronger growth/inflation expected
Falling yields = fears of recession, disinflation, or policy over-tightening
3. The Yield Curve = Market's Policy Verdict
One of the best tools to read the bond market's verdict is the yield curve—specifically, the spread between 10Y and 2Y yields.
Steepening curve → Market thinks growth is picking up (Fed may be behind the curve)
Flattening or Inversion → Market believes the Fed is too aggressive, risking a slowdown or recession
📉 Example: After Jerome Powell’s hawkish Jackson Hole speech in 2022, the 2Y-10Y spread inverted deeply—markets were pricing in recession risks despite a strong Fed tone.
🧠 Why Traders Must Watch Bonds After Fed Speak
🪙 FX Traders:
Higher yields = stronger USD (carry trade advantage)
Falling yields = weaker USD (lower return for holding)
📈 Equity Traders:
Rising yields = pressure on tech/growth stocks (higher discount rates)
Falling yields = relief rally in risk assets
📊 Macro Traders:
The MOVE Index (bond volatility) often spikes around FOMC events
Forward guidance shifts = big rotation opportunities (e.g., bonds > gold > dollar)
(BONUS NERDY TIP) 🔍 How to Analyze Fed Speak Through Bonds
✅ Step 1: Watch the 2Y Yield
First responder to new rate expectations.
✅ Step 2: Check the Fed Funds Futures
Compare market pricing pre- and post-statement.
✅ Step 3: Look at Yield Curve Movement
Steepening or inversion? That’s the market’s macro take.
✅ Step 4: Track TLT or 10Y Yield on Your Chart
Bond ETFs or Treasury yields reveal sentiment instantly.
🧭 Final Nerdy Thought : Bonds React First, Talk Later
When the Fed speaks, don't just read the words. Read the yields. The bond market is often the first to interpret what the Fed really means—and the first to price in what comes next.
So next FOMC meeting, instead of watching only Powell’s facial expressions or CNBC pundits, open a chart of the 2Y and 10Y. That’s where the smart money’s listening.
put together by : @currencynerd as Pako Phutietsile
courtesy of : @TradingView

are you the Messi or Ronaldo of trading“In football, some say Messi was born with it, and Ronaldo built it. In trading, the same debate lives on—are the best naturally gifted, or relentlessly crafted?”
The Messi vs Ronaldo debate is more than just about football. It’s a lens into how we perceive greatness:
Messi, the effortless genius, gliding past defenders like he was born with a ball at his feet.
Ronaldo, the relentless machine, forged through discipline, self-belief, and sheer work ethic.
Both legends. Both dominant. But two very different paths to mastery.
And that same question echoes loudly in the world of trading:
Are great traders born with a gift—or made through grind, loss, and experience?
The “Natural” Trader : Messi
There’s a romantic idea that some traders just have it:
They “see” the market differently.
They time entries perfectly.
They stay calm in chaos.
But what we often overlook is that this perceived instinct is usually refined intuition, earned through thousands of chart hours, hard-won lessons, and deep emotional work.
Just like Messi has trained for decades—even the gifted must still grow.
The Ronaldo Blueprint: Greatness Is Built
Cristiano Ronaldo is often cited as the perfect example of what's possible through obsession, sacrifice, and discipline. Every goal, every leap, every sprint—is a result of work. And in trading, that blueprint is more common than you think.
Here’s how great traders are built:
Through structured process. Clear rules, risk protocols, and systems that remove emotion.
Through deep reflection. Journaling trades, studying behavior patterns, reviewing psychology—not just price.
Through emotional mastery. Remaining centered during drawdowns and not getting high off wins.
Through resilience. Getting back up after losses, blown accounts, bad calls, and still showing up.
This is the Ronaldo of trading. And it’s replicable—if you’re willing to put in the reps.
Talent Helps—but It’s Never Enough
Yes, some traders may be “wired” with certain advantages:
Pattern recognition, mathematical intuition, calm under pressure. But just like talent in sports, without discipline, it fades. Without consistency, it cracks.
In truth, most consistently profitable traders you’ll meet are not the flashiest or most “gifted.”
They’re the most adaptable, the most disciplined, and the most reflective.
So… Which One Are You?
It doesn’t matter. Because the bigger question is:
Are you willing to grow into the trader you want to become?
Great traders are not born or made.
They are choosing to evolve—every day.
They put ego aside and put in the work.
They trade with intention, not impulse.
Nerd Tip:
You might start your journey as a “Messi” or a “Ronaldo,” but in the markets, the path is yours to shape.
The charts don’t care where you begin—they respond only to how you show up.
So whether you’re gifted or grinding—
Keep sharpening the edge. Keep showing up.
Because in this game, consistency beats brilliance.
Stay disciplined. Stay dangerous.
put together by : Pako Phutietsile as @currencynerd
Beneath the Blocks: The Real Tech That Powers CryptoCrypto is more than coins and charts. That’s the surface most traders never look beyond.
It's a stack of revolutionary technologies working together to build the future of finance, data, and trust.
But if you’re serious about understanding crypto’s long-term value—or timing its major shifts—you need to grasp what lies beneath.
Here’s your deep-dive into the true foundations of the crypto ecosystem:
🔸 1. DeFi (Decentralized Finance)
DeFi is crypto’s answer to traditional banking—without banks.
Instead of loan officers or custodians, you interact with smart contracts that handle everything from borrowing, lending, to trading.
Protocols like Aave, Compound, and Uniswap allow users to earn interest, provide liquidity, or borrow assets— permissionlessly.
No KYC. No intermediaries. Just wallets and smart contracts.
Total Value Locked (TVL) across DeFi platforms has been a major leading indicator for altcoin seasons.
📚 Why it matters: DeFi is crypto's real-world use case—and its biggest battleground for regulation.
🔸 2. Proof of Work (PoW)
PoW is Bitcoin’s original consensus mechanism.
It secures the network by requiring miners to solve complex math problems (hashes). Whoever solves the block gets rewarded with BTC.
This is energy-intensive, but it’s what makes Bitcoin nearly impossible to attack.
It aligns incentives: miners secure the network in return for rewards.
📚 Why it matters: PoW is the most proven security model in crypto—but it’s also under pressure for its energy costs.
🔸 3. Proof of Stake (PoS)
PoS replaces miners with validators—chosen based on how much crypto they “stake” (lock up) as collateral.
Used by Ethereum 2.0, Solana, Avalanche, Cardano, and many others.
It’s energy-efficient and enables faster, cheaper transactions.
Validators get rewarded in native tokens (e.g., ETH) for proposing and verifying blocks.
📚 Why it matters: PoS is scalable and green, but centralization risks arise if large players control too much stake.
🔸 4. Energy Consumption
PoW networks like Bitcoin consume significant electricity due to mining.
Critics argue this is wasteful.
Proponents argue it's essential for decentralized security and global financial sovereignty.
Solutions being explored:
Renewable-powered mining
Off-grid operations
Transitioning to PoS (as Ethereum did)
📚 Why it matters: Sustainability is a battleground narrative—especially as institutional adoption grows.
🔸 5. Hash (Hash Function)
A hash is a one-way cryptographic function that transforms any input (a transaction or block) into a fixed-length output.
Bitcoin uses SHA-256.
Changing just one character in the input changes the entire hash—making tampering obvious.
📚 Why it matters: Hashes secure every block, transaction, and address—forming the cryptographic backbone of all blockchains.
🔸 6. Smart Contracts
Smart contracts are self-executing agreements written in code, deployed on-chain.
“If X happens, do Y.” No lawyers, no third parties.
Enabled NFTs, DeFi, DAOs, and much more.
Popular platforms:
Ethereum (Solidity)
Solana, Avalanche, BNB Chain, etc.
📚 Why it matters: Smart contracts are what make blockchains programmable. This is the difference between BTC (digital gold) and ETH (Web3 platform).
🔸 7. Distributed Ledger
A distributed ledger is a database that is shared, synchronized, and accessible across multiple nodes.
Every node stores a full copy of the blockchain.
Consensus ensures all copies are aligned.
Immutable: You can only add to it, not edit or delete.
📚 Why it matters: This is what decentralization looks like. No single point of failure. Trust is built into the architecture.
🔸 8. Blockchain Technology
Think of blockchain as a chain of blocks, where each block stores transaction data and a hash of the previous block.
It’s:
Transparent: Anyone can audit it.
Secure: Tampering with one block invalidates the chain.
Decentralized: Run by thousands of nodes worldwide.
📚 Why it matters: Blockchain is the foundational tech. Coins come and go—but the architecture is the real revolution.
💡 Nerdy Tip:
Don’t just trade what you see. Learn what drives it.
The real edge in crypto comes from understanding the mechanics—before they show up in price action.
put together by : Pako Phutietsile as @currencynerd

the markets are a very emotional cry babyIf you've ever asked, “Why is the market going up on bad news?” or “Why did it dump after great earnings?”, you're not alone.
Markets may seem logical—economic data in, price action out—but in reality, they’re driven by human emotion, crowd psychology, and reflexive feedback loops. The charts don’t lie, but the reasons behind the moves? Often irrational.
Let’s break down why markets are emotional—and how traders can use that to their advantage.
🧠 1. Markets Are Made of People (and People Aren’t Rational)
Even in the age of algorithms, human behaviour sets the tone. Fear, greed, FOMO, panic—all of it shows up on charts.
Fear leads to irrational selling
Greed fuels bubbles and euphoria
Uncertainty causes volatility spikes—even with no new information
📉 Example: The 2020 COVID crash saw massive capitulation. Then came one of the fastest bull markets ever—driven by stimulus and FOMO.
another example
📊 S&P 500 in 2020 with VIX, the S&P 500 crashed and the VIX went up, When the VIX (CBOE Volatility Index) goes up, it means that traders/investors expect a greater likelihood of price fluctuations in the S&P 500 over the next 30 days. This generally indicates increased fear as shown on the chart below
📈 2. Price Doesn’t Reflect Facts—It Reflects Belief
The market is not a thermometer. It’s a barometer of expectations.
When traders believe something will happen—whether true or not—price adjusts. If the Fed is expected to cut rates, assets may rally before it actually happens.
💡 Nerd Tip: Reality matters less than consensus expectations.
Chart Idea to visit:
💬 USD Index vs. Fed rate expectations (2Y yield or futures pricing)
🪞 3. Reflexivity: Belief Becomes Reality
Coined by George Soros, reflexivity explains how beliefs can influence the system itself.
Traders bid up assets, creating bullish momentum
That momentum attracts more buyers, reinforcing the trend
Eventually, fundamentals “catch up” (or the bubble bursts)
📌 Insight: The market creates its own logic—until it doesn’t.
😬 4. Emotional Extremes Create Opportunity
When markets overreact, they offer setups for rational traders.
Capitulation = Bottom Fishing
Euphoria = Caution
Disbelief = Strongest rallies
🧠 Pro Tip: Watch sentiment indicators, not just price. Fear & Greed Index, put/call ratios, or COT data reveal what the crowd is feeling.
Chart Example:
📊 Bitcoin 2022 bottom vs. Fear & Greed Index.. on the chart above the index score close to zero (RED) indicating extreme fear this was because in november 2022 crypto cybercrimes grew new level and investors lost confidence, these cyber crimes included the bankruptcy of FTX as the owners were allegedly misusing customer funds.
💡 5. How to Trade Rationally in an Irrational Market
a. Have a plan. Pre-define entries, exits, and invalidation levels.
b. Expect overreaction. Markets often go further than they “should.”
c. Use sentiment tools. Divergences between price and emotion are gold.
d. Don’t fight the crowd—until it peaks. Fade extremes, not momentum.
e. Zoom out. 5-minute panic means nothing on a weekly trendline.
🎯Nerd Takeaway:
Markets aren’t efficient—they’re emotional.
But that emotion creates mispricing, and mispricing = opportunity.
You don’t need to predict emotion—you just need to recognize it, and trade on the reversion to reason.
💬 Have you ever traded against the crowd and nailed it? Or got caught up in the hype? Drop your chart and your story—let’s learn from each other.
put together by : @currencynerd as Pako Phutietsile
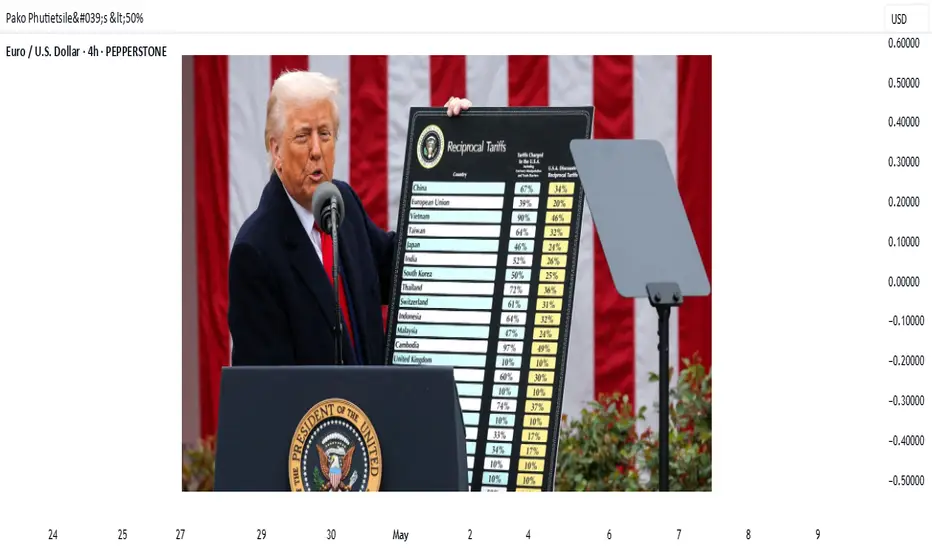
Trade Wars, Tariffs & Currencies: The Connection Explained📊 What Are Tariffs & Why Should Traders Care? 💱
Tariffs are taxes imposed by a country on imported goods. Think of them as the "price of entry" foreign products must pay to access domestic markets.
🔍 Why Governments Use Them:
Protect domestic industries from cheaper foreign goods
Retaliate in trade disputes
Raise revenue (less common today)
🧠 Why Traders Should Watch Tariffs:
Tariffs don’t just hit companies—they ripple through economies and currency markets. Here’s how:
📉 1. Currency Impact
Tariffs can lead to currency depreciation in the targeted country as trade volumes fall and foreign demand drops.
Example: When the U.S. imposed tariffs on China, the Yuan weakened to offset the blow.
📈 2. Inflation Pressure
Tariffs make imports more expensive, fueling inflation. Central banks may respond with rate hikes—which moves markets.
🌐 3. Risk Sentiment
Tariff wars increase global uncertainty = risk-off sentiment. Traders flee riskier currencies (like EMFX) for safe havens like the USD, CHF, or JPY.
🔄 4. Trade Balance Shifts
Tariffs can affect a country's trade balance, influencing long-term currency valuation.
💡 Trading Tip:
Watch for tariff announcements or trade tension headlines—they often precede volatility spikes in major pairs. Combine with sentiment tools and fundamentals for best results.
Unlocking the Power of TradingViewWhether you're a forex newbie or a seasoned trader, having the right tools can make or break your trading success. One platform that consistently stands out is @TradingView charting powerhouse packed with features designed to give you an edge. I @currencynerd I'm all about helping traders stay smart and stay sharp, so here’s a look at @TradingView features that can enhance your trading game.
1. Advanced Charting Tools
TradingView's clean, responsive charts are one of its strongest features. You can customize everything—from chart types (like Heikin Ashi, Renko, or Line Break) to timeframes (including custom ones like 3-minute or 8-hour charts). Multiple chart layouts allow you to view several pairs or timeframes side by side—perfect for multi-timeframe analysis.
Pro Tip: Use the “Replay” feature to practice backtesting and understand market behavior in real-time.
2. Built-in Technical Indicators
TradingView offers hundreds of built-in indicators (RSI, MACD, Bollinger Bands) and community-created ones. You can also stack multiple indicators on the same pane for cleaner setups.
my is Favorite: “Pako Phutietsile's <50%”, which is an automatic indicator that detects and marks basing candles on the chart. A basing candle is a candle with body length less than 50% of its high-low range. This is essential for supply and demand traders.
3. Pine Script for Custom Strategies
If you're serious about systematizing your edge, Pine Script lets you build and backtest custom indicators and strategies. Even with basic coding knowledge, you can automate entry/exit rules, alerts, and more.
Nerdy Bonus: Many user-generated indicators are open source. Tweak them to fit your style.
4. Smart Alerts
Set price, indicator, or drawing-based alerts that trigger via popup, email, or even webhook. This means you don’t need to watch the chart all day—TradingView becomes your eyes on the market.
Example: Get an alert when RSI crosses below 30 on GBP/USD or when price hits a key Fibonacci level.
5. Economic Calendar & News Integration
Stay ahead of market-moving events with TradingView's built-in Economic Calendar and News Feed. You can filter by currency or event impact to focus only on what matters to your trades.
6. Community & Script Library
TradingView’s social side is underrated. Thousands of traders share ideas, scripts, and trade setups. It’s a great way to test your biases or discover new strategies.
Tip: Follow high-reputation contributors in the trading/investing space and learn from their setups.
7. Multi-device Access & Cloud Sync
Access your charts and watchlists from anywhere. Whether you're on desktop, tablet, or phone, everything stays synced in the cloud. You can start charting at home and get alerts on your phone while you're out.
Final Thoughts:
@TradingView isn’t just a charting tool—it’s a full-fledged trading assistant. Whether you're looking to simplify your workflow, test strategies, or get real-time alerts, the platform can enhance every part of your trading process.
If you haven’t explored these features yet, give them a try. And if you're already using TradingView like a pro, let us know your favorite features in the comments!
Stay sharp, stay nerdy. — @currencynerd
BTC to run out by year 2140, who is the biggest whale?bitcoin whales are individuals or entities that hold/own the most amount of the digital XAU, to achieve this financial status one has to own at least 1000 BTC, with the coin's supply being infinite to 21 million (also known as HARD CAP), meaning that only 21 million bitcoins can ever be created. it's important to know who the big players are in the market also to keep track of the left supply.
one of the important reasons i think why the supply was capped at 21 million was to ensure no risk of inflation even though the Bitcoin creator 'SATOSHI NAKAMOTO' disclosed once that him capping it at 21 million was just an "educated guess"
in order to control supply, there is what is called Bitcoin halving which is the process by which the reward for mining BTC by half hence the term halving. the first ever halving was November 28, 2012 this was the start of a historic run of BTC as a deflationary asset and the most recent was this year APRIL 19, with the reward for mining a single block cut from 6.25 BTC to 3.125 BTC. this event happens when 210,000 are added to the blockchain.
this also reduces the rate at which new coins are created maintaining scarcity which results in an increase in value.
with all that said, WH0 OWNS THE MOST BITCOIN?
top 5 public cooperation's that hold most Bitcoin
* MICROSTRATEGY - U.S company - holds 214,400 est. Value - $13.5B
* MARATHON DIGITAL - U.S company - hold 17,631 est. Value - $1.1B
* TESLA - U.S company - holds 9,720 est. Value - $600M
* HUT 8 - CANADA company - holds 9,109 est. Value - $574.1M
* COINBASE - U.S company - holds 9,000 est. Value - $567.2M
top 5 countries that hold most Bitcoin
* USA - holds 207,189 est. Value - GETTEX:13B
* CHINA - holds 194,000 est. Value - $12.2B
* UK - holds 61,000 est. Value - $3.8B
* GERMANY - holds 50,000 est. Value - $3.1B
* UKRAIN - holds 46,351 est. Value - $2.9B
top 5 private companies that hold most Bitcoin
* Mt. Gox - holds 200,000 est. Value - $12.6B
* Block.one - holds 140,000 est. Value - $8.8B
* Tether holdings - holds 75,354 est. Value - $4.7B
* Xapo Bank - holds 38,931 est. Value - $2.4B
* BitMEX - holds 36,794 est. Value - $2.3B
then there are other investors that are involved in the BITCOIN market without directly purchasing it but through bitcoin related assets. these are :
*Grayscale Bitcoin Trust
holds 291,802 est. Value - $18.3B
*iShares Bitcoin Trust
holds 274,322 est. Value - $17.2B
*Fidelity Wise Origin Bitcoin Fund
holds 152,880 est. Value - $9.6B
*CoinShares/XBT Provider
holds 48,466 est. Value SEED_TVCODER77_ETHBTCDATA:3B
*ARK 21Shares Bitcoin ETF
holds 43,470 est Value - $2.7B
top individuals that hold the most BTC.
*SATOSHI NAKAMOTO
1.1MILLION BTC
*THE WINKLEVOSS TWINS
70,000 BTC
*TIM DRAPER
29,500 BTC
*MICHAEL SAYLOR
17,732 BTC
researched and put together by : Pako Phutietsile as @currencynerd
