XAGUSD Analysis Using MMC | Breakout & Reversal + Target🧠 What the Chart is Telling Us:
Today’s Silver (XAGUSD) price action presents a powerful combination of structural breakout, pattern continuation, and mirror market behavior. Let’s break it down step-by-step so you understand the full picture.
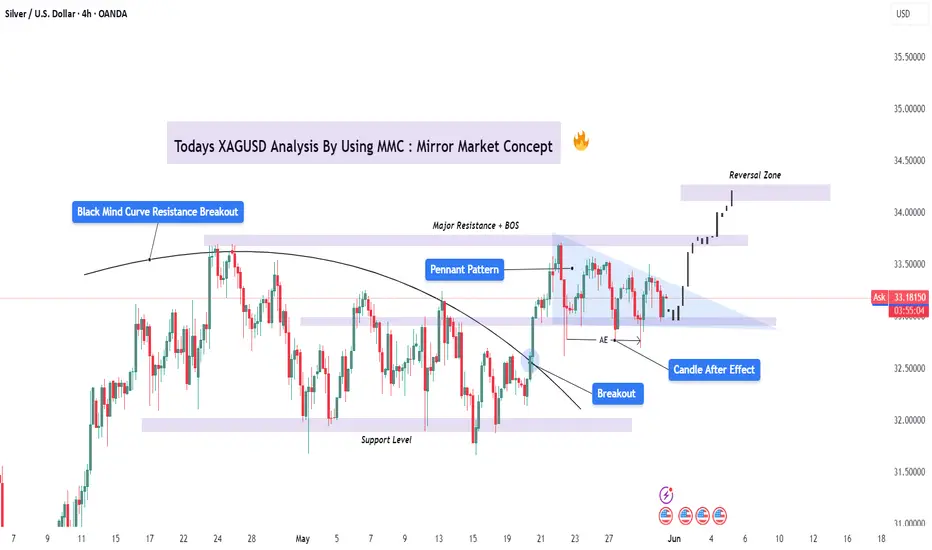
🔸 1. Black Mind Curve Resistance Breakout
At the top-left of the chart, we see a curved descending resistance line (referred to as “Black Mind Curve”). This line has acted as a long-term dynamic resistance, consistently rejecting price action across multiple sessions.
However, after several failed attempts, the price finally broke above this resistance curve—a highly bullish signal. This breakout marks the beginning of a structural shift, where the bearish control starts to weaken and buyers gain momentum.
🔸 2. Support Level and Accumulation
Near mid-May, the price formed a solid horizontal support level. This level was tested multiple times but held firm, suggesting strong accumulation by smart money. According to MMC principles, these accumulation zones are mirrored later as breakout points—which is what we see play out in the chart.
🔸 3. Pennant Pattern Emergence
After the initial curve breakout, the market entered a tight consolidation, forming a Pennant Pattern. This is a continuation pattern formed when the market briefly pauses after a big move.
This pennant acts as a resting phase before another strong impulse—buyers are catching their breath, preparing for a second attack.
🔸 4. Breakout and Candle After Effect (AE)
Once price broke the pennant pattern, we saw an aggressive breakout candle (marked as AE – After Effect). This large candle is a classic liquidity candle that confirms buyer dominance.
In MMC terms, this AE candle reflects momentum that mirrors the impulse leading into the pennant, indicating that the second move will often match the first one in structure or magnitude.
🔸 5. Major Resistance + Break of Structure (BOS)
Above the breakout zone lies a key resistance area, which has now been broken. This is a Break of Structure (BOS) confirming that the market has flipped from a bearish to bullish structure.
This zone, once resistance, may now act as support in future pullbacks—a concept central to Mirror Market Theory, where historical resistance becomes future support (and vice versa).
🔸 6. Reversal Zone Target
The chart shows a projected move toward the Reversal Zone between $34.00–$34.50. This zone aligns with:
Previous highs from historical market structure.
Mirror levels when flipped across the midrange of the price action.
Possible liquidity zones where large institutions may look to reverse or take profits.
This Reversal Zone is where we can expect potential exhaustion in the bullish run, signaling a pause or a minor correction.
📌 Summary of Analysis:
✅ Bullish Confirmation Points:
✅ Breakout above long-term resistance curve
✅ Bullish Pennant Pattern followed by AE breakout
✅ Break of major horizontal resistance (BOS confirmed)
✅ Target toward reversal zone in line with MMC reflection logic
⚠️ What to Watch:
Price action behavior near $34.00–$34.50
Potential bearish engulfing or liquidity sweep in the reversal zone
RSI/Volume divergence signals near top zones
🎯 Final Thoughts:
The Silver market is showing clear bullish momentum supported by strong technical confluence and MMC-based mapping. The current structure favors continuation to the upside, but traders should manage risk as we approach reversal zones where large players may start offloading positions.
🧠 Mirror Market Concept Reminder:
MMC is a strategy based on the mirroring of market behavior—where price levels, patterns, and reactions tend to reflect past structures either directly or inversely. It’s highly effective in spotting key reaction zones, target extensions, and reversals.
💬 What’s Your Take?
Do you agree with this bullish projection, or do you see weakness ahead? Let me know in the comments! And don’t forget to like & share this idea if you found value in it. 🚀
Mirrormarketconcepts
BTCUSD Breakdown from Pennant – MMC Structure Analysis + Target🧠 Introduction: Why This Chart Matters
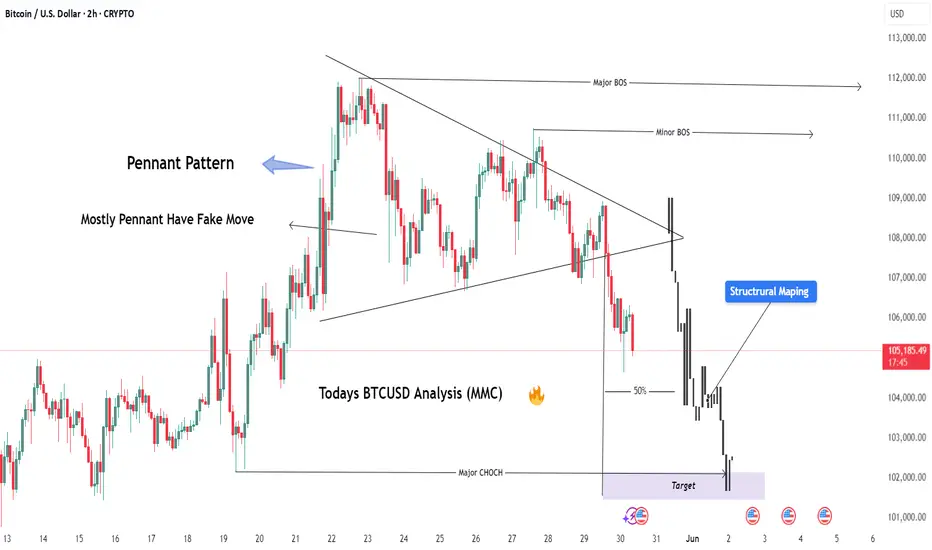
Bitcoin recently provided a textbook example of market manipulation, where the price action formed a bullish-looking pattern (Pennant), trapped traders with a fake breakout, and then reversed strongly to the downside. By using Mirror Market Concepts (MMC), we can clearly see the logic behind this move—how the market mirrored a previous pattern and fulfilled a predictable target zone.
This analysis breaks it all down, step-by-step, for both educational and practical trading purposes.
🔍 Detailed Chart Breakdown:
1️⃣ The Illusion – Bullish Pennant Formation
Initially, BTC/USD formed what looked like a bullish pennant—a common continuation pattern in technical analysis. The pattern appeared after a sharp upward move, followed by converging trendlines suggesting consolidation.
Retail traders often anticipate a breakout above the pennant as a sign of bullish continuation. This is where the trap begins.
Why It’s a Trap: The pattern looked clean and reliable—but the context told another story. This move was designed to lure breakout traders into long positions right before a reversal.
2️⃣ The Fakeout – Liquidity Grab Above the Pattern
Shortly after the pennant formed, price pushed above the upper trendline, triggering breakout entries and stop losses of short-sellers. But instead of continuing up:
The price reversed sharply.
This aggressive move confirmed the fakeout.
This is a classic example of a liquidity hunt, where the market moves briefly in one direction to gather orders before executing the real move.
📌 MMC Insight: This behavior mirrors a prior setup—price previously faked upward, then dropped to a key demand zone. The mirror pattern gives a clue that the same outcome might repeat.
3️⃣ CHoCH – Change of Character Confirmed
After the fakeout, BTC broke below a key internal support and trendline structure, signaling a CHoCH (Change of Character)—a shift from bullish to bearish market control.
This moment is crucial:
It confirms the smart money’s intention.
It signals that the previous bullish move was just a setup.
Sellers now have control.
💡 Pro Tip: CHoCH is one of the earliest and most reliable signs of a reversal when combined with liquidity patterns.
4️⃣ Trendline Break & Structural Sell-Off
The break of the trendline following CHoCH solidified the bearish direction. This was the best confirmation-based entry point, as the structure flipped and began forming lower highs and lower lows.
5️⃣ Target Fulfilled – Previous Demand Zone Hit
The price then continued down aggressively and hit the marked MMC target zone. This area coincided with:
A previous demand zone (where buyers stepped in before).
A Mirror Market reversal point, seen earlier in the chart.
This fulfillment of the MMC target validates the entire analysis—from trap to reversal to target.
🎯 Key Zones:
Fakeout High: $69,600 area (liquidity sweep)
CHoCH Break Level: Around $69,100
Trendline Break Confirmation: $69,000
Final Target Zone: $68,500–$68,700
📈 Trading Strategy Recap:
Entry Idea: Enter short after CHoCH and trendline break
Stop Loss: Above fakeout high ($69,600+)
Take Profit: MMC demand zone ($68,500–$68,700)
This trade offered excellent risk-to-reward and confluence using multiple tools (MMC, CHoCH, structure, liquidity sweep).
🧠 What You Can Learn from This Setup:
Patterns Can Lie: A pattern like a pennant isn’t enough—context is key.
Liquidity Is King: Understand where the market needs to go to collect orders.
Mirror Market Concepts Work: Historical behavior often repeats in reverse. Use MMC to forecast likely outcomes.
CHoCH is Powerful: It's your early alert system for trend changes.
🔎 Final Thoughts:
This BTC/USD chart is a powerful example of how smart money operates—with manipulation, pattern traps, and mirrored market behavior. If you’re a price action trader or use MMC, this breakdown is a must-study.
Don't just trade patterns—trade context. Look for traps. Use MMC. Watch CHoCH. And always have a mapped target based on structure.
XAU/USD – Gold Analysis Using MMC & Structural Mapping + Target🔎 Market Narrative:
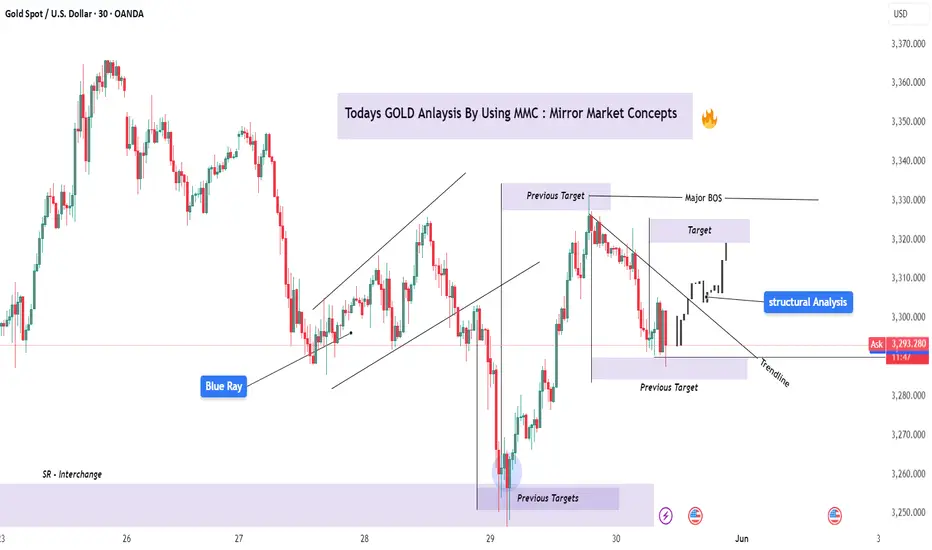
Today’s GOLD analysis is crafted through the lens of Mirror Market Concepts (MMC)—a powerful strategy where historical price behavior is mirrored in the current chart structure. This is combined with traditional structural analysis, offering a clear view of current price behavior, key breakouts, and target levels.
We’re currently seeing an interesting scenario unfold where the market structure is shifting from bearish to bullish, aligning with mirrored reactions from previous key zones.
🧠 MMC Breakdown & Price Psychology:
🔄 Mirror Reaction:
Notice how the market mirrored a previous aggressive sell-off with a similar bullish recovery. This “reflection” is a hallmark of MMC—where market sentiment repeats itself, but in opposite directions.
The "Previous Targets" zone acted as a key SR Interchange (support-turned-resistance / resistance-turned-support). Price dropped into this zone and bounced with strong bullish momentum, signaling smart money accumulation or potential liquidity grab before reversal.
🧱 Structural Analysis:
🔹 Trendline Observation:
A key trendline (drawn from the recent swing highs) was clearly broken, confirming that the bearish structure has shifted into a bullish one. The breakout was followed by a retest, further strengthening the validity of this move.
🔹 Support/Resistance Flip (SR Interchange Zone):
The Blue Ray zone marked on the chart is critical. This area held as support in the past and again acted as a launchpad for the recent upside move.
🔹 Previous Targets Reclaimed:
After hitting the previous support zone, price reversed sharply—another MMC principle in play. These zones often serve as liquidity magnets and reaction zones, where institutional traders are active.
📍 Key Levels To Watch:
✅ Current Support: $3,289–$3,295 (Previously broken resistance, now acting as support)
🎯 Immediate Target Zone: $3,310–$3,320
(This is where the price is expected to face short-term resistance. If broken, the next mirror move could extend further.)
🔻 Trendline Confirmation Level: $3,296
(Holding above this confirms bullish bias short-term)
🛠️ Trading Plan / Bias:
Bias: Bullish
Entry Idea: Look for bullish continuation above $3,296 after minor consolidation or retest
Risk Management: Place stop-loss just below $3,289 (previous demand zone)
Take-Profit: $3,310 – $3,320 zone initially
⚠️ Risk Consideration:
Gold can be volatile, especially during news events. Always assess macroeconomic factors (like Fed policy, NFP, CPI, etc.) and manage your trades with solid risk-to-reward ratios.
🧠 Final Thoughts:
This chart is a great example of how Mirror Market Concepts (MMC) can work hand-in-hand with price action and structure to provide clean, repeatable setups. By understanding the psychology behind price mirroring, we can better anticipate turning points and entry zones—especially when the structure confirms it.
Whether you’re a day trader or swing trader, this concept adds a layer of confluence to your technical analysis toolkit.
XAGUSD Analysis with MMC | Trendline + CHoCH Insight + Target🔍 Overview
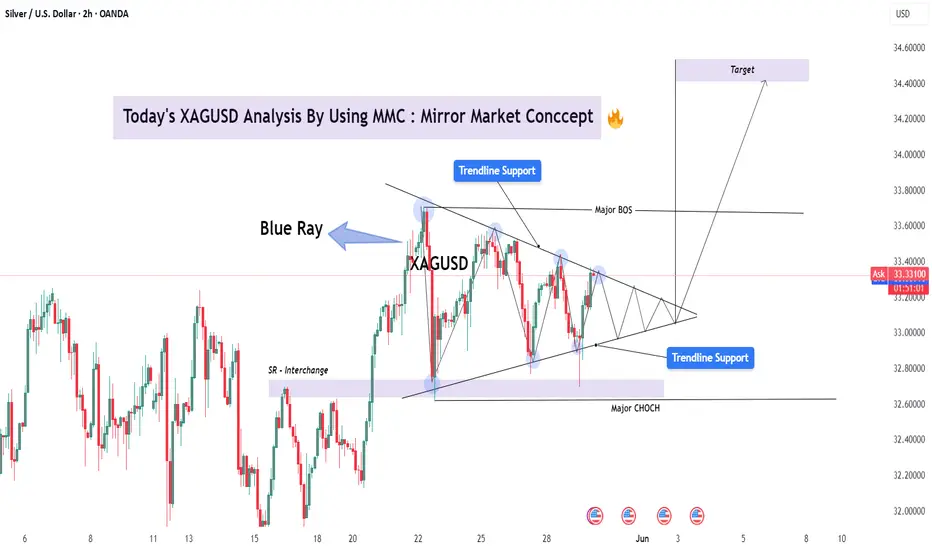
This XAGUSD chart presents a classic Mirror Market Concept (MMC) pattern – a fractal, symmetrical market behavior often observed at key inflection points. The structure is currently forming a tight triangle pattern within two converging trendlines, signaling a compression phase before a significant breakout.
Mirror Market Concept relies on the idea that historical emotional market structures tend to repeat or reflect, especially in psychologically sensitive zones such as trendline tests, liquidity pools, and BOS/CHoCH areas.
📐 Technical Structure Breakdown
🔷 1. Trendline Resistance & Support (Triangle Compression)
Upper trendline connects successive lower highs, reflecting consistent seller pressure.
Lower trendline aligns with higher lows, showing bullish defense and accumulation pressure.
The result is a symmetrical triangle, often preceding explosive directional moves.
🔹 2. Blue Ray Zone
The "Blue Ray" acts as a historical liquidity pivot — a region where large wicks and rejections happened in both directions.
Price has respected this zone repeatedly, making it a likely impulse trigger area if revisited.
🔄 3. BOS (Break of Structure) and CHoCH (Change of Character)
Major BOS near the $33.60 area indicates a shift in market structure to bullish. The break above previous swing highs suggests buyers gained control temporarily.
Major CHoCH at the base of the triangle reflects where market sentiment shifted, initiating the current series of higher lows.
📍 4. SR Interchange Zone
Previous resistance around $32.80–$33.00 is now acting as support (interchange level), creating a confluence zone with the lower trendline and CHoCH point.
🎯 Forecast & Targets
✅ Bullish Scenario (Primary):
A breakout above the upper triangle trendline and confirmation above $33.60 will validate the bullish breakout setup.
Price Target: $34.40 – $34.60 (based on triangle height + measured move theory)
Expect impulsive follow-through as trapped shorts exit and fresh longs enter.
🚫 Bearish Alternative:
A breakdown below $33.00 with strong volume and bearish retest may invalidate the bullish setup.
In such case, a fall toward $32.20–32.40 is possible — completing a deeper retracement before any resumption of the upward move.
🔍 Market Psychology Behind the Pattern
This triangle represents market indecision, a "coil" where both bulls and bears are losing volatility while absorbing liquidity. The MMC concept teaches us that price often mirrors previous patterns — and the compressed energy inside triangles typically resolves in sharp momentum moves, mirroring the prior impulse.
Expect a strong breakout that "mirrors" the breakout leg from May 22 to May 23. This type of reflection-based logic is a cornerstone of MMC.
🔔 Trading Plan & Strategy
Entry: Wait for breakout and retest of the triangle boundary (ideally on 1H/2H close).
Stop Loss: Below the most recent swing low inside the triangle.
TP1: $34.10
TP2: $34.40
TP3: $34.60 (psychological level and measured move)
⚠️ Risk & News Considerations
Upcoming U.S. economic data events (highlighted on the chart) could act as catalysts. Be prepared for volatility spikes and fakeouts. Always use solid risk management.
GOLD (XAUUSD) Full Analysis – MMC Strategy in Action + Target🧠 What is Mirror Market Concepts (MMC)?
MMC is a psychological and technical framework that interprets market movements as mirrors of past behaviors, often using curves, rays, and emotional imprints to forecast price flow. It assumes that price reacts not just to levels but to memory zones left by institutional actions.
🧭 Chart Overview and Interpretation
1. Black Mind Curve Resistance:
The black curved line represents a dynamic resistance zone where the market previously showed sensitivity.
It aligns with psychological levels where institutional interest faded, marking a high-probability rejection point.
Note the smooth arc — MMC suggests such curves reflect subconscious market resistance.
2. Blue Ray – Institutional Reaction Line:
The blue ray points to a previous impulsive reaction zone near 3,320, marking an emotional high.
Price sharply rejected this area again, creating a mirror rejection.
This symmetry is key in MMC — the present move is reflecting the structure of the past.
3. SR Interchange Zone (Support-turned-Resistance):
Around the 3,290 level, price previously bounced from this zone (demand), but it has now flipped to act as resistance.
This SR Interchange is significant in MMC as it represents a "mental switch" — demand has turned into fear-based supply.
4. Break of Market Structure + Retest:
A clean break below the short-term bullish trendline followed by a rejection retest confirms the shift in structure.
This breakdown confirms bears are in control for now.
The recent candles show clear rejection wicks from the retest zone.
🎯 Trade Plan (Bearish Setup)
Entry Zone:
🔹 Enter between 3,275 – 3,285, where price is rejecting the SR flip and mind curve.
Target Zone:
🎯 First TP: 3,250 (MMC Support Zone – highlighted in purple below)
🛑 Optional Second TP: 3,240 if momentum continues post-news event.
Stop Loss:
🔺 Above 3,300 to allow space for false spikes, just beyond the curve rejection zone.
📉 Why This Setup Works (Psychological Flow)
The current price action is mirroring the left side of the chart — the same way price impulsively rose from a zone, it's now impulsively falling back into it.
The rejection from the Black Curve and Blue Ray are not just technical — they are emotional resistance zones, meaning institutions remember the reaction.
This creates internal balance that MMC traders look to exploit, riding the memory of the market.
🔔 Risk Factors & Considerations
Watch for the USD-related news event on the calendar (noted on chart). If high-impact, it can cause volatility and short-term spikes.
If price breaks and holds above 3,300, the bearish idea becomes invalid — don’t fight the market.
🧵 MMC Concepts Highlighted in This Chart
Black Mind Curve Zone – Dynamic psychological resistance
Blue Ray – Emotional ray from institutional rejection
SR Interchange – Support becomes resistance
Mirror Symmetry – Price behavior is reflecting the past
Emotional Imprint Zones – Past reactions leave future footprints
🗨️ Community Call-to-Action (CTA)
💬 What’s your view on GOLD today? Are you using Mirror Market Concepts in your trading?
Drop your thoughts, charts, or alternate views below — let’s build solid MMC case studies together!

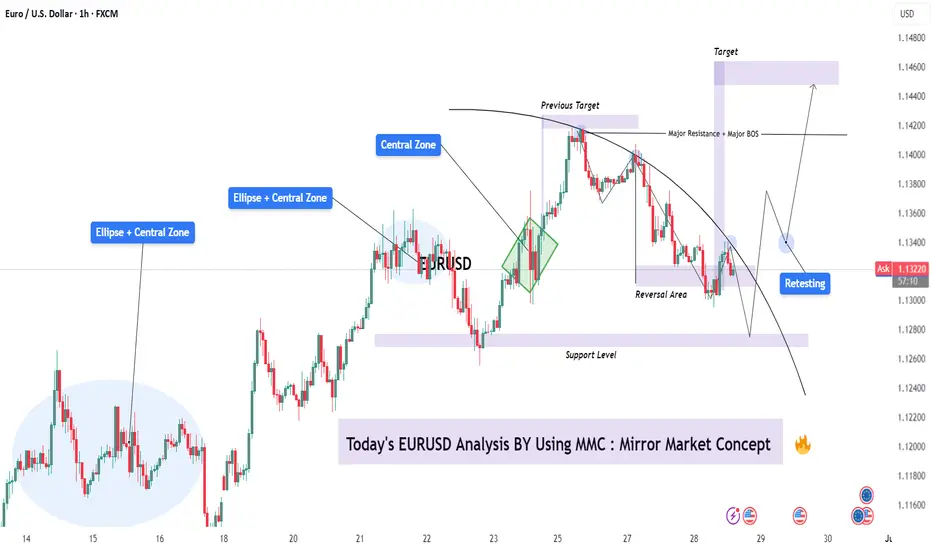
EURUSD Mirror Market Concept – Retest Before Bullish Expansion 🔍 Analysis Summary:
This EUR/USD setup is constructed using the Mirror Market Concept (MMC), which identifies price behavior patterns that tend to "mirror" across central zones or key support/resistance levels. The chart highlights multiple "Ellipse + Central Zone" regions that represent strong consolidation and price decision areas, reflecting symmetry in market reactions.
📈 Key Technical Insights:
Central Zones & Ellipses: These are repeated zones where price action has shown symmetry in both accumulation and distribution phases. Watch how these ellipses mirror prior moves, indicating likely zones of reaction.
Previous Target & Reversal Area : The market completed a leg to the previous target (around 1.1410), followed by a rejection from a major resistance zone, initiating a reversal. This aligns with the Mirror Market structure, where the move downward reflects the previous bullish leg.
Support Level: A significant support zone has been marked near the 1.1275 level. Price action reversed from here, respecting this base and forming a reversal zone.
Retesting Phase: After bouncing from support, the price is entering a retesting phase around the 1.1330 level (identified ellipse). This retest is critical—if held, it could trigger bullish continuation.
Major BOS (Break of Structure): Once price breaks and sustains above the 1.1360–1.1380 region, it will confirm the BOS and pave the way toward the final Target Zone at 1.1450–1.1470.
🎯 Trade Plan Overview:
Bullish Scenario: Look for confirmation of support near 1.1320–1.1330 during the retest. If price holds and forms bullish structure (e.g., higher lows, bullish engulfing), consider long setups targeting 1.1450.
Bearish Invalidator: A breakdown and close below the support level at 1.1275 would invalidate the bullish bias and call for reevaluation of the setup.
🧠 Final Thoughts:
This analysis reflects the mirror behavior of price and the market psychology around equilibrium zones. MMC provides a structured way to anticipate future price action by understanding how historical reactions unfold. Watch key zones and wait for confirmation before engaging.
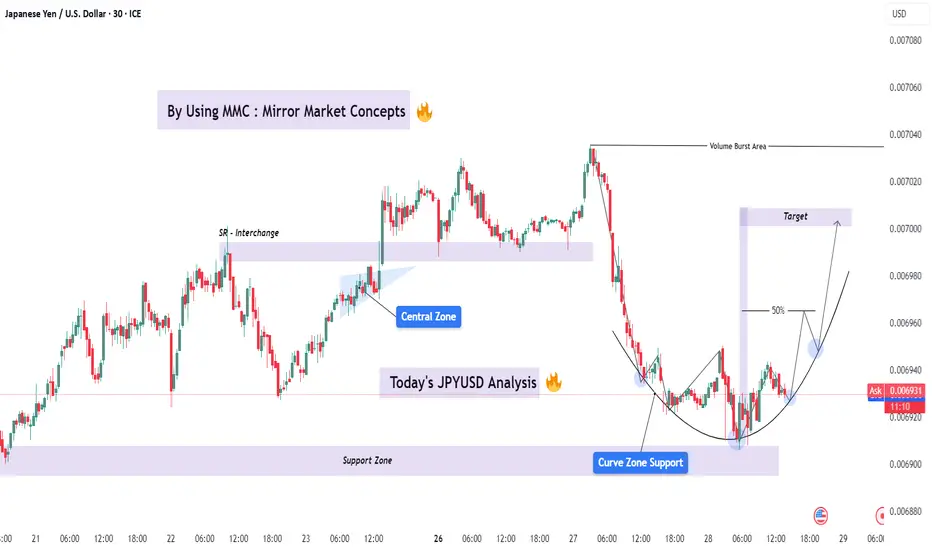
JPY/USD Deep Analysis Using MMC – Curve Zone + Volume Burst Zone📌 Overview:
Today’s chart setup on JPY/USD demonstrates a classic Mirror Market Concept scenario, where price mimics past structure and behavior to create high-probability trade setups. We are looking at a textbook reversal with a rounded bottom forming right above a key Support Zone—signaling a strong potential move upward.
This is not just a basic support bounce. It’s a multi-layered confluence where structure, volume, and price action come together to build a strong bullish narrative.
🌀 Phase 1: The Curve Zone Support (Accumulation)
The Curve Zone Support (marked clearly on the chart) sits right above 0.006890–0.006910.
Price touched this zone multiple times without breaking it, forming higher lows—a typical sign of accumulation.
This pattern resembles a “rounded bottom” or cup shape, indicating that sellers are getting exhausted and buyers are slowly stepping in.
💡 Market Psychology: This is where smart money begins to accumulate positions, absorbing panic sellers while price coils up.
🧱 Phase 2: SR Interchange + Central Zone Reaction
Notice the SR Interchange Zone around 0.006950. Previously it acted as a resistance, but price broke above and now respects it as support.
This is a textbook SR flip, confirming that this level holds weight.
The Central Zone, formed earlier, is where a battle between bulls and bears took place. Now price is creeping back toward it.
🧠 Mirror Market Concept Insight: Market tends to repeat structure. The earlier bullish rally from the same base level is a mirrored version of what’s forming now. That’s why this concept gives us confidence in projecting future price moves.
🔊 Phase 3: Volume Burst Area – The Target Zone
We’ve marked a Volume Burst Area around 0.007040. This is where heavy buying occurred before a sharp decline.
According to MMC, these areas often act like magnets—price gravitates back toward them once demand builds up below.
If price clears the midpoint (50% retracement) around 0.006960, it opens the door for a bullish breakout toward the volume cluster.
🎯 Trade Plan Based on This Setup:
Component Details
Entry Zone 0.006920 – 0.006930 (buy zone)
Stop Loss Below 0.006890
First Target 0.006980 (mid-level reaction)
Final Target 0.007000 – 0.007040 (Volume Zone)
🧬 MMC Confluences That Make This Setup Powerful:
✅ Curve Zone Support – Foundational base for entry.
✅ SR Flip (Interchange) – Old resistance turned support.
✅ Volume Burst Area – Target based on prior aggressive moves.
✅ Structure Break – Bullish structure shift as price forms higher lows.
✅ Psychology – Accumulation turning into expansion.
🏁 Final Thoughts:
This chart is a great example of how Mirror Market Concepts can unlock the hidden patterns of the market. It’s not just technicals, it’s also about understanding how traders think and how price reflects those emotions.
When you combine curve structures, SR interchanges, and volume dynamics, you’re not guessing—you’re anticipating. If price respects this structure, this could be a clean move toward 0.007000+, offering a great risk-to-reward ratio.
Silver (XAG/USD) Analysis Using Mirror Market Concepts + Target📌 Overview:
In this analysis, I’ve applied MMC (Mirror Market Concepts) to Silver’s recent price action. MMC helps traders like us identify symmetry, psychological zones, and repetitive structures in the market. This chart is a textbook example of how buyers and sellers leave patterns behind that we can mirror to predict what comes next.
Let’s dig deep into this elegant setup 👇
📈 1. The Curve Zone Support – Foundation for the Move
At the base of the chart, you’ll notice a curved support zone drawn in black. This isn’t just any random support—this is a rounded structure that shows how price gradually transitioned from bearish to bullish over time.
This Curve Zone Support indicates:
Sellers are getting exhausted.
Buyers are quietly stepping in, absorbing all sell-side pressure.
The market is preparing for an upside breakout.
This zone also aligns with mirror behavior—what price did before, it's setting up to do again.
🟣 2. Mirror Market Concepts in Action
MMC teaches us to reflect past structures into the future. Here’s how it plays out:
Previous dips into the curve zone were followed by strong bullish pushes.
Recent price action mimics earlier structures, forming mini-cups and curved bases.
This behavior suggests that Silver is mirroring its own bullish reversal structure again.
It’s like watching history repeat itself—with new energy.
🟡 3. Demand Zone + Break of Structure (BOS)
Around the $33.00 level, price dipped into a marked demand zone (highlighted in light purple). This is where buyers jumped back in and pushed price up again—proving strong interest at this level.
You’ll also notice a Minor Break of Structure (BOS) above this demand zone, showing:
A small, but significant shift in market sentiment.
Short-term trend change from bearish to bullish.
Fuel for the next leg up.
This BOS acts as confirmation that price is ready to move toward the target.
🎯 4. Targeting Major Resistance – $34.50 Zone
The ultimate goal is the Major Resistance Zone around $34.50. This zone has been tested before and caused strong rejections. But here’s the key difference now:
Price is approaching this level with momentum, structure, and buyer interest.
If MMC continues to play out, this zone could be taken out or at least retested for potential breakout continuation.
This area is marked as your Target Zone and is aligned with the mirrored projection.
🧠 5. What the Market Psychology Tells Us
Let’s not just read candles—let’s read the mind of the market:
Buyers are patiently absorbing every dip.
Sellers are losing control at each attempt to push price down.
The curve base structure is signaling accumulation.
Demand zones are holding perfectly.
Minor BOS adds more weight to bullish bias.
All these are classic MMC psychological footprints.
⚙️ Trade Plan (Educational Purpose Only):
🔹 Bullish Bias:
Entry: On confirmation above the minor BOS or demand retest.
Stop: Below the recent demand zone.
Target: $34.50 Major Resistance area.
🔹 Bearish Watch:
If price rejects from the curve or fails to hold above demand zone…
Price could revisit $32.50 or lower to re-test curve zone again.
📘 Final Thoughts:
This chart is a masterclass in how Mirror Market Concepts work. From the curve zone support to the demand hold, and now a clear target in sight, everything is lining up beautifully.
If you’re a price action trader, this is the kind of structure you wait weeks for.
If the bullish scenario plays out, we could see Silver make a strong run toward the $34.50 resistance zone in the coming days.
Keep your eyes on:
Curve zone support holding
Demand confirmation

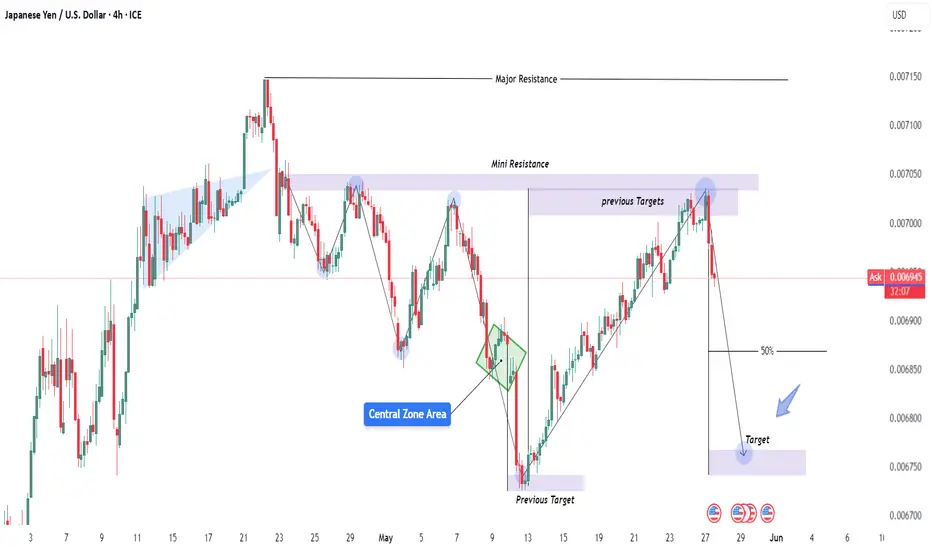
JPY/USD – Clean Rejection from Mini Resistance | Bearish Move🔻 1. Major & Mini Resistance Zones
Mini Resistance Zone: This is a key supply area that aligns with previous highs and recent structure points. As the price approaches this level, it tends to react due to unfilled sell orders and trapped buyers.
The chart shows a rejection from this mini resistance zone — visible through strong bearish candles. This suggests institutional selling pressure has entered the market.
Major Resistance is still untouched above, which becomes a clear invalidation level for any short bias. If price breaks and sustains above it, the bearish idea would be invalidated.
🔄 2. MMC (Mirror Market Concepts) at Work
The MMC idea is clearly illustrated. The price movement after the last major drop is mirrored on the right side:
Strong rally > Formation of lower highs > Resistance retest > Sharp decline
These mirrored behaviors often hint at psychological repetition in the market, driven by trader memory and order placement.
The bearish movement after retesting the mini resistance looks nearly identical to the previous leg on the left — reinforcing the idea that we may see a similar downside structure repeat.
🌀 3. Central Zone Area – Liquidity Trap and Reaction Point
The Central Zone Area is labeled where a previous sharp bounce occurred. This zone is critical for several reasons:
It acted as support multiple times.
It’s also where a liquidity grab occurred — shown with a long wick — before a reversal rally.
In current price action, this zone may again act as a magnet for price, as institutions seek liquidity to fuel further moves. Once price reaches it, expect a temporary bounce or reaction.
📐 4. 50% Fibonacci Retracement Confluence
The projected target sits right on the 50% retracement level of the previous bullish leg.
Institutions frequently target the 50%–61.8% Fibonacci zones to rebalance orders and create continuation moves.
This target zone is marked in purple and is aligned with historical support, adding confluence.
📉 5. Sharp Bearish Reversal from Structure
You can observe a very clear shift in momentum:
The uptrend was broken with a strong bearish engulfing candle.
That move wiped out several minor bullish structures — a sign of structure collapse.
This breakdown, combined with the resistance rejection and MMC mirroring, strongly supports a bearish continuation bias.
📊 6. Previous Targets and Structure Memory
The previous targets and historical swing points are not just annotations — they represent real zones of order flow memory.
When price revisits these levels, you often see reactions (reversals, consolidations, or continuation).
🎯 Trade Plan (Based on Chart):
Bias: Bearish
Entry Zone: After rejection confirmation at mini resistance
Target Zone: 0.00675 area (50% retracement)
Invalidation: Close above 0.00715 (Major Resistance)
✅ Conclusion:
This JPY/USD 4H chart beautifully showcases the power of technical structure, Mirror Market Concepts, and liquidity-focused trading. With a clean rejection from mini resistance, a history of mirrored bearish setups, and a confluence target at the 50% zone, this chart suggests a high-probability short opportunity for disciplined traders.
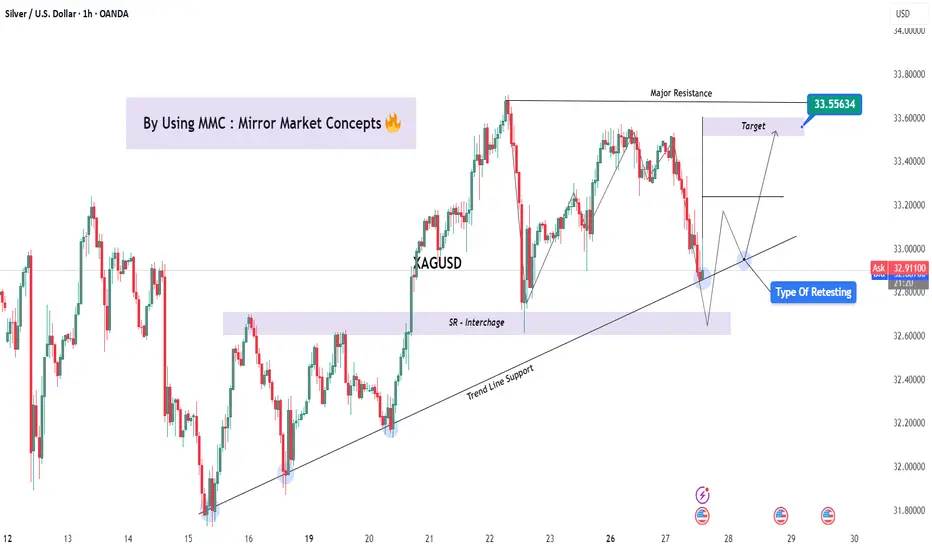
Silver (XAG/USD) | MMC Retest in Play – Eyes on $33.55 TargetThis 1-hour chart of Silver (XAG/USD) presents a clean and compelling bullish setup, applying Mirror Market Concepts (MMC) in combination with classical price action, support/resistance flips, and trendline analysis. It outlines a likely bullish continuation scenario based on how price respects key structural levels.
🧩 1. Mirror Market Concepts (MMC) Overview
MMC views the market as a symmetrical organism, where past price behavior on one side of a pattern tends to be “mirrored” on the other side. Here, we see the market reflecting previous structural behaviors through:
Symmetrical lows and highs
Balanced corrective structures
Repeatable retests of trendline support
This creates a roadmap for anticipating price reactions, especially around previously respected levels.
🔸 2. Trendline Support – Anchoring Bullish Momentum
The rising trendline is a major structural feature. It's been respected three times previously (highlighted with blue circles), providing strong bullish support.
Current price is once again approaching this trendline.
A bounce here would confirm continued higher-low structure.
If trendline is broken, it may invalidate the bullish setup — so this acts as the key decision point.
🔸 3. SR Interchange Zone (Support/Resistance Flip)
The chart marks a wide SR Interchange Zone, previously resistance, now turned into support. This flip is a critical area for accumulation and re-entry by institutional players.
Price bounced from this zone earlier.
The current structure suggests price may retest this zone again during a potential fakeout or liquidity grab.
This level is a magnet zone for stop-hunting before continuation.
🔸 4. “Type of Retesting” – MMC Style
This chart specifically labels a "Type of Retesting", which refers to a deeper liquidity sweep where:
Price breaks minor support to tap trendline or SR zone liquidity.
Then reclaims the structure and resumes the uptrend.
This is a mirror market behavior — where past retests serve as a template for future ones. Expectation is for the same type of bounce from the trendline/SR area as seen before.
🔸 5. Projected Path – Bullish Scenario
The expected flow includes:
Price dips back into the trendline + SR Interchange confluence.
Forms a higher low (marked with arrows).
Breaks minor resistance levels toward Major Resistance at $33.556.
This zone acts as the target — derived from the previous swing high and structural mirror projection.
The target zone aligns with a key Fibonacci and historical resistance level — giving extra weight to this forecast.
🔸 6. Volume and Confirmation (Trader Tip)
While volume is not shown on this chart, experienced traders would:
Watch for volume divergence or spikes near the SR zone.
Seek candle confirmation (like bullish engulfing, pin bars, or strong wicks) near the trendline/SR confluence before entering.
🎯 Trading Plan Summary:
Entry Zone: Near trendline + SR Interchange support zone.
Stop Loss: Below the SR zone or swing low.
First Target: Return to $33.20–33.30 range.
Main Target: $33.556 (marked target zone on chart).
Invalidation: Strong break and close below trendline + SR zone, with no bounce.
📘 Educational Notes (For Traders):
Trendline retests are best traded in confluence with horizontal levels.
SR flips provide high-confidence zones for reaction.
MMC adds a predictive edge by recognizing repeating behavior and structure across mirrored segments of the chart.
This setup rewards patience, especially during consolidation near major support.
⚠️ Risk Management Reminder:
Always manage risk properly. Even with high-probability setups like this, price may wick below or fake out. Wait for confirmation. Avoid over-leveraging or premature entries.
BTCUSD Curve Breakout & MMC Structure | Targeting $111KIn this idea, we apply Mirror Market Concepts (MMC), a method of analyzing symmetrical price behavior to forecast key market moves. This BTC/USD 15-minute chart showcases a beautiful execution of MMC principles, blending curved structure analysis, SR interchange, and trendline dynamics to capture a compelling bullish opportunity.
🧩 Chart Structure Analysis (Detailed Breakdown):
🔸 1. Curve Line Formation & Mirror Market Concepts (MMC):
The centerpiece of this analysis is the curved market structure, which resembles a cup-like formation. Using MMC, the market is seen as reacting in mirrored patterns — left side = right side. In this context, the curve mimics the balance of supply and demand over time, providing a visual roadmap of potential price behavior.
Curve Line Resistance: The upper black arc served as dynamic resistance.
Curve Line Support: The lower arc acted as dynamic support.
Once price broke above the curved resistance, it confirmed a bullish market structure shift, triggering a key breakout signal.
🔸 2. Breakout & Retest Pattern:
Following the curve line resistance breakout, price pulled back for a retest, validating the structure. This is a high-probability continuation setup where:
The breakout confirms bullish interest.
The retest confirms that former resistance is now support.
This retest occurred exactly near the intersection of:
Curve Line Support
SR Interchange Zone (gray shaded area)
Trendline Support
This confluence adds strength to the bullish outlook.
🔸 3. SR Interchange Zone (Support/Resistance Flip):
The horizontal SR Interchange area is a key pivot zone, where price previously faced resistance. After the breakout, price came back to this level and found strong buying interest, flipping it into support.
This acts as a reaccumulation zone.
Price rejected from this zone with a clean bullish impulse.
🔸 4. Trendline Support Validation:
After the retest, price formed a new ascending trendline, respected multiple times by price. This ascending trendline acts as a guide for trailing stop placements or re-entry zones. Price remained above this trendline, reinforcing bullish structure integrity.
🔸 5. Central Zone & Liquidity Sweep:
The Central Zone marked a midpoint in the curve, which:
Acts as a balance point between the mirrored halves.
Is often used as a liquidity grab area before direction continuation.
Price dipped into this zone, likely collecting stop orders or liquidity before reversing higher — a classic MMC behavior.
🔸 6. 50% Retracement Level:
A horizontal marker near the 50% retracement level serves as a psychological and technical barrier. As of the last candle:
Price is hovering around this midpoint.
A breakout above this level would trigger further bullish movement toward the target zone.
Traders often look for volume expansion at this point to confirm conviction.
🔸 7. Target Zone (Projected via Curve Symmetry & Range Extension):
The target zone is marked near $111,600, based on:
Mirror projection of the curve's depth (height symmetry).
Range extension from the curve’s breakout.
Potential measured move based on pre- and post-breakout range.
This level represents a logical exit or partial TP zone for long positions.
📈 Trading Plan Summary:
Entry Zone: After breakout and retest around the SR Interchange/Curve Support/Trendline Confluence.
Support Confirmation: Trendline holding and bullish structure above central zone.
Mid-Target: 50% retracement breakout ($110,400).
Main Target: $111,600+ target zone based on curve projection.
Invalidation: Clear break below trendline and loss of SR flip zone.
🔍 Educational Takeaways:
Mirror Market Concepts (MMC) are highly effective in anticipating symmetrical price behavior.
Confluence of curved breakout, SR flip, and trendline validation provides high confidence in trade setups.
Market symmetry helps define logical targets, entries, and risk zones.
Always look for a pullback to structure — the best trades often come after the breakout and confirmation.
🚨 Risk Management Reminder:
As always, proper risk management is crucial. Wait for confirmation before entering, and use stop-losses below structural levels (such as the trendline or SR Interchange zone) to limit downside risk.

Gold Price Action Analysis – Using MMC (Mirror Market Concepts) 🔍 Overview:
In this idea, we dive deep into XAU/USD's (Gold) short-term bearish move using a blend of Mirror Market Concepts (MMC) and Smart Money Concepts (SMC). The 15-minute chart provides an excellent visual of market psychology shifting, with CHoCHs, supply-demand zones, SR flips, and the Black Mind Curve highlighting the story of price.
🧩 Market Structure Breakdown:
🔵 1. Major Resistance Zone Formed
Price pushed aggressively upward but met strong rejection near the major resistance zone.
This zone acts as a ceiling for the bullish momentum—setting the first signal for a possible reversal.
🔵 2. Black Mind Curve Activated
A descending Black Mind Curve was plotted to reflect the psychological shift from bullish to bearish.
Price failed multiple times to break above this curve, highlighting strong internal weakness.
The Black Mind Curve visually reinforces the bearish tone and offers a roadmap for probable lower highs.
🔵 3. Minor Resistance + SR Interchange
As price dropped, it created a minor resistance.
When price returned to this area and rejected it, this confirmed an SR Flip (Support-Resistance Interchange)—a classic MMC feature.
Mirror Market Concepts suggest that old demand often mirrors into new supply. That's exactly what happens here.
🔵 4. Major CHoCH: Change of Character
A decisive break of the bullish structure signaled a Major CHoCH, confirming bearish order flow.
This is the moment smart money starts repositioning for shorts—liquidity has been grabbed above previous highs, and the direction shifts.
🔵 5. 50% Retracement
After the impulsive drop, price retraced nearly 50%—a key area of interest for MMC traders.
This level often acts as a decision point. In this case, price rejects the retracement, creating an ideal zone for re-entries.
🔵 6. Targeting the Demand Zone
The projected target lies in a prior demand zone, which mirrors earlier supply structure.
This aligns with MMC’s principle of "market reflection"—what was resistance becomes support again, and vice versa.
🎯 Trade Bias: Bearish
Entry Confirmation: After CHoCH + rejection from 50% level + re-alignment with Black Mind Curve.
SL: Just above the 50% retracement or last minor high.
TP: At the marked target zone near historical demand.
🧠 Why MMC Works Here:
MMC helps you see the market in reverse—where previous zones mirror and reflect. Combined with smart money triggers like CHoCHs, BOS, liquidity sweeps, and SR flips, this makes for a precise trading model that goes beyond basic support and resistance.
The beauty of MMC is that it reveals where the crowd is wrong and where the real momentum lies.
🔑 Key Takeaways for Traders:
The Black Mind Curve helps visualize hidden resistance paths.
CHoCHs are crucial in understanding market intent.
MMC allows traders to anticipate instead of react.
High probability setups form where multiple MMC/SMC elements converge.
Always wait for confirmation, not assumption.

Gold (XAU/USD) Technical Analysis – Rising Wedge Breakdown & MMC🧠 2. Introduction to Mirror Market Concepts (MMC):
MMC, or Mirror Market Concepts, is a powerful technique that views price action as symmetrical or repetitive in nature. In this scenario, we notice that the right side of the chart mirrors the left — suggesting that after this bullish climb, the market might repeat its earlier bearish behavior but in a reflected pattern.
This adds confluence to our bearish outlook and makes the forecast more robust.
🔺 3. Rising Wedge Pattern – Bearish Reversal Signal:
The most critical part of this analysis is the formation of a Rising Wedge — a classic reversal pattern. Let’s break down what it means:
Structure: The wedge is formed by two upward-sloping trendlines converging at the top.
Volume Behavior: Volume typically decreases as the wedge matures, showing that bulls are losing strength.
Psychology: Buyers keep pushing the price higher, but each move has less momentum than the last. Sellers are quietly preparing for a breakdown.
The moment price breaks below the wedge’s lower trendline, it usually triggers panic selling or aggressive short entries.
🔄 4. Key Price Levels & Zones:
Minor Resistance Zone: Price rejected near a historical resistance area, showing sellers are still active.
Previous Target Zone: This area acted as a ceiling before the rejection — important for reversal confirmation.
SR Interchange Zone: A classic zone where support becomes resistance — this adds strong confluence to the reversal idea.
🎯 Bearish Trade Plan & Take-Profit Levels:
Once the wedge breaks down, the projected move is based on measured moves and prior support levels. Here’s the breakdown:
✅ TP1 (Take Profit 1): 3,275.30 – This is the first key support level right after the wedge breakdown. Ideal for partial profits.
✅ TP2: 3,205.64 – Previous support zone from earlier consolidation. High probability target.
✅ TP3: 3,169.18 – A more extended target that aligns with historical price memory and full wedge depth.
Each TP level is supported by historical price structure and previous volume clusters.
⚠️ Risk Factors & Trade Management:
While this setup looks strong, always consider:
False Breakouts : Wedges can fake out traders. Wait for candle close confirmation below the wedge.
News Events : Macroeconomic announcements (especially U.S. dollar data) can reverse technical setups.
Risk-to-Reward: Don’t enter without calculating your stop loss above the wedge and aiming for at least a 1:2 ratio.
🧠 Conclusion – What This Setup Tells Us:
This chart is a perfect blend of price action + market symmetry (MMC). The rising wedge signals that bulls are running out of steam, while MMC suggests a mirrored decline could follow.
If price action confirms the breakdown with momentum and volume, this could be a high-probability short setup for swing traders and intraday players alike.

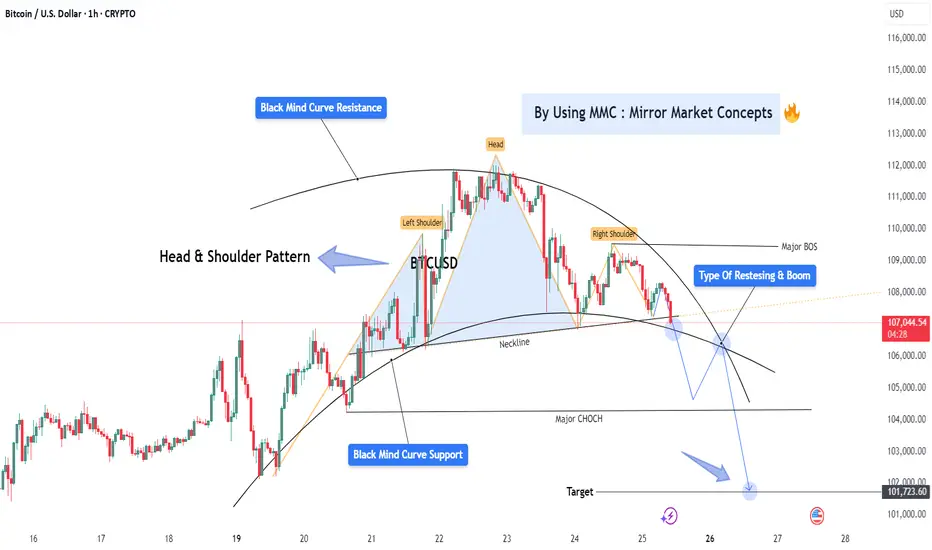
BTCUSD MMC Breakdown – Curve Collapse & H&S Sell-Off Loading🔍 Chart Overview – BTC/USD (1H Timeframe)
This setup uses Mirror Market Concepts (MMC) to forecast Bitcoin’s next potential major move, blending institutional-level curve analysis, pattern recognition, and structure shifts.
We are currently seeing a Head & Shoulders (H&S) pattern develop under a Black Mind Curve Resistance, supported by a sloping neckline and a clear zone of structure breaks and retests. Price is positioned for a significant bearish continuation if confirmation hits.
📐 Breakdown of Key Components:
🧠 1. Mirror Market Concepts (MMC)
MMC focuses on the symmetry and memory of market behavior. When certain price structures mirror past reactions (support, resistance, or rejection points), we gain an edge in anticipating where big moves will happen.
Here, the curve structure and neckline level align to mirror prior bearish reactions.
👤 2. Head & Shoulders Pattern
Left Shoulder: Formed with rising volume and strong bullish momentum.
Head: A sharp move upward forming a new high, but eventually fails to sustain above the curve.
Right Shoulder: A weaker bullish attempt, indicating exhaustion and imbalance.
The neckline is clearly marked — a break below it validates the reversal pattern.
🟠 3. Black Mind Curve Resistance
This is an institutional resistance arc — an MMC dynamic level that mirrors prior selling patterns. Price reacted strongly under this curve, confirming its relevance.
It acted as a ceiling for the head formation, capping bullish continuation and turning price downward.
🔵 4. Black Mind Curve Support
Drawn beneath the price action, this dynamic support is about to be tested again. A clean break below the curve and neckline would likely result in a strong drop.
⚠️ 5. Major CHoCH & BOS Zones
CHoCH (Change of Character): Price failed to form new highs and showed early bearish shift.
BOS (Break of Structure): Confirmed when neckline is broken.
These are vital MMC confirmation points that strengthen the short idea.
🔁 6. Retest & Boom (Bearish Version)
Price could retest the neckline or the broken trendline (shown by the blue arrows), offering a perfect "sell on retest" opportunity before dropping to the target.
This is a classic MMC play — breakdown ➝ retest ➝ continuation.
🎯 7. Target Zone
Projected based on:
Height of the H&S pattern.
Previous key structure zone.
MMC symmetry principles.
Expected target: near $101,700 – $102,000.
🧨 Trade Idea:
✅ Bearish Setup (Preferred Bias)
Wait for a clean neckline break and candle close.
Look for retest of neckline or curve (lower timeframes).
Sell with target near $101,700, SL above right shoulder.
🚫 Invalidation:
Price closes back above right shoulder and curve.
Invalidates the bearish structure.
Gold 4H VIP Move – MMC Curve Break or Bounce?📈 Market: XAUUSD – 4H Timeframe
This setup is based on Mirror Market Concepts (MMC), a method that reflects the idea of market symmetry, key structural levels, and curve dynamics (institutional behavior). We’re looking at how price interacts with historically significant zones, demand transfers, and resistance curves.
🔍 Full Chart Analysis Breakdown:
1. ⚙️ Mirror Market Concepts (MMC)
MMC focuses on how past price actions "mirror" into the future. If a zone caused a strong move before, it can likely do it again — either by rejecting price or acting as a magnet for liquidity. You can see how historical supply and demand zones still influence price today.
2. 🧱 Major Resistance Zone (Top Blue Zone: ~$3,470 – $3,520)
This is a historical supply area where sellers were previously dominant.
Every time price enters this zone, it reacts with strong selling pressure.
Watch closely: a clean breakout + retest above this zone could open the door to higher time frame bullish continuation.
3. 🚧 Black Mind Curve Resistance (Orange Arc)
A dynamic resistance level based on institutional selling behavior over time.
This curve aligns with historical highs and retracements, suggesting smart money is actively defending this region.
Price is now testing this curve — either it gets rejected and drops, or breaks above for a breakout boom.
4. 🟦 Mini Reversal Zone (Around $3,400)
This zone sits right under the curve and major resistance, making it a critical decision point.
A strong reaction here could mean a short-term selloff, but if broken, this zone could flip into support, validating the breakout.
5. 📉 Trending Support Line (Upward Diagonal)
Acting as short-term bullish support.
As price pulls back, this trendline could catch the dip, causing a bounce toward the reversal or major resistance zone.
You can also call this the "retest and boom" line, as seen in your chart’s annotation.
6. 🧊 Demand Transferred (Mid-Zone Shift)
Shows where institutional demand entered and was then shifted upward to support the rally.
This is a powerful MMC concept — demand didn’t disappear, it just migrated up, forming new support levels.
7. 🔄 SR Interchange Zone (~$3,160 – $3,200)
Classic support/resistance flip zone.
If the trendline and mid-zone fail, price might drop here to collect liquidity and trigger new buy orders.
This is your “last stand” zone for bulls.
8. 🧱 Break of Structure (BOS) Confirmation
BOS already occurred earlier on the chart — this confirms bullish shift in structure.
Now, price is looking to retest the previous high or break it entirely.
🎯 Trade Scenarios
✅ Bullish Setup (Base Case):
Price continues to hold above the trending support.
Breaks mini reversal zone + Black Curve Resistance.
Retests the zone (validation).
Pushes toward the Major Resistance Zone ($3,470 – $3,520).
⚠️ Bearish Setup (If Rejected):
Price hits the curve and mini reversal zone and gets rejected hard.
Drops back to trending support, possibly breaks it.
Targets SR Interchange Zone (~$3,160 – $3,200) as the next buy zone.
💬 Mind / Trading Wisdom:
“Price doesn’t lie. It reacts. Let it show you the intention — breakout or rejection. Follow MMC structure, respect the curve resistance, and let price action guide your entries.”
📌 Summary for Traders:
Concepts Used: Mirror Market Concepts (MMC), Curve Resistance, SR Flip, Demand Transfer, BOS.
Current Price Action: Testing reversal zone + curve.
Bias: Bullish but cautiously watching for rejection.
Next Levels: Watch $3,400 – $3,520 for decision. Retest = entry. Rejection = liquidity hunt.
