Mitigation Block in Forex Trading: What It Is and How to Use It?What a Mitigation Block Is, and How You Can Use It When Trading Forex?
Understanding specific market mechanisms like mitigation blocks may enhance strategic decision-making. This article delves into the concept of mitigation blocks, detailing their definition, function, and practical application within forex.
Definition and Function of a Mitigation Block
A mitigation block in forex trading refers to a specific order block on a chart that indicates where previous movements have stalled and reversed, marking it as a potential area for future market turns. This concept within the Smart Money framework is crucial for traders looking to manage their positions by taking advantage of strategic entry and exit points.
The idea behind these areas is rooted in the dynamics of supply and demand within forex. When a currency pair reaches a level where buyers or sellers have previously entered the market in force, causing a reversal, it suggests a potential repeat of such actions when the price returns to the area.
Characteristics and How to Identify a Mitigation Block
Mitigation blocks can be bullish or bearish, each with distinct characteristics:
- Bearish Mitigation Block: This type forms during an uptrend and is identified by a significant peak followed by a decline and a failed attempt to reach or surpass the previous high, creating a lower high. When prices drop below the previous low, the order block above the low becomes mitigation. It may be characterised by an increase in selling volume as the price approaches the level, signalling resistance and a potential downward reversal.
- Bullish Mitigation Block: Conversely, a bullish type is established during a downtrend. It is characterised by a significant trough, followed by a rise to form a higher low, and a failure to drop below the previous low. As the pair moves up, the order block below the high marks mitigation one. This area often shows an increase in buying volume as the price approaches, indicating support and a potential upward reversal.
Mitigation Block vs Breaker Block
Mitigation and breaker blocks are both significant in identifying potential trend reversals in forex trading, but they have distinct characteristics that set them apart. A mitigation block forms after a failure swing, which occurs when the market attempts but fails to surpass a previous peak in an uptrend or a previous trough in a downtrend. The pattern indicates a loss of momentum and a potential reversal as the price fails to sustain its previous direction.
On the other hand, a breaker block is characterised by the formation of a new high or low before the market structure is broken, indicating that liquidity has been taken. This means that although the trend initially looked set to continue, it quickly reverses and breaks structure.
In effect, a breaker appears when the market takes liquidity beyond a swing point before reversing the trend. A mitigation appears when the price doesn’t move beyond the trend’s most recent high or low, instead plotting a lower high or higher low before reversing the trend.
How to Use Mitigation Blocks in Trading
Areas of mitigation in trading can be essential tools for identifying potential trend reversals and entry points. When they align with a trader's analysis that anticipates a reversal at a certain level, it can serve as a robust confirmation for entry.
Traders can effectively utilise these zones by simply placing a limit order within the area once it is considered valid. Validation occurs after a new peak or trough is established following the initial failure swing that forms the mitigation area.
If a liquidity void or fair-value gap is present, the trader may look for such a gap to be filled before their limit order is triggered, potentially offering a tighter entry. Stop losses might be placed beyond the failure swing or the most extreme point.
Furthermore, if a mitigation block is identified on a higher timeframe, traders can refine their entry by switching to a lower timeframe. This approach allows for a tighter entry point and potentially better risk management, as it offers more granular insight into the momentum around the area.
Common Mistakes and Limitations
While these blocks are valuable for forex trading, they come with potential pitfalls and limitations that traders should know.
- Overreliance: Relying solely on mitigation blocks without corroborating with other trading indicators can lead to misjudged entries and exits.
- Ignoring Context: Using these zones without considering the broader market conditions may result in trading against a prevailing strong trend.
- Misinterpretation: Incorrect identification can lead to erroneous trading decisions, especially for less experienced traders.
- False Signals: Mitigation blocks can sometimes appear to signal a reversal but instead lead to a continuation of the trend, trapping traders in unfavourable positions.
The Bottom Line
Understanding mitigation blocks offers traders a strategic edge in navigating the forex market. They can be vital for recognising potential price reversals and improving trading outcomes.
FAQs
What Is a Mitigation Block?
A mitigation block in forex trading is an order block that identifies potential reversal points. It signals where a currency pair has previously stalled, indicating strong buying or selling pressure, suggesting a potential for similar reactions in future encounters with these levels.
How Do You Identify a Mitigation Block?
Mitigation blocks are identified by analysing charts for areas where previous highs or lows were not surpassed, leading to a reversal. Traders look for a sequence of movements, including a swing high or low followed by a retracement that fails to exceed the previous swing.
What Is the Difference Between a Breaker Block and a Mitigation Block?
While both indicate potential reversals, a breaker block forms when the price makes a new high or low before reversing, suggesting a temporary continuation of the trend. In contrast, a mitigation block forms without creating a new extreme, indicating a direct loss of momentum and an immediate potential for reversal.
This article represents the opinion of the Companies operating under the FXOpen brand only. It is not to be construed as an offer, solicitation, or recommendation with respect to products and services provided by the Companies operating under the FXOpen brand, nor is it to be considered financial advice.
Mitigation

ICT Breaker & Mitigation Blocks EXPLAINEDToday, we’re diving into two powerful concepts from ICT’s toolkit that can give you an edge in your trading: Breaker Blocks and Mitigation Blocks. There are one of my favourite PD Arrays to trade, especially the Breaker Block. I’m going to explain how I interpret them and how I incorporate them into my trading. Stay tuned all the way to the end because I’m going to drop some gold nuggets along the way"
Ok, so first of all let’s go through what both these PD Arrays look like and what differentiates them, because they are relatively similar and how they are used is practically the same.
On the left we have a Breaker Block and on the right a Mitigation Block. They both are reversal profiles on the timeframe you are seeing them on, and they both break market structure as you can see here. The actual zone to take trade from, or even an entry from, in the instance of this bearish example is the nearest down candle or series of down candles after price makes a lower low. When price pulls back to this area, one could plan or take a trade.
The defining difference is that a Breaker raids liquidity on its respective timeframes by making a higher high or lower low before reversing, whilst a Mitigation Block does not do that. For this reason, a Breaker is always a higher probability PD Array to trade off from. As you should know by now if you are already learning about PD Arrays such as these is that the market moves from one area to liquidity to another. If you don’t even know what liquidity is, stop this video and educate yourself about that first or you will just be doing yourself a disservice.
Alright, so let’s go see some real examples on the chart. Later on I’ll give you a simple mechanical way to trade them, as well as a the discretionary approach which I use. And of course, some tips on how to increase the probability of your setups.

EURJPY "seems" ready to short from BSL/H4 OB mitigationAs price took out not only BSL and mitigated an H4 OB, I do speculate price to sell and find support at the D-OB below / 79% retracement fib level (157.200). There's some news event for JPY coming out Sunday at 7:50 EST to which I wonder if this will drive price down to support at 157.200

GBPUSD Liquidity Inducement SetupThe price is in Daily Resistance Zones it is wise to be only interested in SELL positions
The price has made a Significant CHOCH at H4 and the ORDER BLOCK that caused this has been MITIGATED
BSL(Buy Side Liquidity) is made below the ORDER BLOCK and it is expected for the price to HUNT the BSL in order to continue it's downward move to reach DEMAND ZONES that were the ORIGINS of previous uptrend
the price obviously has BUY IMBALANCE and this acts like GRAVITY and pulls the price down to re-enter BUY ORDERS

Bearish March for $SPYI have strong belief that it will be a good time to short the market in March. Last month $SPY went up to grab liquidity(short stops) from the recent high of December at $410 with a lack of displacement. AMEX:SPY also came back to test a mitigation block that was formed at the beginning of the bear run in Feb. 2022.
If it closes the month of March below the next recent high, which would be 431.73, I will be looking to short with a target around $348

after result us 30 hello tradres i have done a pre breakout strategy if you want to learn follow me it is possible to make money click that follow that

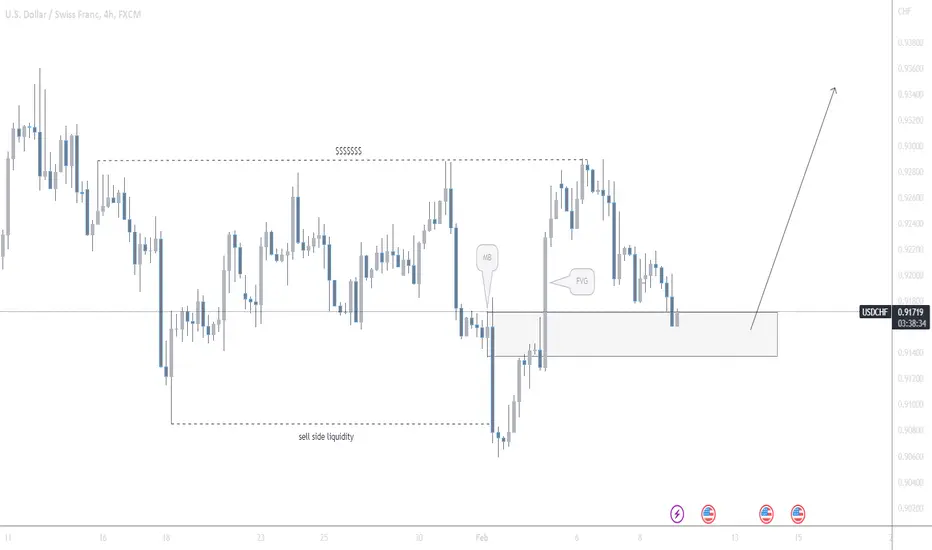
USDCHF LONGSsell side liquid run complete
higher high
return to mitigation block
FVG fill
to the moon, not to mention the fat weekly wiks that were left behind after its liquid run
US30 long break downThis is a US30 long that i am currently in. its top down anaylsis from htf to ltf entry with targets. I do belive we are looking at lower pricing on DXY also which helped confluence this trade.

Mitigation moveChange of character ,went back to mitigation zone. then pushing don again
OANDA:US30USD

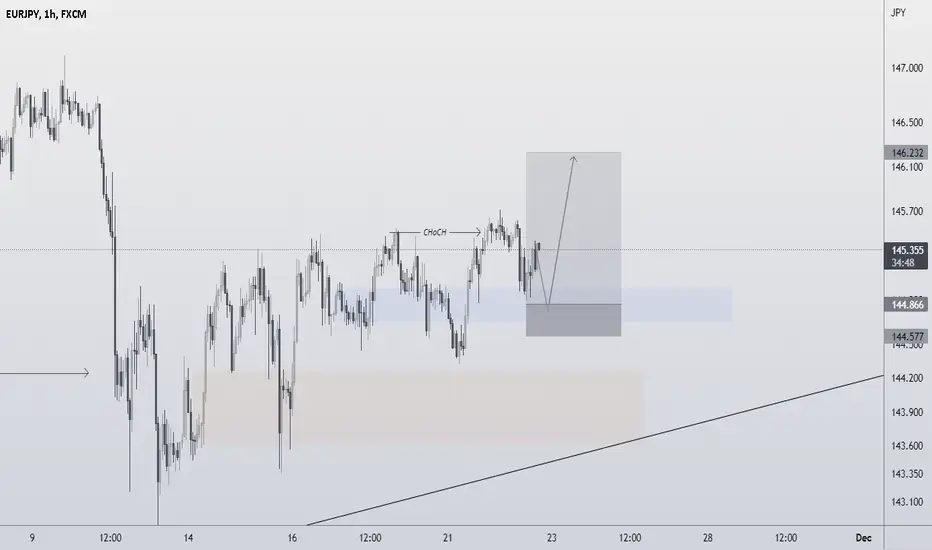
EURJPYThe price has recently made a CHoCH and now according to my strategy it will now mitigate below in the demand zone which it already has now the price should make a BOS. lets see what happens?
DXY BULLISH towards Buy side liquidityWe can see the Dollar Index moving towards the daily highs by means of trendline liquidity.
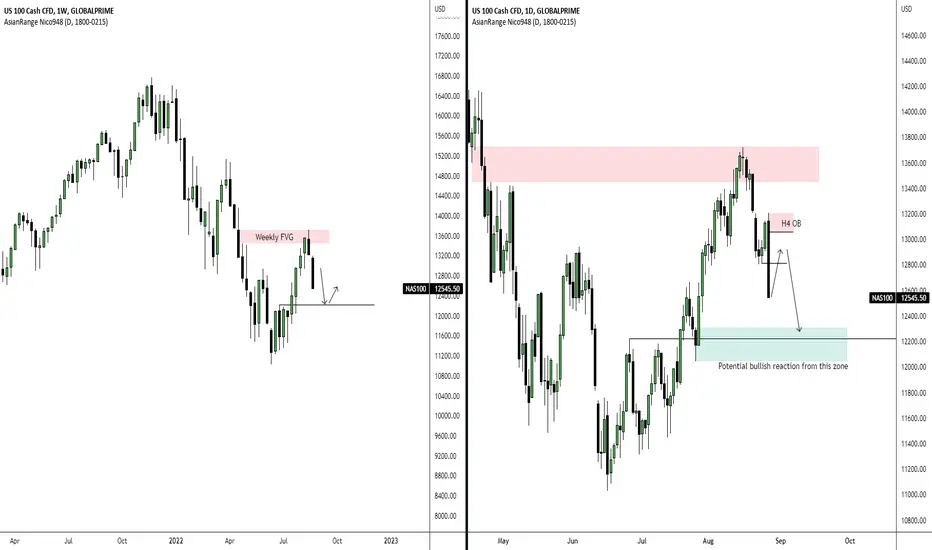
Nasdaq Higher Timeframes AnalysisPrice potentially formed a lower high filling the fair value gap on the weekly timeframe. Potential short from the H4 order block to continue lower and tap into the daily demand zone. Potential bullish reversal on the daily demand.
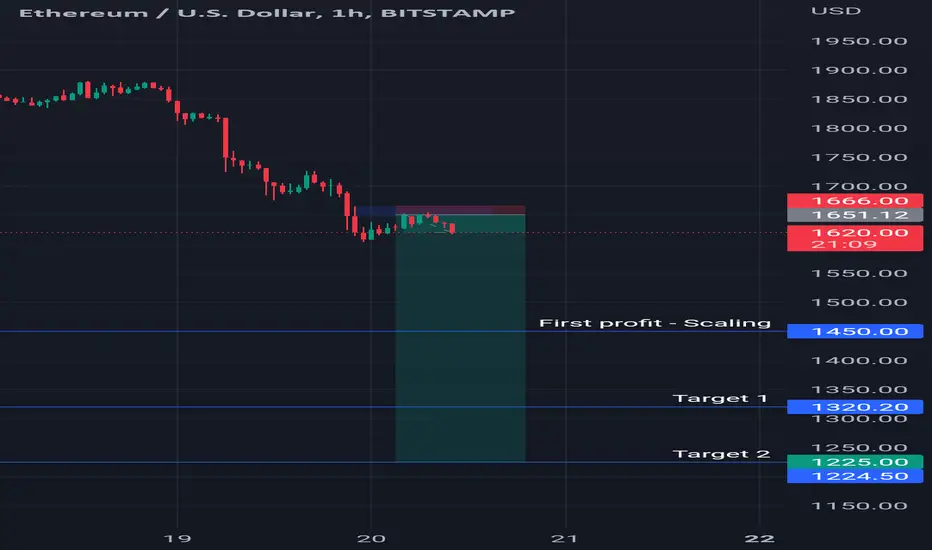
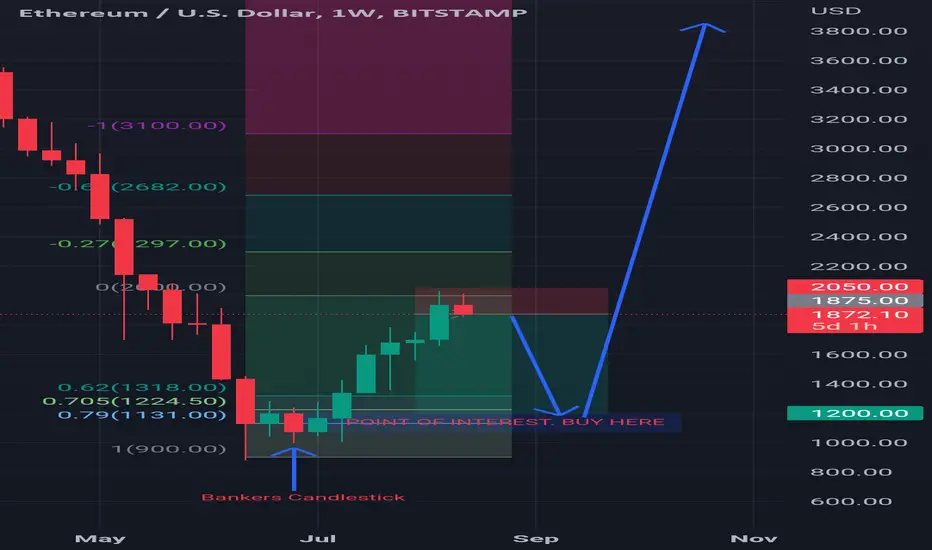
ETH/USD the dump before the pumpSell now, stoploss 1640.
First profit - 1450
Target 1 - 1320.20
Target 2 - 1224.5
Wait to buy when price is close to 1225 area.
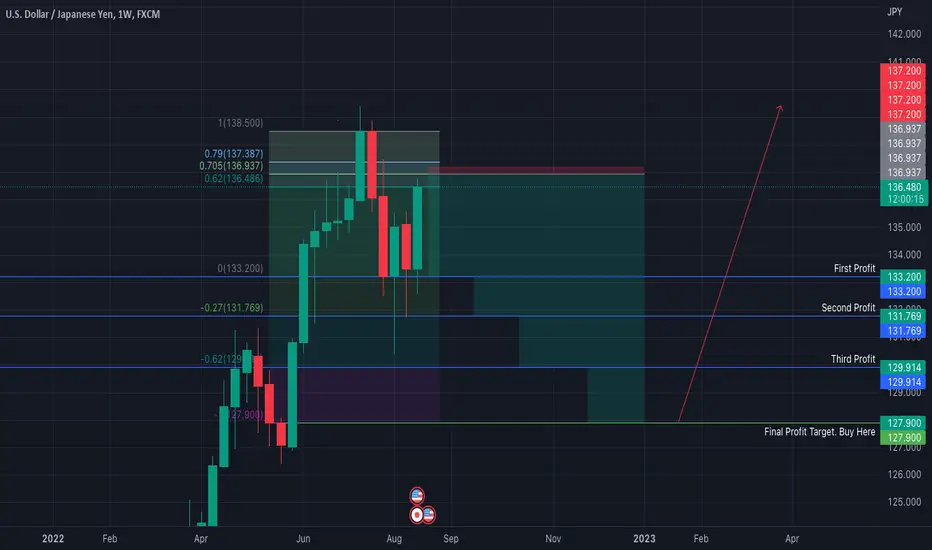
USDJPY SELLLIMIT ORDERSPrice is filling IPA(Imbalance) to mitigate the open price of a institutional candle on the 4h timeframe. The open price of this candlestick is 136.937 which is a high probable reversal point. Don't get caught on the wrong side of where you think the banks might move price.
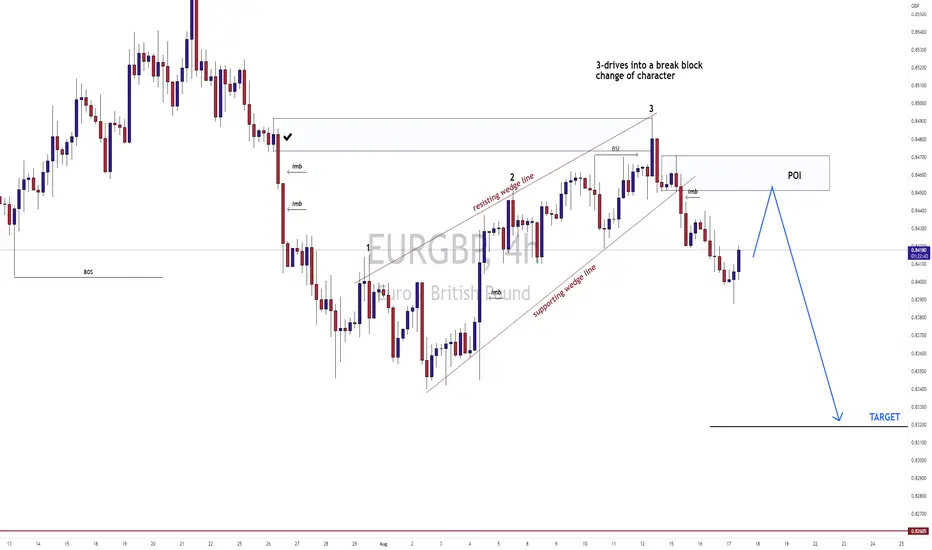
EURGBP SHORT SETUPEURGBP: price was converging in a rising wedge towards the breaker block, after mitigating from this block we got a break of supporting wedge line and change of character to bearish side on local structure, overall trend is bearish. I expect this pair to continue as marked on the chart.
Ethereum Short AnalysisEthereum is bearish for the next couple of weeks until further notice. Price broke structure to the upside on the daily timeframe and is looking to drop heavily to $1200 area. On the weekly timeframe, banks did not yet mitigate their positions at the open price of the last bearish move down, before the up move that broke daily structure. Before ethereum continues the uptrend journey to new all time high prices, we're looking to take this short, all the way to $1200 and then getting into long positions at $1200. This is not financial advice.
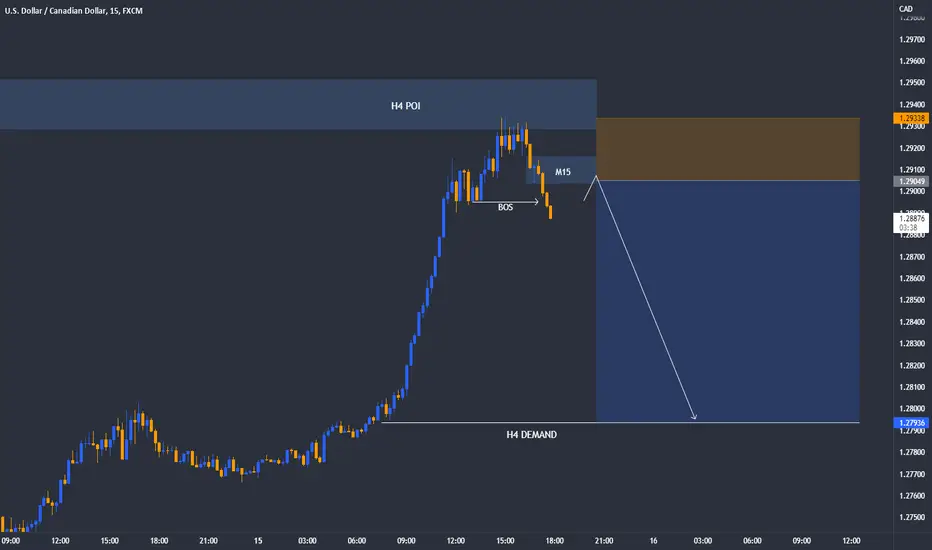
USDCADUSDCAD has reached the H4 POI from a massive bullish move . we are expecting prize to fill all the imbalance that was left by the prize. we are waiting for a M15 CHOCH and we will go short
NZDCHFPrize has been in a down trend for a couple of days. it has broken the previous lower low on the H4 timeframe . as of now prize has come back into the H4 Supply zone that broke the LL to mitigate it. we are expecting prize to go down to the sell side liquidity from the supply zone.

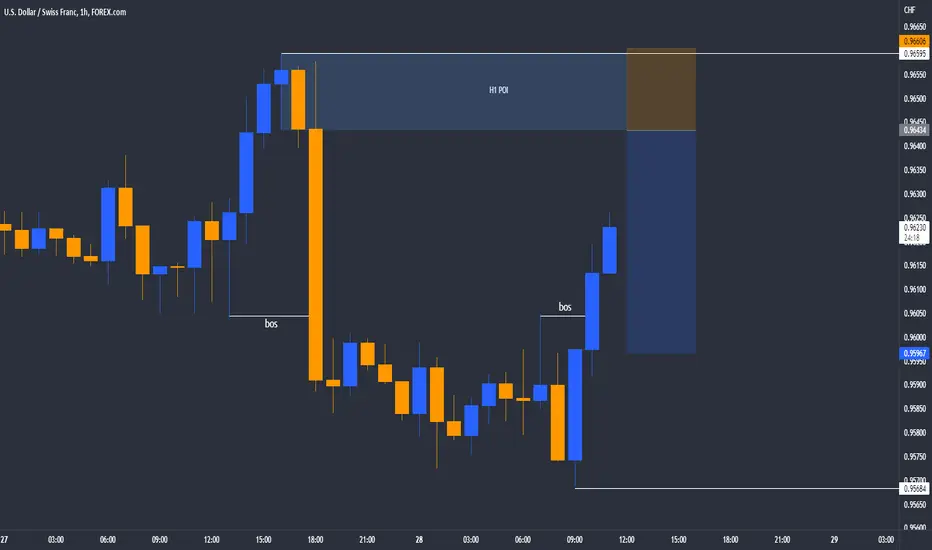
USDCHFprize is in a downtrend. though it has reached a probable Demand zone it has made a new LL. now it is approaching the H1 POI that that broke structure to the downside. once it gets there we will waith for a proper confirmation to go short since it s coming from a demand zone. we will take our profits at the 50 Fib discounted prize zone since there is a high probability of it making a choch
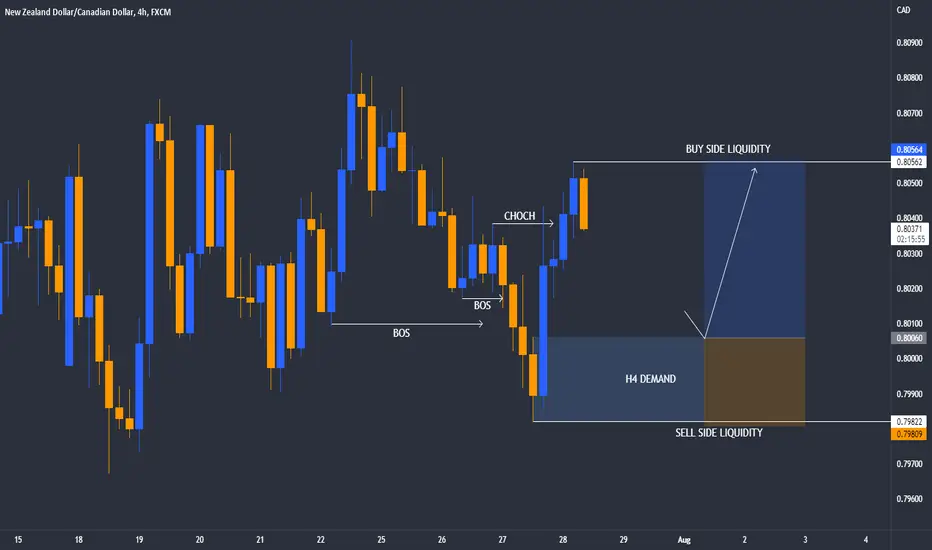
NZDCAD Prize was in a down trend for a couple of days and suddenly changed direction hence breaking the LH . the move that broke the HL is what we marked our H4 demand that caused a CHOCH. we are waiting for prize to come back to fill any imbalance left hence mitigating the order block. once prize come into that H4 demand we are anticipating prize to move up to create a new HH.
EURUSD H4 - SHORTPrices broke H4 low, leaving behind a supply for us to get involved. Look for ways to SHORT eurusd as we expect bearishness within this H4 leg at the least.

CADJPY H4 - SHORTPrices broke H4 low, leaving behind a supply for us to get involved. Look for your favourite entry technique on the lower timeframe to "confirm" the supply area.
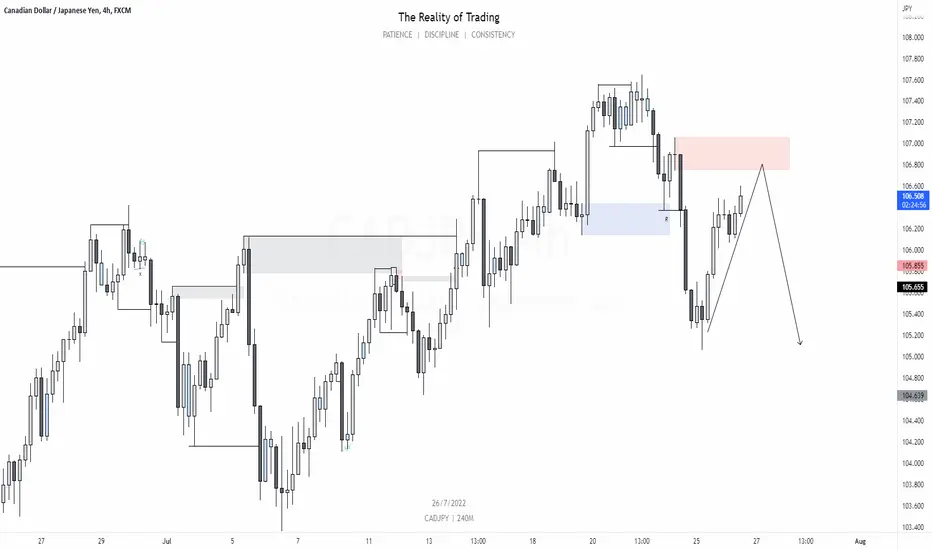
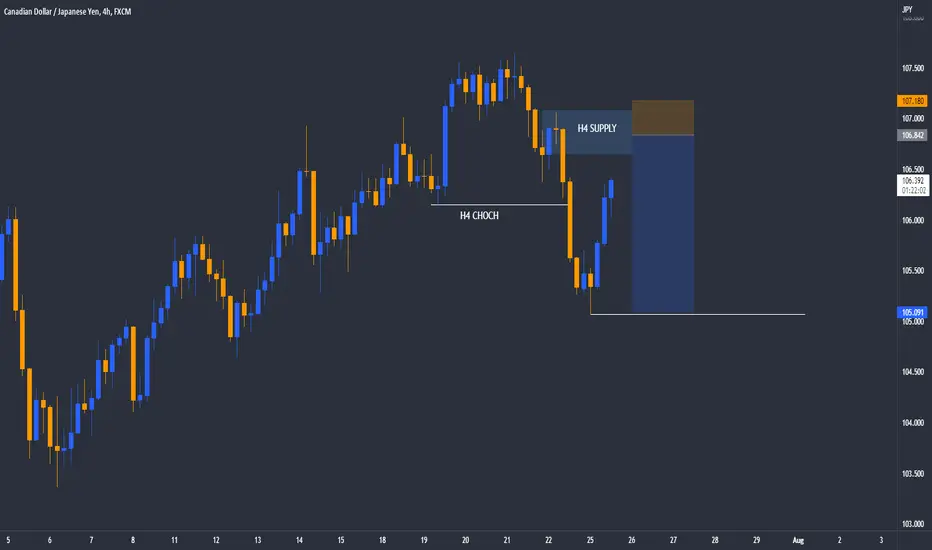
CADJPYPRIZE IS APPROACHING THE h4 supply that broke the previous low that caused H4 CHOCH. WE are anticipating that bears will jump in once we get the m15 choch and mitigation of the m15 OB that that will have caused the choch