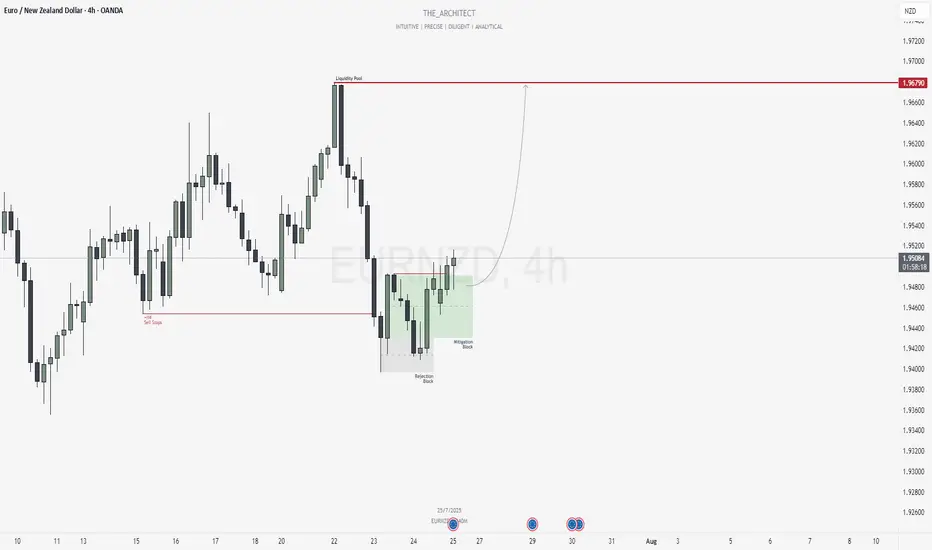
EURNZD: Bullish Shift and Institutional Re-Entry from SupportGreetings Traders,
In today’s analysis of EURNZD, we observe that institutional order flow on the H4 timeframe has recently shifted bullish. This alignment now provides us with a clear bias to seek buying opportunities in line with the predominant higher timeframe trend.
Higher Timeframe Context:
The weekly timeframe is currently delivering bullish order flow. With the recent bullish market structure shift (MSS) on the H4, we now have confluence across both timeframes, which strengthens our confidence in seeking long setups on lower timeframes.
Key Observations on H4:
Sell Stop Raid & Structural Rejection: Price action recently swept sell-side liquidity, a typical behavior indicating institutional order pairing. Following this, price attempted to move lower but failed to break the previous low, instead being supported by a Rejection Block. This led to a bullish market structure shift—our key signal of trend continuation.
Mitigation Block Entry Zone: Price has since retraced into a Mitigation Block—an area where previous institutional selling occurred. The purpose of this pullback is to mitigate earlier positions and initiate fresh buying orders. This now becomes our zone of interest for potential confirmation entries towards the upside.
Trading Plan:
Entry Strategy: Look for lower timeframe confirmation entries within the H4 Mitigation Block.
Target: The objective is to target the H4 liquidity pool residing at premium prices, aligning with the discount-to-premium delivery model.
For a detailed market walkthrough and in-depth execution zones, be sure to watch this week’s Forex Market Breakdown:https://tradingview.sweetlogin.com/chart/EURNZD/BZC9xW1L-July-21-Forex-Outlook-Don-t-Miss-These-High-Reward-Setups/
As always, remain patient and disciplined. Wait for confirmation before executing, and manage your risk accordingly.
Kind Regards,
The Architect 🏛️📈
Mitigationblock
Mitigation Block in Forex Trading: What It Is and How to Use It?What a Mitigation Block Is, and How You Can Use It When Trading Forex?
Understanding specific market mechanisms like mitigation blocks may enhance strategic decision-making. This article delves into the concept of mitigation blocks, detailing their definition, function, and practical application within forex.
Definition and Function of a Mitigation Block
A mitigation block in forex trading refers to a specific order block on a chart that indicates where previous movements have stalled and reversed, marking it as a potential area for future market turns. This concept within the Smart Money framework is crucial for traders looking to manage their positions by taking advantage of strategic entry and exit points.
The idea behind these areas is rooted in the dynamics of supply and demand within forex. When a currency pair reaches a level where buyers or sellers have previously entered the market in force, causing a reversal, it suggests a potential repeat of such actions when the price returns to the area.
Characteristics and How to Identify a Mitigation Block
Mitigation blocks can be bullish or bearish, each with distinct characteristics:
- Bearish Mitigation Block: This type forms during an uptrend and is identified by a significant peak followed by a decline and a failed attempt to reach or surpass the previous high, creating a lower high. When prices drop below the previous low, the order block above the low becomes mitigation. It may be characterised by an increase in selling volume as the price approaches the level, signalling resistance and a potential downward reversal.
- Bullish Mitigation Block: Conversely, a bullish type is established during a downtrend. It is characterised by a significant trough, followed by a rise to form a higher low, and a failure to drop below the previous low. As the pair moves up, the order block below the high marks mitigation one. This area often shows an increase in buying volume as the price approaches, indicating support and a potential upward reversal.
Mitigation Block vs Breaker Block
Mitigation and breaker blocks are both significant in identifying potential trend reversals in forex trading, but they have distinct characteristics that set them apart. A mitigation block forms after a failure swing, which occurs when the market attempts but fails to surpass a previous peak in an uptrend or a previous trough in a downtrend. The pattern indicates a loss of momentum and a potential reversal as the price fails to sustain its previous direction.
On the other hand, a breaker block is characterised by the formation of a new high or low before the market structure is broken, indicating that liquidity has been taken. This means that although the trend initially looked set to continue, it quickly reverses and breaks structure.
In effect, a breaker appears when the market takes liquidity beyond a swing point before reversing the trend. A mitigation appears when the price doesn’t move beyond the trend’s most recent high or low, instead plotting a lower high or higher low before reversing the trend.
How to Use Mitigation Blocks in Trading
Areas of mitigation in trading can be essential tools for identifying potential trend reversals and entry points. When they align with a trader's analysis that anticipates a reversal at a certain level, it can serve as a robust confirmation for entry.
Traders can effectively utilise these zones by simply placing a limit order within the area once it is considered valid. Validation occurs after a new peak or trough is established following the initial failure swing that forms the mitigation area.
If a liquidity void or fair-value gap is present, the trader may look for such a gap to be filled before their limit order is triggered, potentially offering a tighter entry. Stop losses might be placed beyond the failure swing or the most extreme point.
Furthermore, if a mitigation block is identified on a higher timeframe, traders can refine their entry by switching to a lower timeframe. This approach allows for a tighter entry point and potentially better risk management, as it offers more granular insight into the momentum around the area.
Common Mistakes and Limitations
While these blocks are valuable for forex trading, they come with potential pitfalls and limitations that traders should know.
- Overreliance: Relying solely on mitigation blocks without corroborating with other trading indicators can lead to misjudged entries and exits.
- Ignoring Context: Using these zones without considering the broader market conditions may result in trading against a prevailing strong trend.
- Misinterpretation: Incorrect identification can lead to erroneous trading decisions, especially for less experienced traders.
- False Signals: Mitigation blocks can sometimes appear to signal a reversal but instead lead to a continuation of the trend, trapping traders in unfavourable positions.
The Bottom Line
Understanding mitigation blocks offers traders a strategic edge in navigating the forex market. They can be vital for recognising potential price reversals and improving trading outcomes.
FAQs
What Is a Mitigation Block?
A mitigation block in forex trading is an order block that identifies potential reversal points. It signals where a currency pair has previously stalled, indicating strong buying or selling pressure, suggesting a potential for similar reactions in future encounters with these levels.
How Do You Identify a Mitigation Block?
Mitigation blocks are identified by analysing charts for areas where previous highs or lows were not surpassed, leading to a reversal. Traders look for a sequence of movements, including a swing high or low followed by a retracement that fails to exceed the previous swing.
What Is the Difference Between a Breaker Block and a Mitigation Block?
While both indicate potential reversals, a breaker block forms when the price makes a new high or low before reversing, suggesting a temporary continuation of the trend. In contrast, a mitigation block forms without creating a new extreme, indicating a direct loss of momentum and an immediate potential for reversal.
This article represents the opinion of the Companies operating under the FXOpen brand only. It is not to be construed as an offer, solicitation, or recommendation with respect to products and services provided by the Companies operating under the FXOpen brand, nor is it to be considered financial advice.

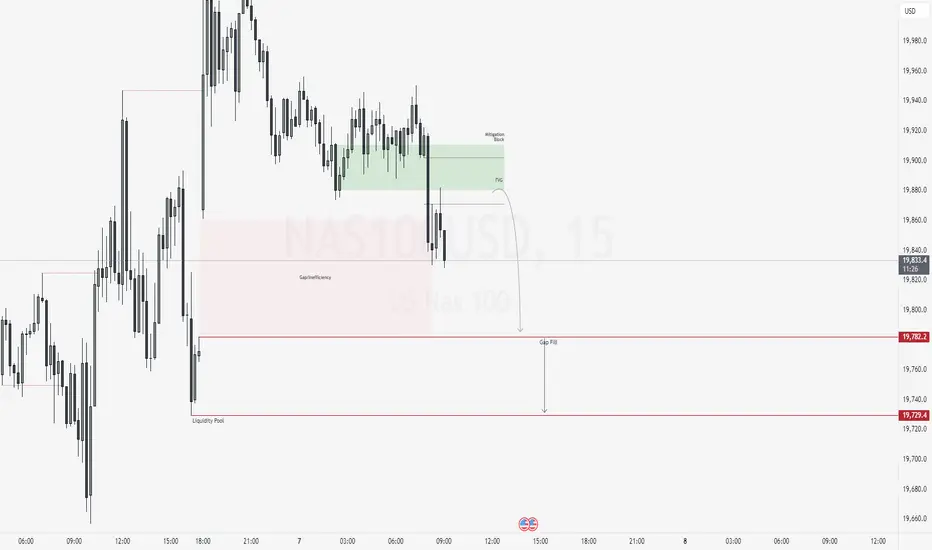
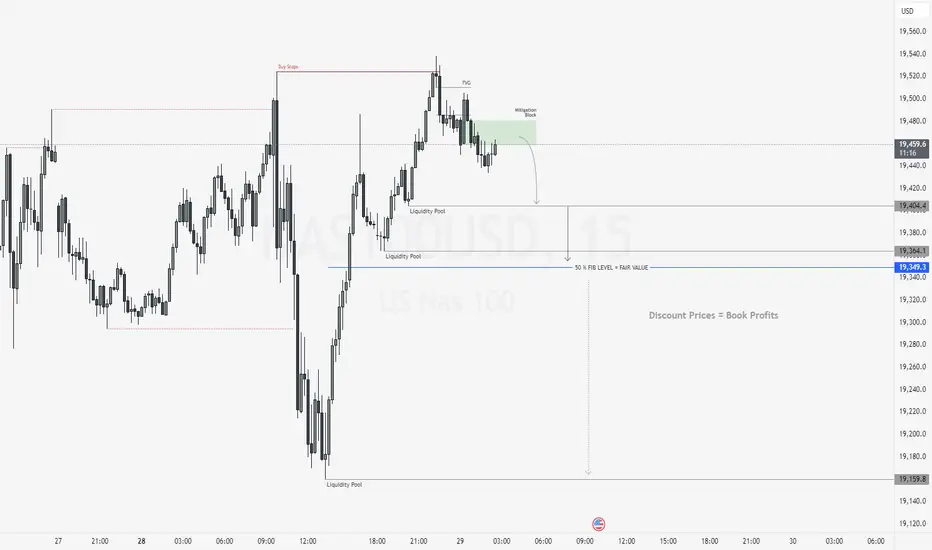
NAS100USD: Volatility Opens Door for Sell Setup in NY SessionGreetings Traders,
As we enter the New York session—a period known for heightened volatility—we note that NAS100USD remains in a broader bullish environment. However, current price action suggests the potential for a short-term reversal, prompting us to explore selling opportunities.
Key Observations:
1. Bearish Internal Structure Developing:
Despite the overall bullish trend, internal price action reveals a sequence of lower lows, indicating the formation of a bearish microstructure. This internal weakness is reflected in the way bearish arrays—such as mitigation blocks and fair value gaps (FVGs)—continue to act as resistance zones.
2. Mitigation Block & FVG Alignment:
Recently, price delivered a strong displacement to the downside, followed by a retracement into a mitigation block that aligns with a fair value gap. This confluence reinforces the bearish bias and suggests institutional selling may be active in this zone.
3. Downside Targets – Gap Fill & Liquidity Pools:
The first downside target is a nearby inefficiency (gap) in price action, which the market often seeks to fill. The second target lies below, where sell-side liquidity pools are likely resting.
Trading Plan:
Monitor price behavior within the current resistance zone. If confirmation of continued bearish momentum appears, short positions targeting the aforementioned levels may be viable.
Stay focused and wait for confirmation before committing to any positions.
Kind Regards,
The Architect
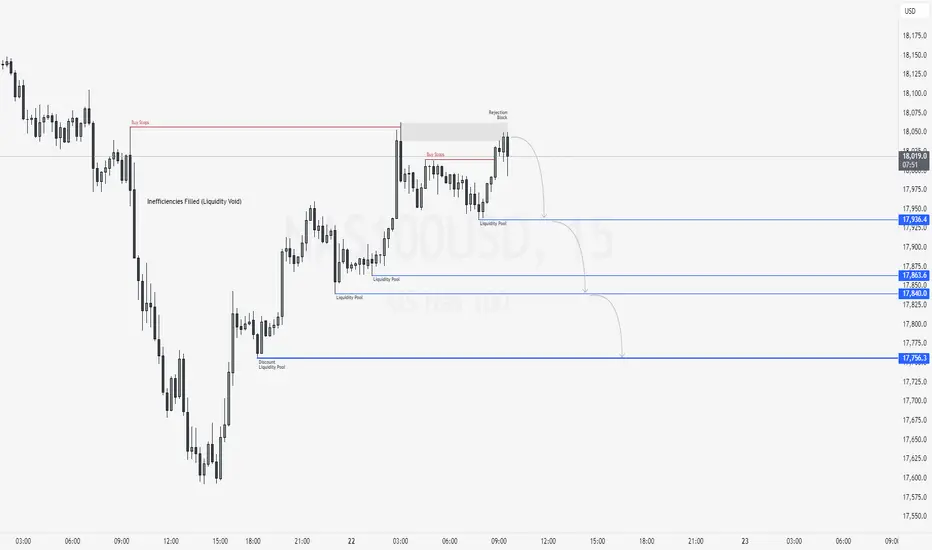
NAS100USD: Bearish Setup Builds as Price Retests Key Supply ZoneGreetings Traders,
In today’s analysis on NAS100USD, we continue to observe bearish institutional order flow, and as such, our objective is to align our trading opportunities with this directional bias.
Key Observations:
1. Bearish Break of Structure and Retracement:
Following a clear bearish break of structure, price has retraced into a mitigation block. This zone represents an area where institutional buying previously occurred. As price trades back into it, institutions often mitigate those earlier positions and reintroduce sell-side interest—offering us an opportunity to follow their lead.
2. Confluence at the Mitigation Block:
The mitigation block is further reinforced by the presence of a bearish order block, adding strength to the resistance zone. This alignment suggests the area may serve as a high-probability reversal point for bearish continuation.
Liquidity Sweep Scenario:
There remains a possibility that price may take out nearby buy-side liquidity (buy stops) before continuing downward. If this occurs, we will wait for confirmation before entering short positions, maintaining alignment with the overall bearish narrative.
Trading Plan:
Upon confirmation of rejection at the mitigation zone, we will seek to engage in short setups targeting liquidity pools in discount pricing zones.
Remain patient, disciplined, and ensure each trade aligns with your strategy.
Kind Regards,
The Architect

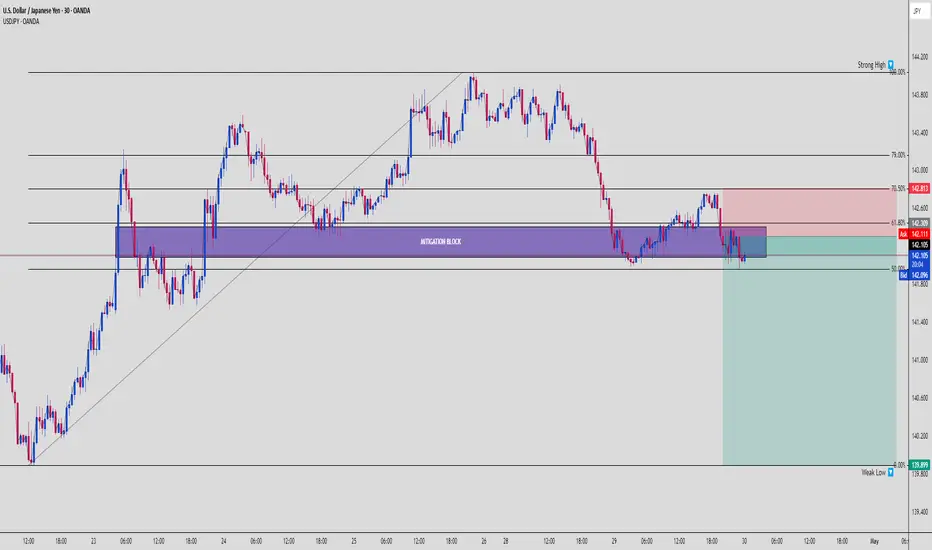
"USDJPY | Smart Money Premium Trap | Mitigation Block Rejection"⚡ USDJPY Analysis – 30M Timeframe | April 30, 2025
📊 Price Action Summary:
USDJPY has aggressively tapped into the Premium Zone, aligning perfectly with a Mitigation Block and Fibonacci 61.8% golden pocket.
We’re seeing early signs of Smart Money rejection — time to stay sharp! 🧐
🔥 Key Moves:
Premium Zone Entry: Price retraced right into the 61.8–70.5% fib region.
Mitigation Block respected: A known Smart Money zone where trapped sellers from previous moves get wrecked.
Liquidity Build-Up Below: Eyes on the unprotected lows — Smart Money LOVES to grab those.
🧠 What’s Really Going On Behind the Scenes:
Retail traders: "It’s bouncing! Let’s go long!" 🟢💸
Smart Money: "Perfect… let’s trap them for liquidity." 🧊📉
This move screams classic Premium Trap — draw them in, then nuke it. ☠️
🧩 Why This Setup Matters:
Mitigation Block + FVG combo = High-probability rejection zone
Sellers are likely reloading positions here
The Strong High has been established — room to target Weak Lows below
🎯 Trade Setup Idea:
Entry: Inside or just below the Mitigation Block (confirmation from bearish rejection)
Stop Loss: Just above the Strong High (~142.813)
Take Profit Zones:
TP1: Mid-discount (~141.400)
TP2: Weak Low (~139.899) — the real liquidity target 🎯
💬 Pro Tip:
"Mitigation blocks are the sniper’s nest for Smart Money. Get in, get out, get paid." 🎯
Watch the reaction closely inside the purple zone. It’s not just a block — it’s a liquidity recycling station.
🚀 Summary:
✅ Price entered Premium
✅ Mitigation Block tested
✅ Liquidity below waiting
✅ High RRR bearish setup aligning
🧘♂️ Be patient. Wait for confirmation. Let Smart Money leave the trail — then follow.
✍️ Save this chart and study how Mitigation Blocks get respected over and over. It’s not magic — it’s mechanics.
➡️ Comment "SNEAKY SHORT" if you're watching the block trap unfold!
➡️ Tag a trader who still doesn’t believe in Premium/Discount theory. 😂📉📈
NAS100USD: Institutional Selling Initiated at Premium LevelsGreetings Traders,
Today on NAS100USD, the market is currently operating within a clear bearish institutional order flow. In alignment with this directional bias, we are seeking selling opportunities supported by several key confluences.
Key Observations:
1. Liquidity Sweep at Premium Pricing:
Price has retraced deeply into a premium zone, sweeping the buy stops above a recent swing high. This suggests smart money is executing sell-side order pairing at extreme premium levels, utilizing retail liquidity for institutional distribution. When this occurs, price typically seeks rebalancing at fair value zones and continues toward discount levels.
2. Resistance at Fair Value Gap:
Following the liquidity sweep, price encountered resistance at a previously identified fair value gap (FVG). This FVG has held effectively, reinforcing the bearish outlook and acting as a high-probability rejection zone.
3. Market Structure Shift (MSS):
The market has now confirmed a bearish market structure shift, further validating the downside bias. This shift positions us to anticipate a continuation move.
4. Mitigation Block as Entry Zone:
We are currently watching a mitigation block for potential re-entries. These blocks represent zones where smart money mitigates previous long positions and introduces new short positions in alignment with the prevailing trend. If confirmed, they offer a strategic point to enter short trades.
Trading Plan:
Monitor the mitigation block for confirmation and look to enter with the broader institutional trend. Targets will include fair value regions and deeper liquidity pools at discount prices.
Remain patient and disciplined, and always ensure your analysis aligns with your trading plan.
Kind Regards,
The Architect
NAS100USD: Bearish Bias Expected to Hold After RetracementGreetings Traders!
In today’s analysis of NAS100USD, we maintain a bearish outlook despite short-term bullish movements in price action. These bullish signs appear to be corrective and in alignment with institutional objectives to rebalance inefficiencies created during yesterday’s sharp decline.
KEY OBSERVATIONS:
1. Inefficiency Rebalancing Completed:
Price has retraced to fill fair value gaps left behind by recent downside volatility. With those inefficiencies now rebalanced, we anticipate a continuation of the dominant bearish institutional order flow.
2. Buy Stops Taken – Institutional Order Pairing:
The sweep of buy stops confirms liquidity collection for institutional sell-side positioning. This aligns with a classic distribution phase, where institutions utilize buy-side liquidity to enter short positions.
3. Institutional Resistance – Rejection Block:
Price is currently reacting at a key institutional resistance zone, known as the rejection block. This zone, formed prior to the latest downside move, may act as the final area of resistance before renewed bearish continuation.
TRADING PLAN:
Entry Consideration:
Monitor price behavior at the rejection block. Upon confirmation, this area offers a high-probability setup for short entries.
Profit Targets:
Focus on targeting liquidity pools resting at deeper discount levels. These areas represent logical destinations for price based on institutional order flow dynamics.
Remain diligent and patient in your execution. Let the market confirm the direction before committing to a position.
Kind Regards,
The Architect
NAS100USD: Bullish Reversal on the Horizon?Greetings Traders, and welcome to the new year! I wish you all success and prosperity in the year ahead.
In today’s analysis of NAS100USD, we observe that the market has been delivering bearish institutional order flow, influenced by high-impact economic releases such as Average Hourly Earnings, Non-Farm Employment Change, and the Unemployment Rate. Despite this bearish momentum, I am anticipating a potential bullish reversal due to several key factors.
Key Observations:
1. Rejection Block Signal:
A rejection block at the lows indicates that institutions have been entering buying positions. This resulted in a rejection of the previous low, signaling bearish weakness and suggesting the possibility of a reversal.
2. Bullish Break of Structure:
Price recently broke a high during its upward movement, signaling bullish strength. This shift suggests that institutions may now be favoring upward price delivery.
3. Mitigation Block as a Key Zone:
Price is currently reversing toward a key institutional area known as the mitigation block.
What is a Mitigation Block?
This zone represents an area where institutions previously entered sell orders during the bearish trend. As price has since moved upward, these sell orders are now in loss. Institutions retrace price to this area to mitigate their losses and reinstate new buy orders to align with the prevailing bullish narrative.
These zones are pivotal and form the basis of support and resistance concepts.
Trading Strategy:
After confirmation, I will be looking for buying opportunities at the mitigation block, targeting the liquidity pool above. This aligns with the narrative that institutions are scaling into bullish positions and preparing for upward price delivery.
Stay observant and strategic as we analyze this potential shift in market structure. Feel free to share your thoughts or questions in the comments below, and let’s capitalize on the opportunities ahead!
Kind Regards,
The Architect

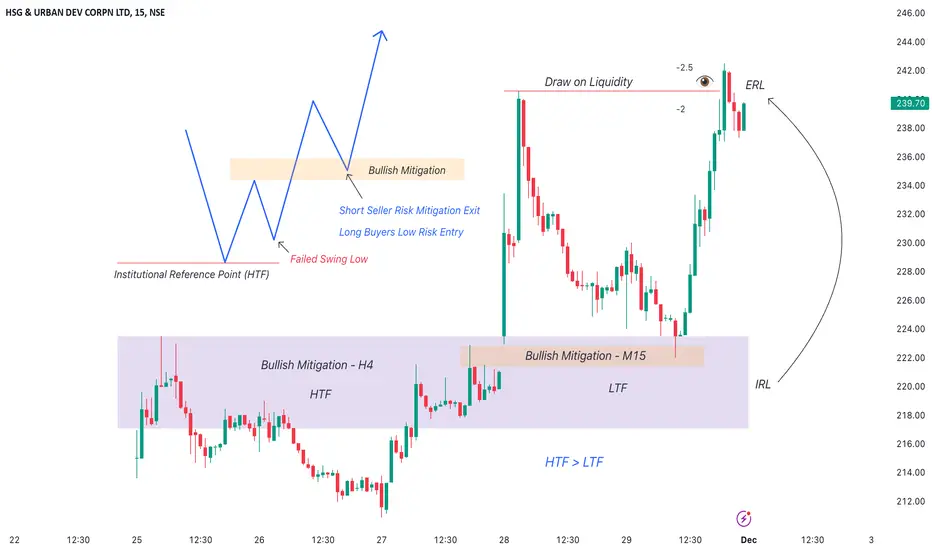
Understanding ICT Bullish Mitigation BlockA Bullish ICT Mitigation Block is a concept from Inner Circle Trader (ICT) methodology.
It forms at the end of a bearish trend when the price reaches a strong bullish institutional reference point, such as a bullish order block or breaker block.
Formation: It occurs when the price fails to create a lower low in a bearish trend and instead reverses to shift the market structure to the bullish side.
Identification: Look for a price level where the market attempted to break lower but was halted by significant buying pressure.
Trading Implications: This area can serve as a strong demand level, from which the price can rally further stronger because of short traders exit and long traders enter at the same area.
Multi Time Frame Analysis:
Higher Time Frame - H4
Lower Time Frame - M15
Institutional Framework:
Price Expansion (MMXM Buy Model)
Institutional Reference Points:
Bullish Mitigation
Sell Side Liquidity (SSL)
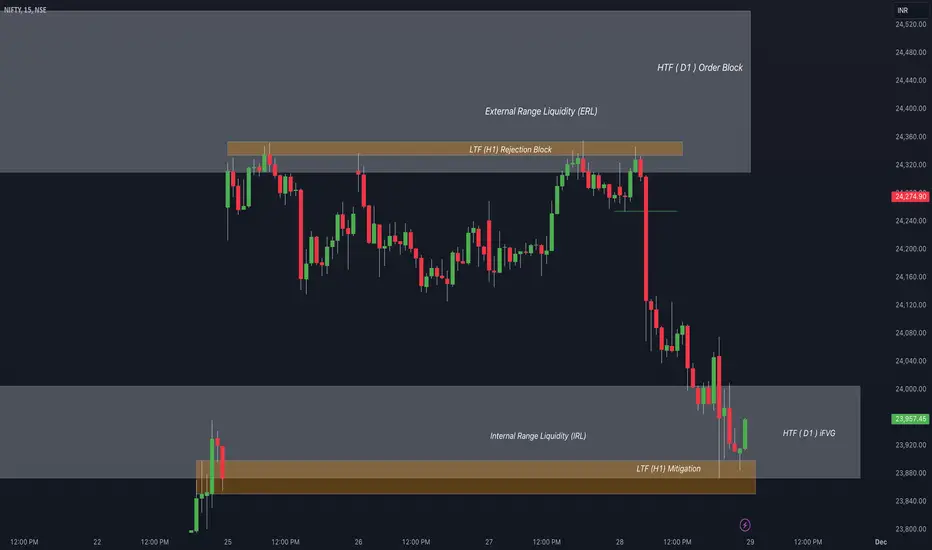
NIFTY MONTHLY EXPIRYPrice Framework : Expansion Phase
Price Delivery : ERL to IRL
Multi Time Frame Analysis
Higher Time Frame - D1
Lower Time Frame - H1
Entry Time Frame - M5
PD Arrays
HTF - Bearish Order Block
LTF - Bearish Rejection Block
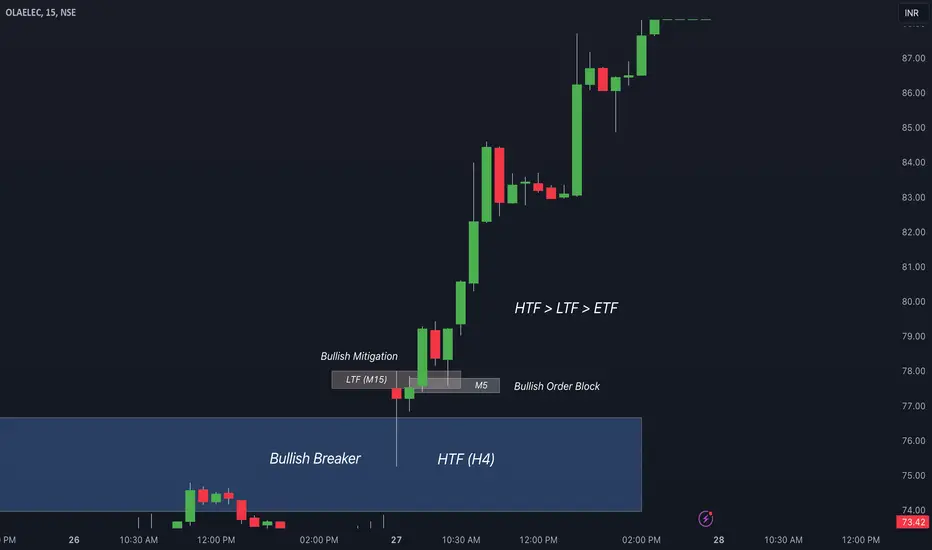
OLAELEC 20% Multi Time Frame Analysis
Bias : Bullish ( H4 )
Structure : Bullish ( M15 )
Entry : Bullish Order Block ( M5 )
PD Arrays
1. Bullish Breaker
2. Mitigation Block
3. Bullish Order Block
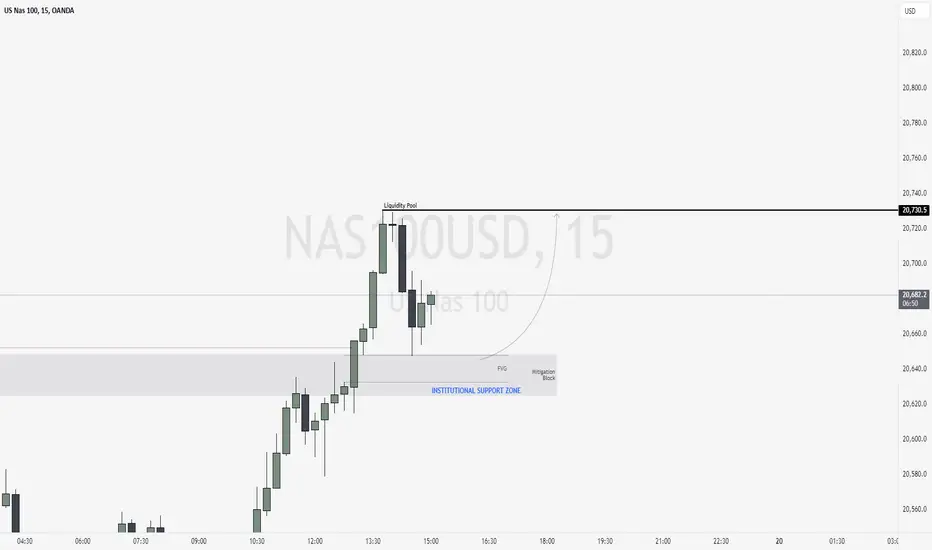
NAS100USD: Bullish Setup with Key Support Zones in FocusGreetings Traders!
Current Outlook📊:
NAS100USD is displaying bullish institutional order flow, signaling a strong upward trend. Following this momentum, I am focusing on buying opportunities to target the liquidity pool at the swing high.
Key Confluences🔗:
Support Zone : Price has retraced into a significant area marked by the alignment of a mitigation block and a Fair Value Gap (FVG).
Scalping Potential : This zone serves as an institutional support area, offering confidence to seek confirmation entries for bullish setups.
Feel free to share your analysis, discuss insights, or ask questions below in the comments. Let’s learn and grow together!
Best Regards,
The_Architect
What is a Liquidity Void?This study goes over what Liquidity Voids look like and a live example of how to trade off of them - Charting back from early May 2010

Indentifying Bullish/Bearish Orderblocks & Mitigation Blocks Orderblocks and Mitigation Block Live Study - Looking at live example going back to early May of 2010. There was news on May 6th that caused the market to plunge but interestingly enough - Price Action manages to be find a floor around the Orderblocks indentified on the Daily, Weekly, and Monthly Charts (HTF)

ICT Breaker & Mitigation Blocks EXPLAINEDToday, we’re diving into two powerful concepts from ICT’s toolkit that can give you an edge in your trading: Breaker Blocks and Mitigation Blocks. There are one of my favourite PD Arrays to trade, especially the Breaker Block. I’m going to explain how I interpret them and how I incorporate them into my trading. Stay tuned all the way to the end because I’m going to drop some gold nuggets along the way"
Ok, so first of all let’s go through what both these PD Arrays look like and what differentiates them, because they are relatively similar and how they are used is practically the same.
On the left we have a Breaker Block and on the right a Mitigation Block. They both are reversal profiles on the timeframe you are seeing them on, and they both break market structure as you can see here. The actual zone to take trade from, or even an entry from, in the instance of this bearish example is the nearest down candle or series of down candles after price makes a lower low. When price pulls back to this area, one could plan or take a trade.
The defining difference is that a Breaker raids liquidity on its respective timeframes by making a higher high or lower low before reversing, whilst a Mitigation Block does not do that. For this reason, a Breaker is always a higher probability PD Array to trade off from. As you should know by now if you are already learning about PD Arrays such as these is that the market moves from one area to liquidity to another. If you don’t even know what liquidity is, stop this video and educate yourself about that first or you will just be doing yourself a disservice.
Alright, so let’s go see some real examples on the chart. Later on I’ll give you a simple mechanical way to trade them, as well as a the discretionary approach which I use. And of course, some tips on how to increase the probability of your setups.

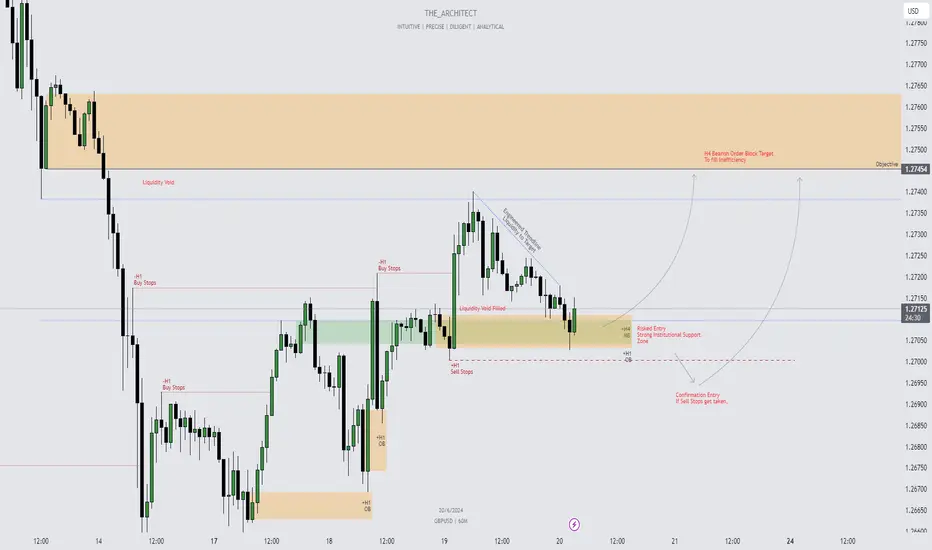
GBPUSD: Continuation of Momentary Bullish Order-Flow!Greetings Traders!
Current Market Analysis:
At the moment, GBPUSD is showing bullish momentum, particularly on the smaller timeframes. This is due to the inefficiency (liquidity void) present before the H4 bearish order block. The market strives for efficiency, and thus returns to fill these inefficiencies over time. I anticipate a continuation towards the H4 bearish order block.
Key Observations:
Confluence Factors: The H4 mitigation block is aligned with the H1 bullish order block, creating a strong institutional support zone. This alignment supports a risked entry towards the upside.
Risked & Confirmation Entry Strategy: I will take a risked entry on the H1 order block, However if the price takes out the H1 sell stops, I will consider a confirmation entry towards the upside.
Target Levels:
Engineered Trendline Liquidity: The price has created trendline liquidity, which we expect the market to absorb.
H4 Bearish Order Block: The main target is the H4 bearish order block, a strong draw due to the liquidity void present before it.
Trading Strategy:
Institutional Support Zone: Entering at the institutional support zone provided by the H4 mitigation block and H1 bullish order block alignment offers a strategic buying opportunity.
Upside Targets: The primary targets are the engineered trendline liquidity and the H4 bearish order block. These targets are in line with the bullish draw on liquidity.
Conclusion:
By understanding the momentary bullish institutional order flow and leveraging key support and resistance levels, we can anticipate and execute trades on GBPUSD effectively. The confluence of the H4 mitigation block and H1 bullish order block provides a robust support zone, guiding our strategy towards profitable buying opportunities.
For a comprehensive understanding of why I have been looking for a bullish draw this week on GBPUSD, please follow this link to a detailed post.
Happy Trading,
The_Architect
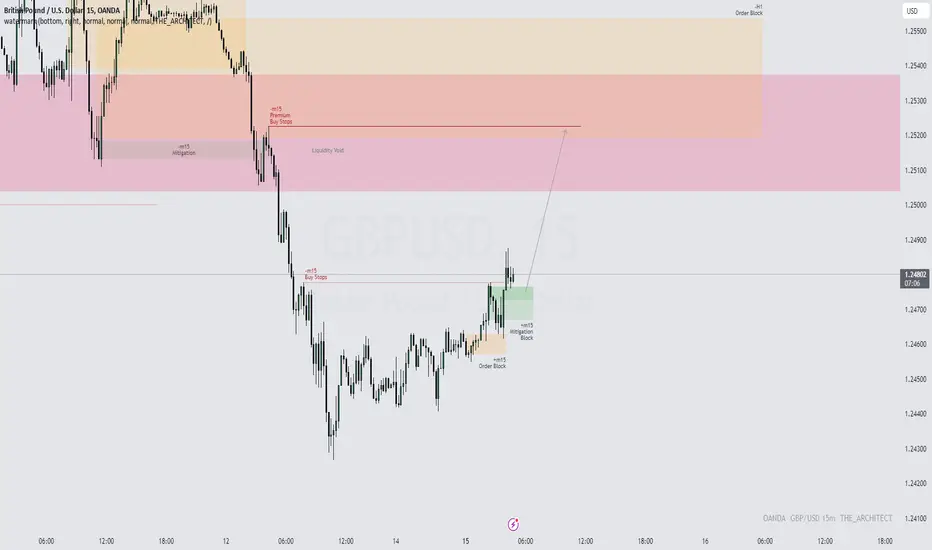
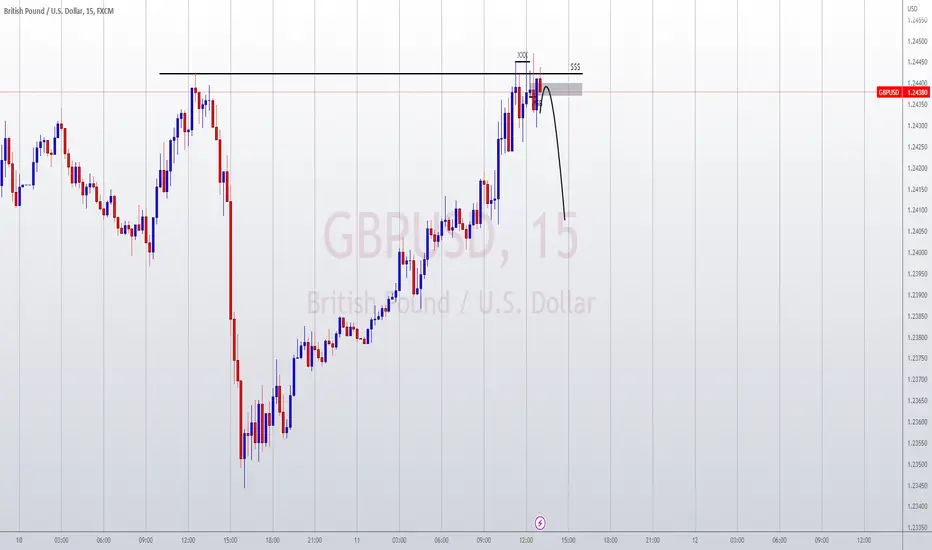
GBPUSD: Potential Buy Opportunity in London SessionCurrently, I'm observing a resistance point that the m15 timeframe is likely to approach which has m15 premium Buy Stops which is my Draw On Liquidity. Price is currently situated at an m15 mitigation block, which could serve as a strong support zone for the market to advance further.
Kind Regards,
The_Architect
AUDCHF LongScenario Price is on the buyside of the curve. On its First SWING of the BUYSIDE, I'm looking for an 3rd LL (lower low) to form to take out sell side liquidity so it can continue to buy up. IF price shoots up it will retrace back down to the "MB" as an retracement (2nd entry to upside)

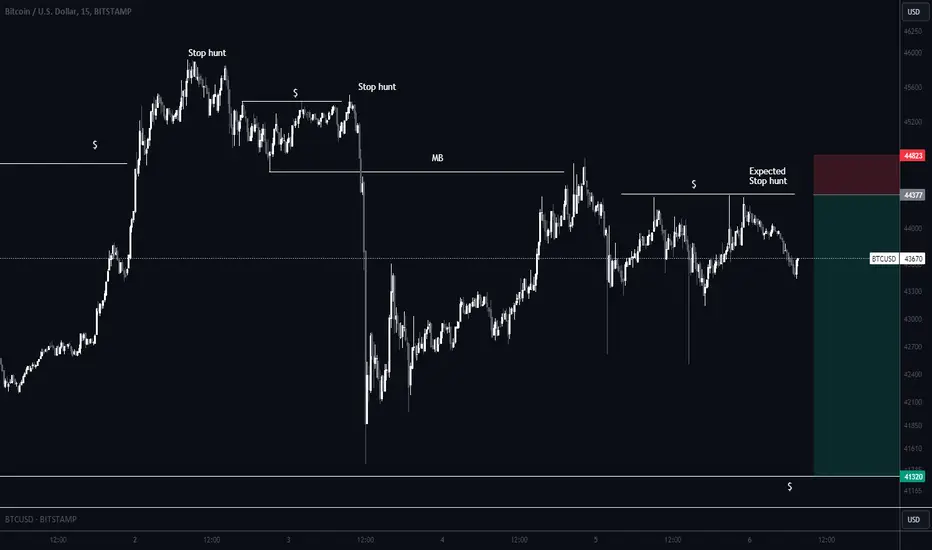
BTC/USD where is the moneh?The moneh (moneh = $ = liquidity = equal highs and lows)
Use the moneh to find
- Entry positions (expected stop hunt)
- Exit positions (equal highs and lows)
GU Liqudity ShortGU Liqudity Short, Potantiel Reversal Zone.. Pinbar setup and low time frame mitigation block trade..
Bearish March for $SPYI have strong belief that it will be a good time to short the market in March. Last month $SPY went up to grab liquidity(short stops) from the recent high of December at $410 with a lack of displacement. AMEX:SPY also came back to test a mitigation block that was formed at the beginning of the bear run in Feb. 2022.
If it closes the month of March below the next recent high, which would be 431.73, I will be looking to short with a target around $348

Short Scalp After Daily Bias Order Flow Shift BearishBias: Bearish Daily
Plot:
Price weakens and shown signs of reversal to seek sell-side liquidity after hitting an old Order Block as Resistance.
Price Daily TF forms lower high.
Price has never confirmed with Asia's 50% if may continue bullish.
Price strongly seeks sell-side liquidity until Daily TF Shifts Bullish again, but not likely as price had been going high for over a week without any good retracement.
Entry was an ICT Mitigation Block. Confirmation once price hits the Propulsion block and confirms moving downside.

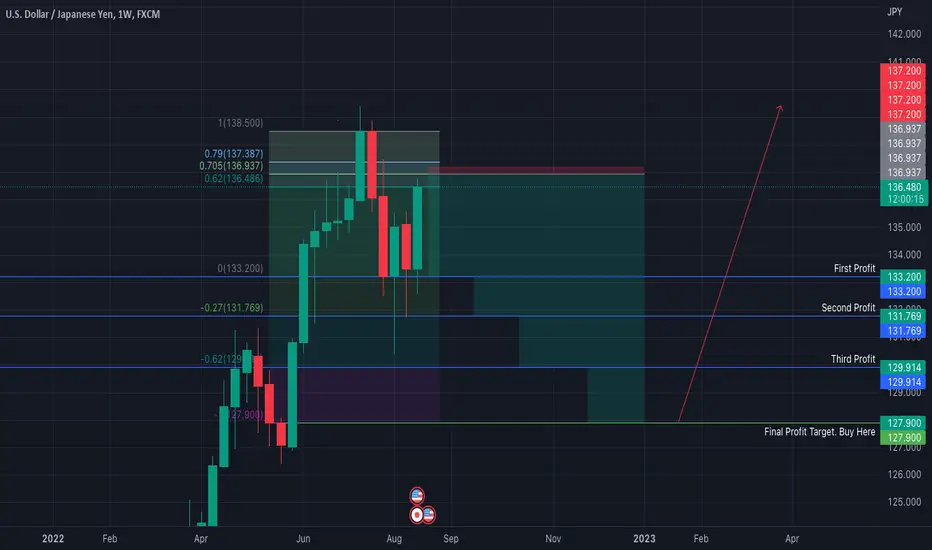
USDJPY SELLLIMIT ORDERSPrice is filling IPA(Imbalance) to mitigate the open price of a institutional candle on the 4h timeframe. The open price of this candlestick is 136.937 which is a high probable reversal point. Don't get caught on the wrong side of where you think the banks might move price.