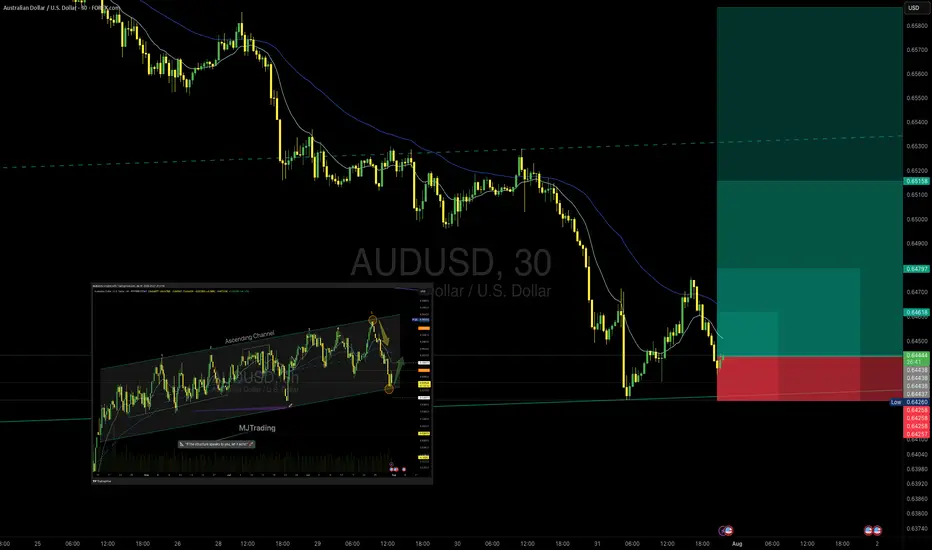
AUD/USD – Potential Bounce Buy SetupOANDA:AUDUSD
Timeframe: 30m
Type: Counter-trend / Bounce from Support
Risk Level: Medium to High
Possible Reward: 4+
🔹 Setup:
Price is testing the lower boundary of the recent support zone (0.6432 – 0.6420), aligning with the previous channel structure visible on the 8h chart. The descending move has shown initial signs of exhaustion, suggesting a potential bounce.
📈 Entry:
Current price zone 0.6432 – 0.6445
🎯 Targets (TP):
TP1: 0.64624
TP2: 0.64797
TP4: 0.65158
⛔ Stop Loss (SL):
0.64250 (below recent swing low and liquidity pool)
8H chart Overview:
Previous Position from top of Channel:
#AUDUSD #Forex #SmartMoney #PriceAction #MJTrading #ChartDesigner
Psychology Always Matters:
Mjtrading
BTCUSD – Descending Channel or Bullish Flag?BINANCE:BTCUSDT – Market Maker’s Game Inside a Descending Channel
Timeframe: 2H | MJTrading View
Market Structure Overview:
Bitcoin recently printed a new ATH at $122,000 after a parabolic run from the previous ATH at $111,937.
Since then, price has been consolidating inside a descending channel, which could act as a bullish flag in higher timeframes.
Liquidity pools are clearly formed:
Above $122K – resting stops of late shorts.
Below $115K–$114K – weak long stops and untapped demand near the Order Block (OB).
Key Levels & Liquidity Zones:
Upside:
$122K Liquidity Pool → If swept, could trigger momentum towards $124K–$125K.
Downside:
$116K OB → First defensive zone for bulls.
$112K Strong Support → Aligns with previous ATH breakout base.
Market Maker’s Dilemma:
If you were a market maker… which liquidity pool would you hunt first?
Price is coiling tighter within the channel, and both scenarios are possible:
Upside Sweep → Rapid breakout above $122K to clear shorts, then potential continuation.
Downside Sweep → Sharp drop into $116K–$112K liquidity, flushing longs before any recovery.
⚡ MJTrading Insight:
This is the classic market maker compression – first sweep likely determines direction.
Patience here is key; let the liquidity tell the story.
#BTCUSD #Bitcoin #Liquidity #SmartMoney #PriceAction #MJTrading #ChartDesigner #CryptoAnalysis
Psychology Always Matters:

AUDUSD Engineered to Drop?🧠MJTrading:
📸 Viewing Tip:
🛠️ Some layout elements may shift depending on your screen size.
🔗 View the fixed high-resolution chart here:
🔻 OANDA:AUDUSD – Tagged the Top | Smart Money Eyes Lower Levels??
📍 Perfect Respect of Channel Structure
AUDUSD has just kissed the upper boundary of a long-standing ascending channel, showing sharp rejection — a sign that premium pricing might now shift toward discount levels.
📈 The aggressive push into the highs likely aimed to clear buy stops — fulfilling smart money objectives before a potential reversal.
📉 And here’s the subtle clue:
Just below the last bullish candle lies a thin slide — a structural weakness.
If price breaks and closes below that full body bearish candle (Below 0.66000), the market could slip fast, unleashing a momentum-driven drop into the first liquidity zone (0.6520s).
🧠 For smart money lovers, this is the classic:
Sweep → Trap → Slide
📏 And for fans of parallelism, the chart’s geometry offers a rare beauty — lines in harmony, structure in rhythm, and opportunity in alignment.
🔍 What to Watch For:
Break below 0.66000 (last candle body) = entry signal
0.6520–0.6540: first liquidity zone
0.6400–0.6300: deeper cleanout, if bearish pressure sustains
Inset: DXY bouncing from long-term demand supports bearish thesis
Manage your risk wisely...
For Lower time frame traders:
Psychology Always Matters:
(Click on the pictures for caption and concepts)
#AUDUSD #SmartMoney #LiquiditySweep #ChannelTrading #ChartDesigner #MJTrading #PriceAction #Forex

BTC/USD Buy Setup (6H Chart)📈 BTC/USD Buy Setup (6H Chart)
Strategy: Trendline Support Bounce
🔹 Entry
Price: $118,674.3
Reason: Price is bouncing off a supportive trendline and holding above the 1st Support zone.
🔻 Stop Loss (SL)
Price: $114,470.6
Reason: Below the 1st Support zone to protect against breakdown.
🎯 Take Profit Targets
TP1: $123,269.6
Reason: Near recent swing high, good for partial profit.
TP2: $127,661.4
Reason: Next resistance zone, ideal for full exit or trailing stop.
#MJTrading
#Bitcoin

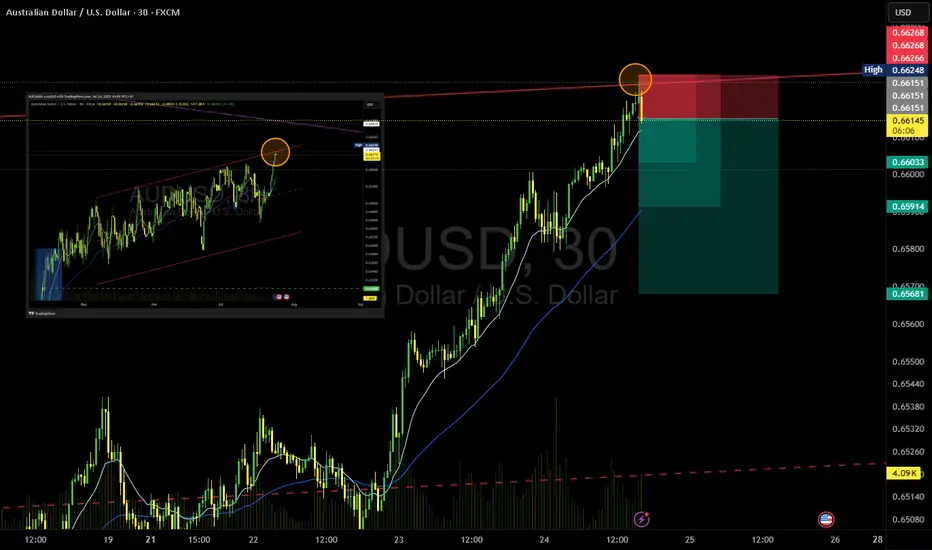
AUD/USD Sell SetupOANDA:AUDUSD
Timeframe: m30
Entry: 0.66151
SL: 0.66266
TP1: 0.66033
TP2: 0.65914
TP4: 0.65681
📊 Setup Rationale
🔺 Channel Top Rejection (8H Overlay) Price has touched the upper boundary of a descending channel visible on the 8-hour chart. This zone has historically acted as a strong resistance, increasing the probability of a reversal.
🧱 Local Structure (30min) Entry aligns with a minor double top (in lower TFs) and bearish momentum. The tight SL allows for a high R:R profile.
🔄 Momentum Shift Watch for bearish engulfing or rejection wick on lower timeframes to confirm entry.
#MJTrading #Forex #AUDUSD #Sell
Psychology always matters:
GBPUSD Idea – Demand Zones & Potential Reversal Play🧠 MJTrading:
After a steady downtrend, GBPUSD is now approaching a strong 4H demand zone (Support 1), where we previously saw explosive bullish reactions.
Price is also extended from both EMAs, showing potential for a technical pullback or full reversal.
💡Scenarios to consider:
🔹 If Support 1 holds → we may see a bounce toward 1.3500+
🔹 If broken → Support 2 & 3 offer deeper liquidity and high-probability demand zones
👀 Watch for:
Bullish reversal candles (engulfing / hammer)
Bullish divergence on lower timeframes
Volume spikes on reaction
⚠️ Invalidation:
If Support 3 breaks with strong momentum, we might enter a bearish continuation phase.
#GBPUSD #Forex #ChartDesigner #SmartMoney #PriceAction #MJTrading #ForexSetup #TrendReversal #SupportZones

Gold – Bear-to-Bull Transition in Motion?🧠 MJTrading:
TVC:GOLD – 8H Chart: Bulls, It’s Your Move.
📸 Viewing Tip:
🛠️ Some layout elements may shift depending on your screen size.
🔗 View the fixed high-resolution chart here:
The impulsive move from 3000 to 3500 wasn’t just a trend — it was a statement of strength.
That rally carved the ATH, then left behind weeks of digestion and structural compression.
Now, the market may be setting up for its next decision.
Notice how each bearish leg has been shrinking — a classic behavioral signal that sellers are losing momentum — possibly a shift in control underway.
We’re also pressing above the downtrend line from the ATH (3500), while the uptrend from 3000 remains clean and respected.
We’re now testing the 3400 zone — a key battleground.
📍 If bulls want to reclaim the momentum and show dominance, this is the moment to act.
🔹 1st Support: 3363–3377
🔹 2nd Support: Rising trendline
🎯 Target Zone: 3455–3500+ (Liquidity Pool & ATH proximity)
⚠️ Break back inside the triangle could delay the breakout narrative.
⚠️ If momentum fails to increase from here, and bulls can’t break out with conviction, the market is likely to remain range-bound for longer — extending the sideways phase between 3250–3500.
💭 If you’re watching for a new ATH… stay sharp, stay structured — the market rewards patience and readiness.
“If the structure speaks to you, let it echo, boost it.”
📐 MJTrading 🚀
What do you think?
#GoldAnalysis #XAUUSD #MarketStructure #LiquiditySweep #AnythingCanHappen
#MJTrading
#ChartDesigner
Psychology Always Matters:
Click on them for the caption...

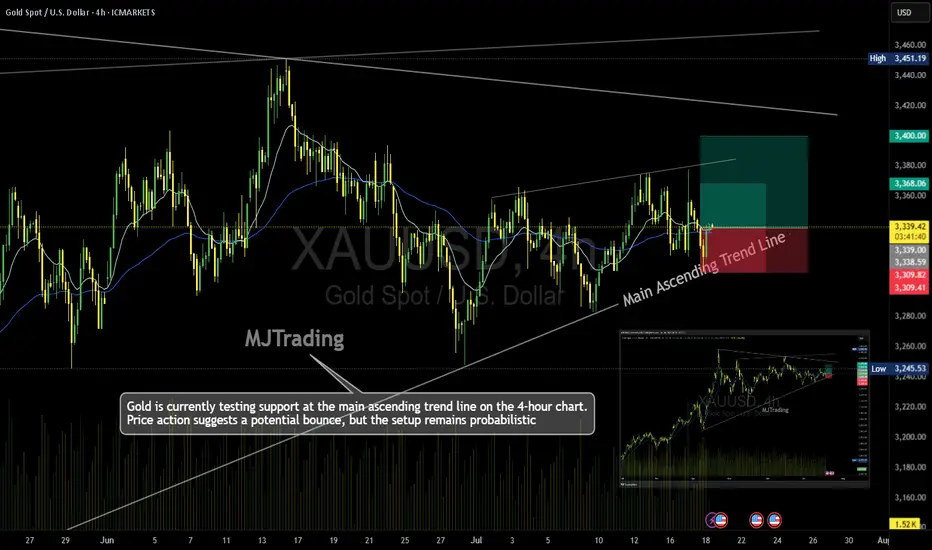
Gold (XAU/USD) – 4H Time Frame Trade Idea📈MJTrading:
Gold is currently testing support at the main ascending trend line on the 4-hour chart. Price action suggests a potential bounce, but the setup remains probabilistic—ideal for traders who operate on higher time frames and manage risk with discipline.
🔹 Trade Setup
Entry: 3340
Stop Loss: 3309
Take Profit 1: 3368
Take Profit 2: 3400
🔍 Technical Context
Price is respecting the long-standing trend line, hinting at bullish continuation.
Risk-reward ratio is favorable, especially for swing traders.
A break below the trend line invalidates the setup—hence the tight SL.
⚠️ Note: While the trend supports upside potential, failure to hold the trend line could trigger deeper retracement. Trade the probabilities, not the certainties.
In case it's not shown properly on your monitor because of different resolutions:
Psychology Always Maters:
#MJTrading #Gold #XAUUSD #Trend #Trendline #Forex #Chart #ChartAnalysis #Buy #Long
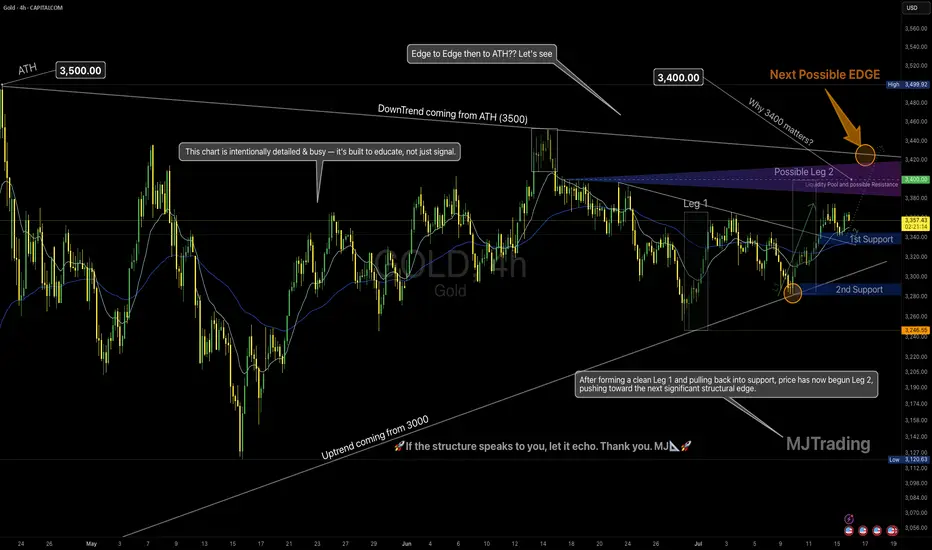
Leg 2 in Progress? | All Eyes on the Possible EDGE around 3400💡 GOLD 4H – MJTrading:
After forming a clean Leg 1 followed by a technical pullback into support, Gold has initiated Leg 2, pushing upward toward the next possible EDGE: 3400.
🟠 Why 3400 Matters
This zone is not just a round number:
It aligns with the long-term downtrend coming from the ATH (3500)
It’s the last reaction high before a deeper correction
There’s likely liquidity resting above — it’s where smart money may make decisions
This is where structure and psychology meet.
And end of 2 possible 2nd leg...
🔄 Possible Scenarios:
🟥 Scenario A – Rejection from the Edge (if could reach):
A reaction from this zone could lead to a pullback toward:
1st Support around 3340-3360
2nd Support near 3250 (also the uptrend line from 3000)
Use these zones to reassess momentum.
🟩 Scenario B – Breakout Above 3400:
A clean break above this structural edge opens the path for:
An “Edge to Edge” move back toward ATH (3500)
Possible higher timeframe trend shift — especially if retest holds
🧠 Our Strategy
We’re long-biased into the edge, not beyond it yet.
Let 3400 show its hand — we stay adaptive, not predictive.
🔍 This chart is intentionally detailed — it's built to educate, not just signal.
Focus on structure, sequence, and behavior — not just levels.
Lets Zoom in around the Breakout area...
And a Zoomout to Daily...
🧭 “If the structure speaks to you, let it echo.”
– MJTrading 🚀
📍#Gold #XAUUSD #TradingView #TechnicalAnalysis #ChartDesigner #MJTrading #MarketStructure #ForexIdeas #Edge
Survive first. Thrive later.🧠 Trading Psychology x Risk Management
"If you can't survive being wrong, you don't deserve to be right."
💬 A calm chart…
A ruthless truth.
Most traders obsess over being right.
But the market only rewards those who manage being wrong.
Risk control isn’t just technical — it’s emotional.
Survive first. Thrive later.
— MJTrading
Psychology Always Matters:
Click on them for notes in the caption...
#MJTrading #ChartDesigner #TradingPsychology #RiskManagement #MindfulTrading #CapitalPreservation #SmartMoney #XAUUSD #ForexDiscipline #15minChart #GoldAnalysis #MentalEdge #Gold

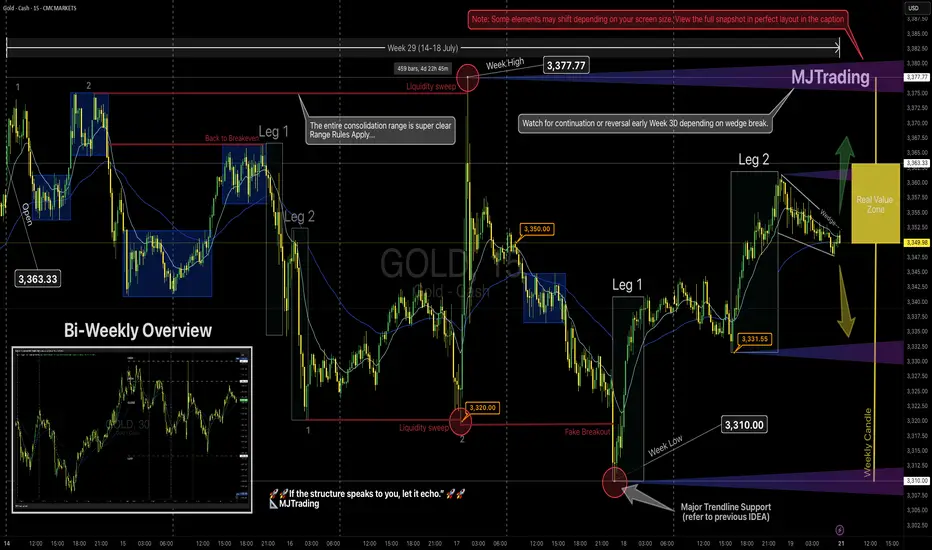
GOLD Weekly Recap (Week 29) – MJTrading View📸 Viewing Tip:
🛠️ Some layout elements may shift depending on your screen size.
🔗 View the fixed high-resolution chart here:
Now that you have got the perfect layout let's dive in...
📈 GOLD Weekly Recap (Week 29) – MJTrading View
🕰 Timeframe: 15min chart with bi-weekly perspective
📅 Period Covered: July 14–18 (Week 29)
🎯 Visual Framework: Leg structure, range boundaries, liquidity sweeps, trendline holds, and Real Value Zone.
🔹 Weekly Summary
Open: 3,363.33
High: 3,377.77 (🔴 sweep: trapped buyers)
Low: 3,310.00 (🔴 sweep into key demand + touching the main ascending trendline )
Close: 3,349.98~3350 (lovely round level)
Structure: Entire week played inside a broad consolidation range, with sharp but failed breakouts on both extremes.
Range rules applied: traps, sweeps, compression — everything aligned for responsive trading.
📌 Key Observations
Early Week:
A double-top structure led to rejection from ~3,375 → slid into 3,350.
Price returned to breakeven but then flushed hard toward 3,320 via a clean 2-leg drop.
Midweek:
After forming a double bottom, price created a tiny liquidity sweep, then exploded to the weekly high.
The move above 3,377.77 was a textbook liquidity grab, immediately rejected.
This led to a slide toward the weekly low, tagging both the trendline and consolidation floor — forming a false breakout + reversal.
Late Week:
The low at 3,310 was swept cleanly (🔴), followed by a leg-based reversal:
Leg 1: Up to 3,331
Leg 2: Extended to ~3,360 before fading back inside the range.
Compression:
Price closed inside the Real Value Zone (weekly candle body) — just under the open, forming a tight wedge, hinting at breakout conditions for Week 30.
🟨 Weekly Candle Body
Open → Close of weekly candle reflects Real Value Zone .
Highs and lows were swept, but real commitment stayed within the body.
🧭 Key Levels to Watch – Week 30
Level Role
3,377.77 Weekly High / Liquidity Sweep (🔴 rejection)
3,363.33 Weekly Open (break & hold = bullish bias) / Previous Weekly High
3,350.00 Micro resistance / Mid-structure cap / Round Level
3,331-3 Leg 2 low & first reaction zone / Round Level
3,320.00 Breakdown support / Flush origin
3,310.00 Weekly Low / Major Demand (🔴 sweep)
3,400.00 Next possible main target
3,282.00 Previous Weekly Low
Dynamics: Both Uptrend and Downtrend Lines...
🧠 MJTrading Notes
Bias remains neutral inside the range.
A break & acceptance above 3,363 could trigger a re-test of the sweep zone (3,377+).
A breakdown below 3,331 puts 3,320 → 3,310 back on the map then 3,282.
Don’t force direction — let expansion confirm itself.
🧭 “If the structure speaks to you, let it echo.”
– MJTrading 🚀
#MJTrading #ChartDesigner #GOLD #LiquiditySweep #PriceAction #StructureTrading #Weekly #Chart #Consolidation #2legs
🧠 Psychology always matters:
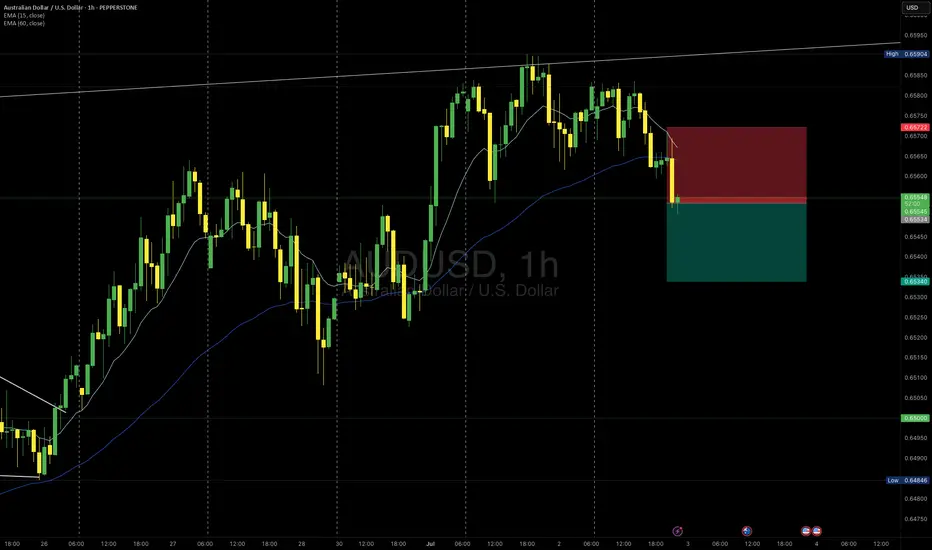
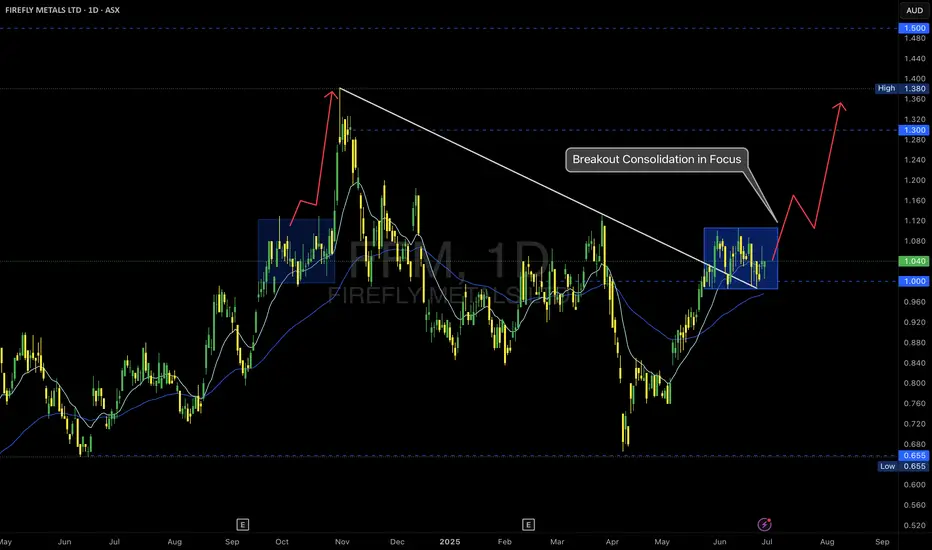
FFM -- ASX – Breakout Consolidation in Focus
📝 Description
Firefly Metals is setting up a classic breakout continuation scenario after reclaiming the $1.00 psychological level and breaking the long-term trendline resistance.
🔹 Key Observations:
• Trendline Break: The descending trendline from the prior high was decisively breached, signaling a structural shift.
• Accumulation Zone: Price has consolidated in a tight range above $1.00, forming a bullish flag or box accumulation.
• EMA Cluster Support: Both the 15 and 60 EMAs are aligned below the consolidation, providing dynamic support.
🔹 Potential Scenarios:
✅ Bullish Continuation:
A clean breakout above the top of the blue box could trigger a momentum rally toward $1.30 and ultimately the $1.38–$1.50 resistance levels.
✅ Deeper Pullback:
If price loses the $1.00 support decisively, a retracement to retest the breakout base is possible.
Trade Plan:
I am monitoring for a confirmed breakout candle with volume expansion to validate the continuation thesis.
• Entry trigger above the range high ($1.10 area)
• Stops below recent swing low / $1.00 level
• First target: $1.30 resistance
As always, risk management first—no breakout, no trade.
#MJTrading
#FFM #FireflyMetals #ASXTrading #BreakoutSetup #TechnicalAnalysis #PriceAction #TradingPlan #ChartOfTheDay #AustralianStocks #MomentumTrading #MJTrading
EURUSD – From Structure to Shift
1H Technical Outlook by MJTrading
EURUSD moved cleanly through a sequence of structural phases:
• Previous Base
• Multi-day Consolidation (potential quiet accumulation)
• Transition into a well-respected Descending Channel
Price has since shown repeated rejections from the upper boundary, including a decisive selloff from the 1.1750 zone, forming what we now label a "Pressure Gap" — a space where aggressive sellers overwhelmed price.
🧭 Key Scenarios Ahead:
🔻 Bearish Continuation:
Breakdown below 1.1700 opens room toward:
• 1.1640 (channel bottom)
• 1.1600 Liquidity Zone
Watch for impulsive sell candles + EMA rejection
🔁 Short-Term Bounce or Trap:
Holding above 1.1700 could spark a rebound toward 1.1750
This may serve as a final test before another leg lower
Only a clean break and hold above 1.1763 flips structure bullish
🔍 Bonus Confluence:
1D Chart shows broader bullish context (inset)
EMAs tightening = expect volatility burst
Well-defined structure gives clear invalidation and targets
Every trend tells a story — from base building to breakout, and now a possible breakdown. Trade the structure, not the prediction.
#EURUSD #Forex #TradingView #TechnicalAnalysis #PriceAction #DescendingChannel #LiquidityZone #SmartMoney #MJTrading

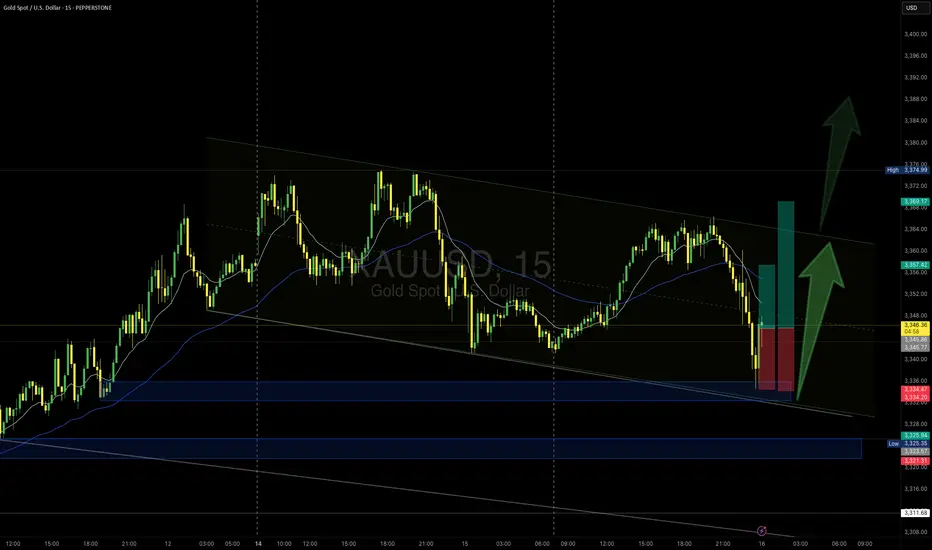
XAUUSD – M15 Buy Setup⚡️XAUUSD – M15 Buy Setup
We’re back to business at a key decision point! Here’s what makes this a compelling opportunity:
📍Buy Setup on M15:
1️⃣ Price tapped into a strong support zone around 3333 – a level with proven reaction history
2️⃣ Third touch of the descending channel – possible breakout setup / bullish flag on HTF
3️⃣ A strong bullish engulfing candle closed above the previous daily close, showing buyer strength
4️⃣ Supported by the H4 MA zone acting as dynamic demand
🔥 Everything aligns technically for a high-probability bounce – but remember:
Strong setup ≠ guaranteed outcome.
We trade probabilities, not certainties.
🚀 Go for it guys... but manage your risk like a pro!
#XAUUSD #Gold #BuySetup #PriceAction #ChannelBreakout #SmartMoney #ChartDesigner #MJTrading #Forex #TradeIdea
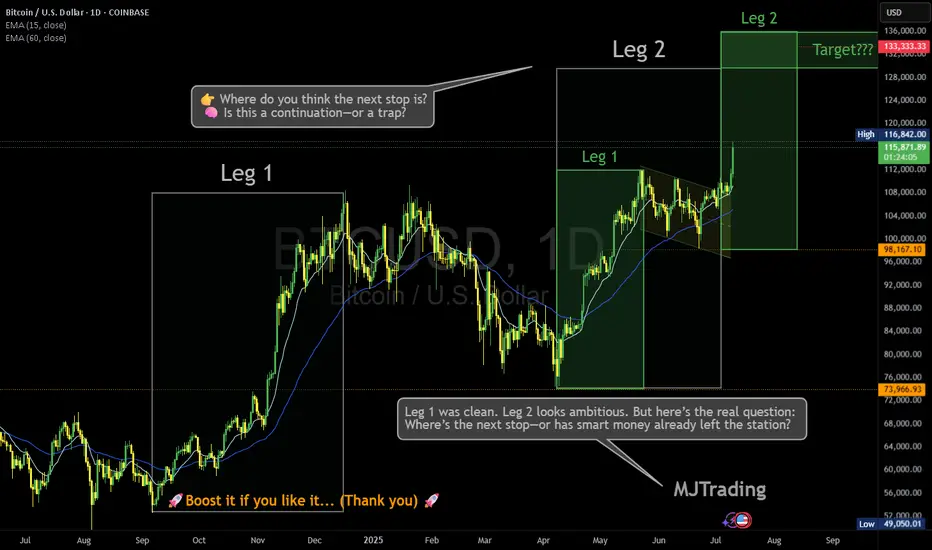
Where is the next stop? 133,333?Leg 1 was clean. Leg 2 looks ambitious. But here’s the real question: Where’s the next stop—or has smart money already left the station?
BTC just sliced through both EMAs with conviction, now hovering above $116K. Volume’s decent, sentiment’s euphoric… but is this rally genuine markup, or a cleverly disguised distribution phase?
🔍 Price targets like $133K are seductive—but what if consolidation isn’t horizontal anymore?
Vertical consolidation is real. And it’s where retail gets baited hardest.
📊 Leg 2 might still play out—but don’t ignore the possibility that this is the final markup before a liquidity sweep.
👉 Where do you think the next stop is? 🧠 Is this a continuation—or a trap?
Drop your guess...
Who has entered here:?
Who can let the winners run in this situation:
#MJTrading #ATH
#Bitcoin #BTC #CryptoTrading #SmartMoney #MarketStructure #WyckoffMethod #LiquiditySweep #DistributionPhase #TechnicalAnalysis #TradingView #CryptoChart #PriceAction #EMA #Consolidation #CryptoStrategy #TrendReversal #CryptoCommunity
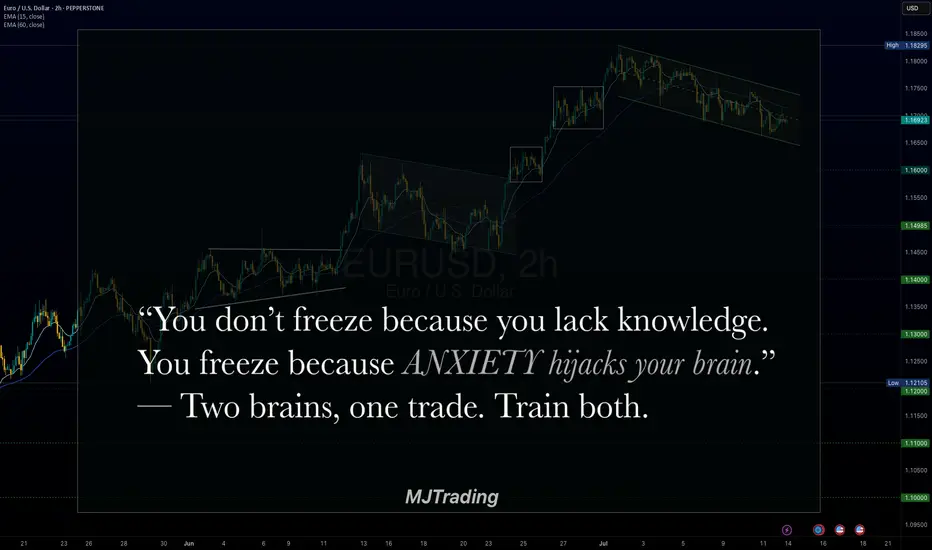
Two Brains, One Trade: Why You Freeze Under PressureBy MJTrading:
In trading, your biggest opponent isn’t volatility.
It’s your own neural wiring.
Every trader operates with two main systems:
🧠 System 2 – Rational, deliberate, planning (Prefrontal Cortex)
🧠 System 1 – Emotional, instinctive, fast (Amygdala & Limbic Brain)
Before entry, System 2 is in control. You feel calm, logical.
But the moment money is at risk—especially in drawdown or after a missed TP—System 1 takes over.
💥 Stress hormones spike
💥 Focus narrows
💥 Long-term thinking disappears
💥 You freeze, or act impulsively
You knew what to do.
But you didn’t do it.
Because in that moment, your rational mind wasn’t driving anymore.
⚖️ Set & Forget vs. Floating Managers
Different trading personalities react differently under pressure:
🔹 Set & Forget Traders
Rely on automation or predefined exits to bypass emotional hijack.
They reduce cognitive load, but often feel regret when price goes “a little more.”
🔹 Floating Management Traders
Rely on intuition and live feeling. They stay with the chart, adjusting based on flow.
When calm and trained, they shine.
But under pressure, they’re more vulnerable to emotional loops:
– hesitation
– premature exits
– revenge tweaks
– system betrayal
🧘♂️ What can you do?
✔️ Pre-plan decisions
Make the hard calls before emotions kick in.
✔️ Mental rehearsal
Visualize trade management scenarios—yes, like athletes do.
✔️ Create fallback protocols
So if you freeze, your system still knows what to do.
🧠 For Those Who Want to Go Deeper:
“Thinking, Fast and Slow” by Daniel Kahneman
Understand System 1 & 2 thinking—and how cognitive bias shapes all decisions, not just trades.
“The Hour Between Dog and Wolf” by John Coates
A stunning look at how biology, hormones, and risk-taking collide in traders' brains.
🔓 Final Thought:
If your strategy works in theory, but breaks in real-time—
It’s time to work on your neural execution layer.
Because in trading, you don’t rise to your level of analysis—
you fall to your level of emotional wiring.
— MJTrading
#NeuroTrading #TraderTypes #TradingPsychology #SetAndForget #FloatingManagement #MindOverMarkets #EURUSD #MJTrading
Previous psychology Ideas:
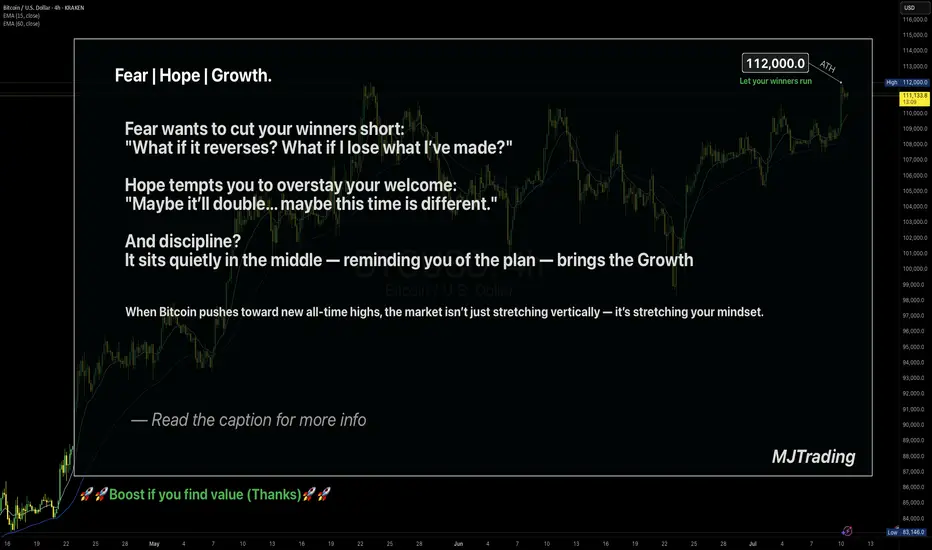
Let your winners run🧠 Fear | Hope | Growth – When Trading Meets Emotion
The message on the chart isn't just poetic — it's real psychology.
🔹 Fear wants to cut your winners short.
It sneaks in after a small move in your favor.
"What if it reverses? I better lock this in."
And just like that, a great trade turns into a missed opportunity.
🔹 Hope drags you into holding too long.
It dreams: "Maybe it doubles... maybe this time it'll be massive."
But it's not guided by data — it's driven by fantasy.
🔹 Discipline is what sits in the middle.
Quiet. Neutral.
It doesn’t scream or seduce — it just follows the plan.
And that’s where Growth lives — not just on the PnL, but in your psychology.
When Bitcoin pushes toward new ATHs, these emotions get amplified.
The real question becomes: Can you manage yourself, not just your trade?
📌 A Real Example from My Desk
In my earlier BTCUSD idea — “Another Edge – Decision Time” (shared above) —
I sent that setup to one of my managed clients.
He entered long exactly at the edge of the channel — a clean, strategic buy.
Price moved beautifully in our favor…
But he manually closed the trade at 106,600 — long before the move matured.
Why?
Because fear of giving back profit overwhelmed the original plan.
The chart was right. The timing was right.
But the exit was emotional, not tactical.
✅ The trade made money.
❌ But the lesson is clear: a profitable trade doesn’t always mean a disciplined one.
🎯 Final Takeaway:
“Fear kills your winners. Hope kills your timing. Discipline grows your equity and your character.”
🗣 What would you have done in that position?
Held longer? Closed at resistance? Let it run toward ATH?
Let’s talk psychology — drop your thoughts 👇
#MJTrading
#TradingPsychology #BTCUSD #FearHopeDiscipline #LetYourWinnersRun #PriceAction #BTCATH #ForexMindset #CryptoStrategy
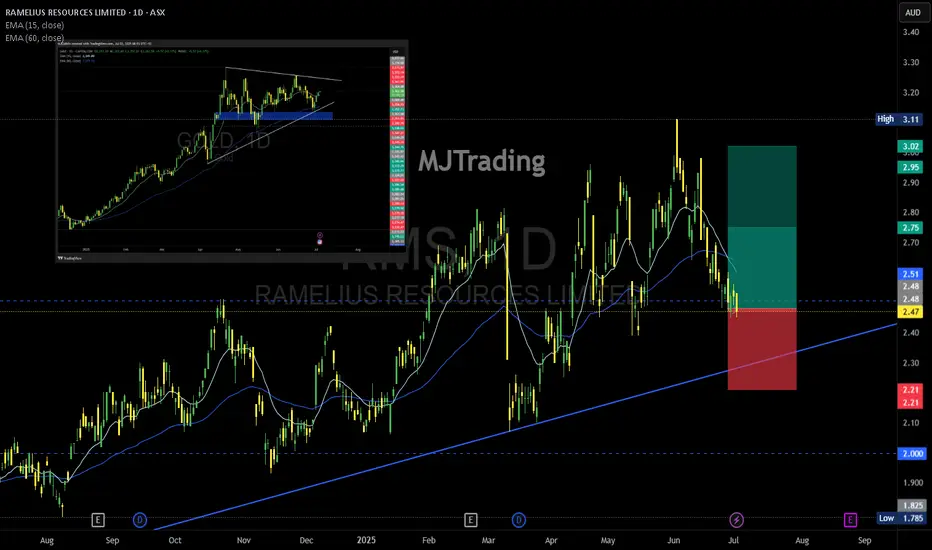
Ramelius Resources (ASX: RMS) –A Tactical Re-Entry Zone?🟡 Gold-Linked Opportunity: Ramelius Resources (ASX: RMS) – A Tactical Re-Entry Zone?
Context: Ramelius Resources, a mid-tier Aussie gold producer, is showing signs of technical exhaustion after a strong rally from its 2024 lows. With gold prices consolidating and RMS pulling back to a key support zone, this could be a tactical opportunity for shareholders and swing traders alike.
📊 Technical Snapshot:
Current Price: $2.47
Trendline Support: The long-term ascending trendline remains intact, offering a potential re-entry zone for bulls.
Risk-Reward Setup: Defined green/red zones highlight a favorable R:R ratio for those targeting a rebound toward $2.80–$3.00.
🪙 Gold Correlation Insight:
The inset chart shows gold (XAU/USD) stabilizing after a volatile June. If gold resumes its uptrend, RMS could follow suit, given its strong correlation with bullion prices.
🧠 Psychological Angle:
After a 40%+ rally from the $1.78 low, some profit-taking is natural. But this pullback may shake out weak hands before a continuation move.
Watch for sentiment shifts around gold and broader risk appetite—these could be catalysts for RMS’s next leg.
#RMS #Gold #ASX #MJTrading #Forex #Trading #Investment
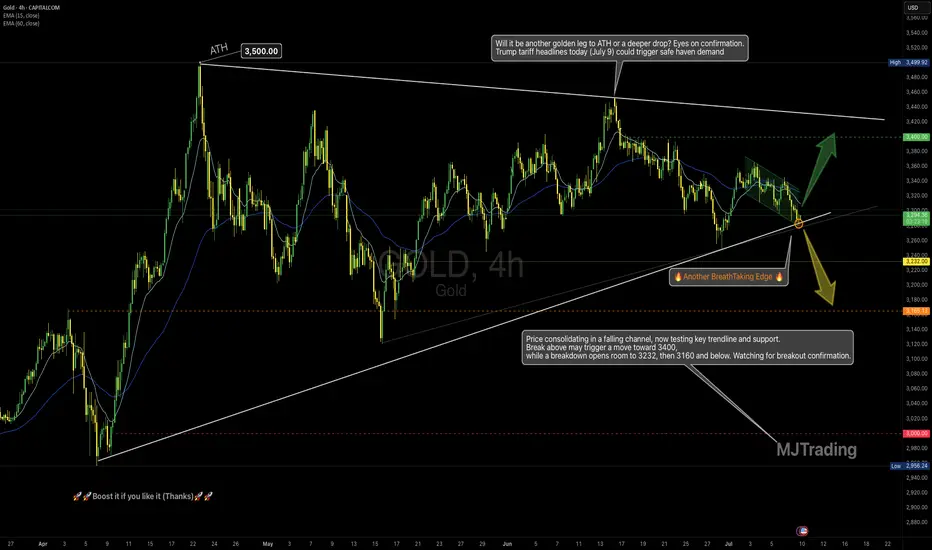
Gold at a Decision Point-Just as Tariff Headlines Return(July 9)📌
4H Technical Outlook by MJTrading
Price is compressing inside a falling channel, nested within a large symmetrical triangle, and now sits right at a high-stakes confluence zone — a perfect intersection of dynamic EMAs, rising trendline support, and local structure.
This could be a pivot point for the next major leg.
🧭 Key Scenarios:
🟢 Bullish Breakout Potential:
If price breaks above the falling channel and holds above $3,310–$3,320:
🎯 Target: $3,400, and eventually upper triangle resistance near $3,480–$3,500
✅ Watch for impulsive breakout + retest confirmation
🟡 Bearish Breakdown Risk:
If the rising trendline gives way and price closes below $3,275 (High Risk) and $3,245(Low Risk):
🎯 Targets: First $3,232, then key level $3,166
⚠️ Further weakness may expose $3,000 psychological support
🔍 Why It Matters:
• Symmetry + compression = potential volatility expansion
• Trump tariff headlines today (July 9) could trigger safe haven demand
• Strong historical respect of these trendlines
• EMAs aligning around decision zone
“Another BreathTaking Edge” — because this is one of those moments where market structure whispers louder than words.
🗣 Boost if you find value, and follow MJTrading for more clean setups.🚀🚀
#XAUUSD #Gold #TradingView #TechnicalAnalysis #ChartPatterns #PriceAction #BreakoutTrade #Forex #MJTrading
Zoom in to get closer to battlefield:
Zoom out to see where we are:
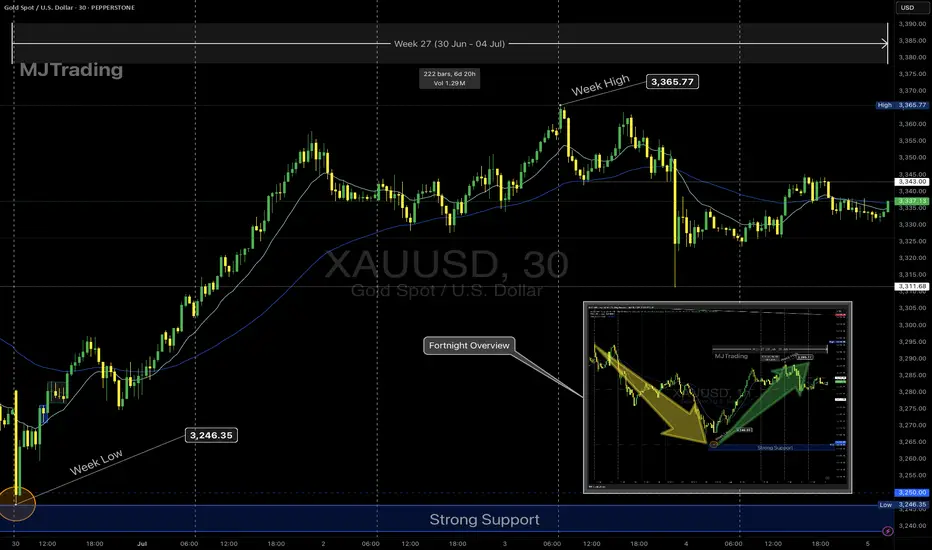
Gold Weekly Recap – Week 27 (30 Jun – 04 Jul)🟡 XAUUSD | MJTrading
Overview
Gold (XAUUSD) staged a significant recovery this week after retesting a critical support zone. Price action reflected strong buying interest at lower levels, followed by consolidation near mid-range resistance.
🔹 Key Levels:
Strong Support Zone: 3,246 – 3,250
Weekly Low: 3,246.35 (30 June)
Weekly High: 3,365.77 (3 July)
Closing Price: ~3,343
🔹 Price Action Summary:
✅ Early Week Retest & Reversal
After the prior week’s decline, gold opened the week near the major support area around 3,246. This zone acted as a strong demand pocket, triggering a swift rejection and initiating a bullish reversal.
✅ Sustained Rally to Resistance
Price climbed steadily, riding the 15-period EMA to reach the weekly high of 3,365.77 on 3 July. This move represented a nearly 4% recovery off the lows, fueled by renewed safe-haven flows and short covering.
✅ Midweek Consolidation
Following the rally, gold entered a sideways consolidation phase between 3,340 and 3,365. EMA flattening reflected a pause in momentum as traders assessed the next directional catalyst.
✅ Late-Week Pullback
Toward the end of the week, price tested the 3,310–3,320 area before modestly bouncing into the Friday close. Overall, the market maintained a cautiously bullish tone while holding above the prior support.
🔹 Technical Perspective:
🔸 Bias: Cautiously Bullish
Price defended the strong support and printed a higher low structure.
Sustained closes above 3,300 maintain the bullish outlook.
🔸 Near-Term Resistance:
3,365–3,390 remains the immediate supply zone to monitor for breakout attempts.
🔸 Key Support:
The 3,246–3,250 area continues to be the primary downside line in the sand.
🔹 Special Note – 4th July US Bank Holiday
Trading volumes were notably lighter on Thursday, 4th July, due to the US Independence Day holiday. This contributed to reduced liquidity and muted volatility, with many traders and institutions off desks. The thinner market conditions likely influenced the late-week pullback and consolidation, as participation was limited heading into the weekend.
🔹 Sentiment & Outlook
The decisive rebound from support suggests that buyers are defending value zones aggressively. However, failure to close the week above 3,365 leaves gold vulnerable to another retest of mid-range levels if fresh catalysts don’t emerge.
Traders should watch for:
A clean breakout above 3,365 to confirm continuation higher.
Any sustained weakness below 3,300 as a signal of fading bullish momentum.
🧭 Next Week’s Focus:
Monitoring whether the consolidation evolves into accumulation or distribution.
Watching for a breakout or deeper pullback
Reactions to upcoming economic data
EMA alignment: If the 15 EMA continues to track above the 60 EMA, it supports a bullish bias.
Chart Notes:
The main chart highlights this week’s action, while the inset provides a fortnight overview of the broader decline and recovery for context.
Thank you for your time and your support...
🚀🚀Boost it if you like it (Thanks)🚀🚀
#Gold #XAUUSD #GoldTrading #Forex #Commodities #TechnicalAnalysis #PriceAction #TradingRecap #MJTrading #GoldForecast #MarketReview #WeeklyRecap #TradingView
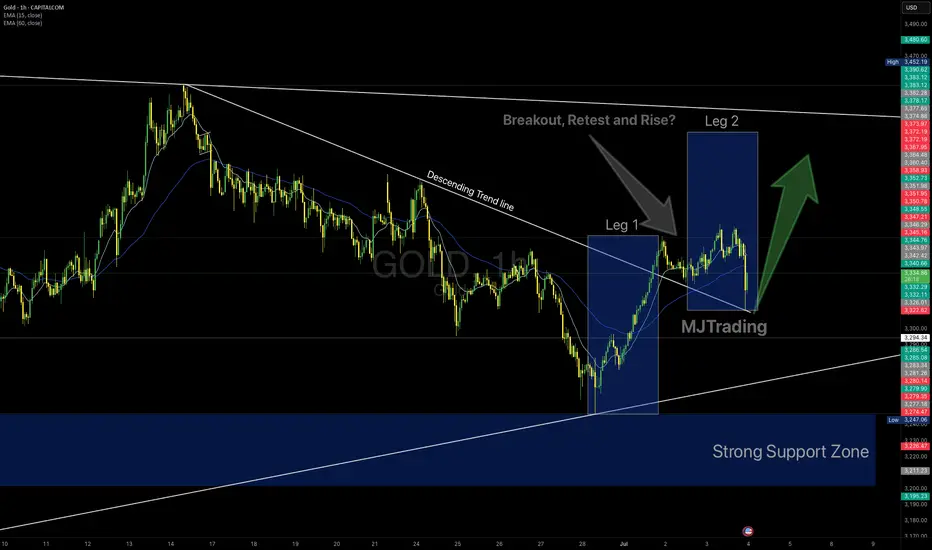
GOLD 1H – Breakout Retest or a Fragile Bullish Hope?👆🚀Boost it if you like it... (Thank you) 🚀👆
Gold has finally broken out above the descending trendline that has capped price for weeks. We’ve already seen Leg 1, an impulsive rally from the strong support zone, and a textbook retest of the broken trendline.
If bulls hold this level, a Leg 2 continuation could unfold.
Key Factors to Watch:
✅ Strong demand zone fueling the first leg up
✅ Clean breakout and retest of descending resistance
✅ Price still hovering around EMAs (15/60)
⚠️ However, the structure is fragile – lack of follow-through could trap late buyers
⚠️ If price loses the retest area decisively, sellers may reclaim control
Trading Insight:
This is a fascinating setup for bulls—but don’t fall in love with it. Stay adaptive. The market doesn’t owe us a second leg higher. Manage risk carefully and remember: probabilities, not certainties.
Trade Safely...
#MJTrading
#Gold #XAUUSD #TradingView #TechnicalAnalysis #BreakoutTrading #SupportResistance #PriceAction
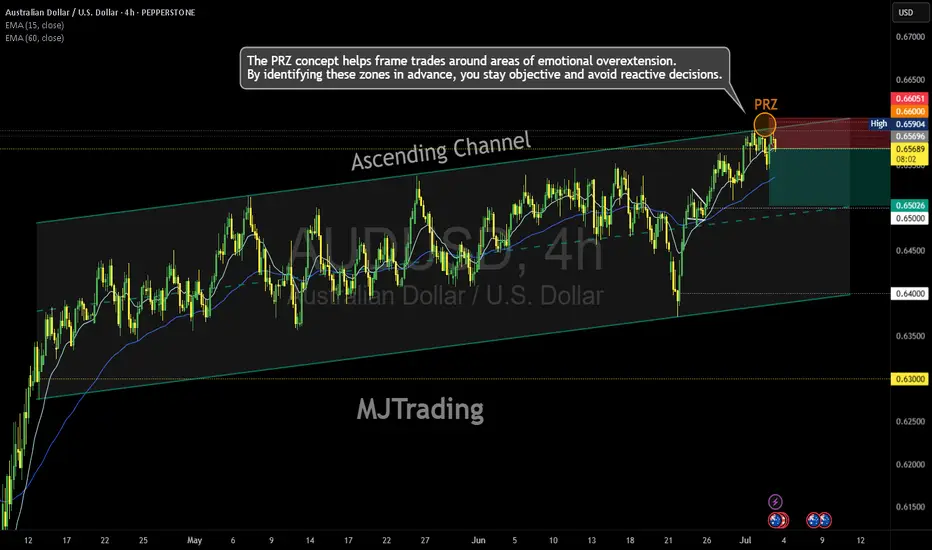
PRZ at 0.6600? | Watching for Reversal from Channel Top👆🚀Boost it if you like it... (Thank you) 🚀👆
Pair: AUD/USD Timeframe: 4H Bias: Short-term bearish Custom Term: PRZ (Possible Reversal Zone) = 0.65696
📈 Technical Structure:
AUD/USD is trading within a well-respected ascending channel, with price currently hovering near 0.6570. The upper boundary of the channel aligns closely with the PRP zone at 0.6600, which also coincides with:
A prior supply zone (visible on higher timeframes).
Confluence of the 15 EMA (0.65692) and 60 EMA (0.65534) flattening out.
Psychological round number resistance.
Entry: 0.65700
Stop: Above 0.66064 (channel breakout invalidation)
Target 1: 0.6540
Target 2: 0.6500
Risk/Reward: ~1.8
(Warning: This is an early entry )
🧠 Psychology Insight:
The PRP concept helps frame trades around areas of emotional overextension—where traders may overcommit to a breakout. By identifying these zones in advance, you stay objective and avoid reactive decisions.
PRZ: Possible Reversal Zone
#AUDUSD #PRZ #Forex #TechnicalAnalysis #ChannelTrading #ReversalZone #PriceAction #MJFX #TradingPsychology #ToughButSuccessful
AUDUSD – Bearish Breakdown Below EMA Support🚀👆 Boost it if you like it...👆🚀
Price has broken decisively below the EMA cluster after consolidating in a tight range. The strong bearish candle suggests momentum toward lower support levels.
Trade Plan:
✅ Entry:
Current price ~0.65545
✅ Stop Loss:
Above 0.657722 (last minor swing high)
✅ Target:
0.65340 – 0.6500 area (previous demand and round number support)
Context:
• EMA confluence failure
• Clear bearish momentum candle
• Clean risk-to-reward setup
Risk Management:
Risk per trade: 1%
Hashtags:
#AUDUSD #ForexSignals #PriceAction #Breakdown #MJTrading #TradingIdea #Forex