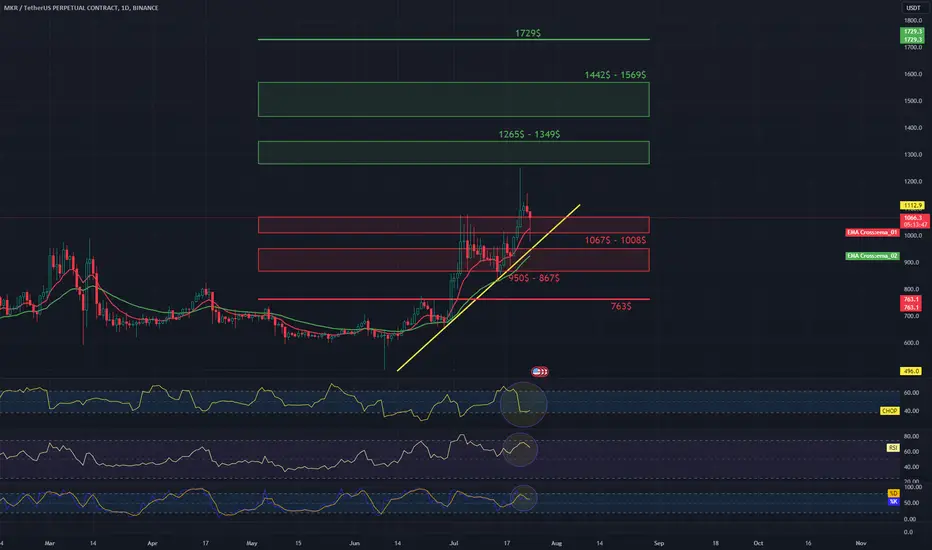
MKR 1D Review Long-TermI invite you to review the chart of MKR in pair to USDT. Here the price stays above the uptrend line
After unfolding the trend based fib extension grid, we see that we first have a support zone from $ 1067 to $ 1008, then we can mark the second support zone from $ 950 to $ 867, but when the zone does not hold the price, we can see a drop to the area of strong support at $ 763.
Looking the other way, we can similarly determine the places of resistance that the price has to face. And here we see that the price has rebounded from the beginning of the $1265 to $1349 resistance zone, then it needs to break through the second very strong zone from $1442 to $1569 and then it can move towards the resistance at $1729.
When we turn on the EMA Cross 10 and 30, we see that the MKR is moving in a local uptrend.
The CHOP index indicates that the energy has been used, the RSI is moving in the upper part of the range, which may result in a larger price correction, and the STOCH indicator shows that there is a lot of energy, which, combined with the RSI, may result in a price correction.