DOGEUSDT Analysis : Trendline Decision & Dual Directional Point📌 Market Context & Current Setup:
DOGEUSDT has been trading within a well-defined descending channel, respecting a strong trendline resistance, which has acted as a bearish ceiling for several sessions. The price action has been heavily influenced by supply zones formed after sharp impulsive drops, creating multiple QFL (Quick Flip Levels) — key to spotting structural bottoms and high-probability reversal zones.
Currently, the price is hovering near a critical decision point, where two key scenarios may play out:
A breakout and bullish reversal toward major resistance
A dip into a deep demand zone for final accumulation before reversal
Your plan reflects MMC (Market-Mind-Confirmation) methodology, preparing for either scenario with clear levels, logic, and psychology in place.
📐 Technical Breakdown:
🔻 1. Trendline Confirmation (Bearish Control):
The price has respected the downtrend line multiple times, confirming strong bearish momentum.
No candle body has closed decisively above it, showing sellers still have control.
However, price is now consolidating near this line, indicating a potential weakening of selling pressure — a classic sign of upcoming trend exhaustion.
🟩 2. Support Zones – Structural Layers:
📍 Minor Zone (S/R Flip – ~$0.215–0.220):
This zone is a previous support turned resistance.
It’s the first checkpoint the price needs to reclaim to confirm a breakout.
A successful flip from resistance back to support would add strong bullish confidence.
🟩 Reversal Zone (~$0.185–0.190):
Marked on your chart as a "Reversal Area" — likely derived from QFL methodology.
Price has historically bounced from this area, indicating buyers are willing to step in aggressively.
This zone aligns with smart money demand accumulation and could serve as a final liquidity sweep zone before a major reversal.
📍 Major Resistance Zone (~$0.250–0.260):
The next major objective once a trendline break is confirmed.
Also aligns with previous highs and volume nodes — a solid target for bullish trades.
🔄 Scenario-Based Strategy:
📈 Scenario 1 – Breakout Toward Major Resistance:
Price breaks above the descending trendline and reclaims the minor S/R zone.
This would confirm a bullish structure shift, validating that sellers are losing strength.
After reclaiming ~$0.215, the path toward $0.240–0.260 opens up.
Retests or flag breakouts within this range can be re-entry points for trend traders.
📉 Scenario 2 – Deeper Retest and Accumulation:
If the price fails to break out and dips further, the reversal demand area (~$0.185) becomes critical.
This is where buying pressure is expected to return, and as labeled in your chart:
👉 “If it goes down, we will double the supply”
This suggests an averaging-down or pyramiding strategy based on strong structural confidence.
This technique is valid only when the area is backed by solid confluence (trend exhaustion, demand, and past bounces).
🧠 MMC Strategy (Market – Mind – Confirmation):
Market: Bearish short-term trend, but price is approaching oversold territory near structural demand.
Mind: You’re prepared for both outcomes – breakout or dip. Emotion is out of the plan.
Confirmation: You wait for signs — break and retest of trendline, bullish engulfing candles, or wick rejections from demand.
This mental clarity helps maintain trading discipline and keeps emotional bias out of decision-making.
⚙️ Execution Plan:
Component Scenario 1 (Breakout) Scenario 2 (Deep Buy Zone)
Entry Signal Break & close above trendline + minor SR reclaim Bullish reversal candle within demand zone
Stop Loss Below trendline + S/R flip (~0.210) Below demand zone (~0.182)
Target 1 $0.235 $0.235
Target 2 $0.255–$0.260 $0.255–$0.260
Risk Level Medium Higher R:R potential
Strategy Notes Aggressive on confirmation only Add to position on wick traps
🧠 Trader Psychology Tips:
Be patient — confirmation beats prediction.
Set alerts at key levels to avoid emotional entries.
Scaling into trades based on zone reactions builds flexibility and control.
"Double the supply" approach must be paired with strict invalidation levels.
✅ Summary:
DOGE is trading within a descending wedge.
Key decision zones are marked clearly (trendline, S/R flip, reversal demand).
Breakout could lead to a quick 15–25% upside.
Reversal zone offers great R:R with accumulation opportunity.
Strategy is well-aligned with disciplined execution and trader psychology.
MMC

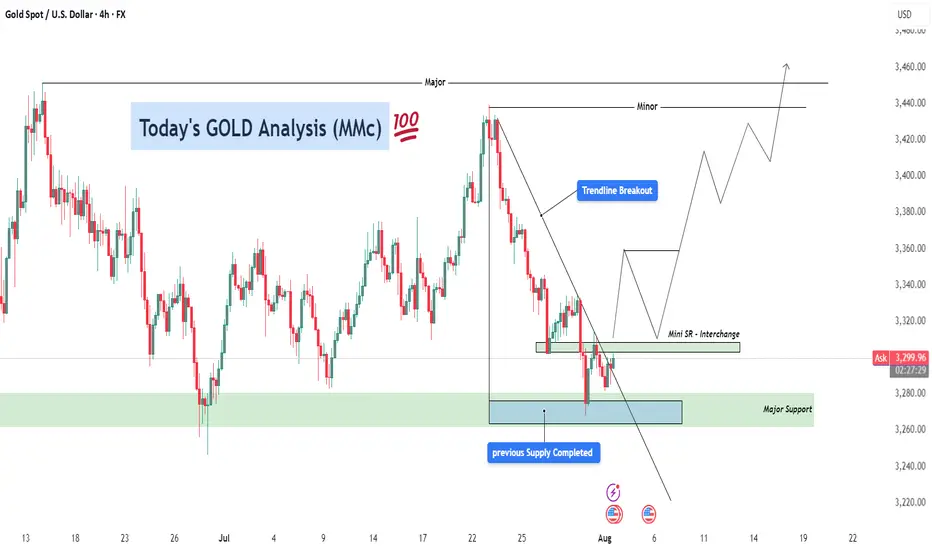
GOLD Analysis – Bullish Recovery Setup After Trendline Breakout ⚙️ Technical Structure Overview
This 4-hour chart of Gold (XAUUSD) illustrates a classic reversal setup developing after a significant correction. Price previously faced strong selling pressure from the 3,470+ zone and declined sharply. However, the recent price action suggests a shift in control from sellers to buyers, signaling a likely medium-term trend reversal or a bullish wave formation.
The key to this setup lies in three confluences:
Completion of a previous supply zone, which no longer holds influence.
Aggressive buyer activity from a major support zone.
A clean break above the descending trendline, which is a common signal that bearish momentum is losing strength.
🔑 Key Levels & Concepts Explained
🟢 1. Major Support Zone (3,260–3,280)
This zone has been tested multiple times and each time, buyers stepped in and prevented further downside. The most recent rejection from this area shows long wicks and bullish engulfing candles, indicating accumulation by institutional players. This is the foundational support that has held the entire corrective structure.
📉 2. Trendline Breakout
The descending trendline connecting swing highs has now been broken to the upside. This is a critical technical signal, especially on the 4H timeframe, as it suggests a potential trend reversal or at least a deep retracement in the opposite direction.
Trendline breakouts typically result in a retest of the trendline or a nearby support-turned-resistance zone (as is the case here with the Mini SR level).
It also implies that supply is weakening, and buyers are ready to push.
🧱 3. Mini Support/Resistance Interchange (~3,300–3,320)
This zone now plays the role of an interchange level—a previous minor resistance that could act as a support after the breakout. This level is crucial for intraday and swing traders because it can offer a low-risk long entry if price retests and confirms it with bullish momentum.
The chart projection suggests a bounce off this mini S/R, followed by successive higher highs and higher lows, forming a new bullish structure.
📈 Forecast Path & Trade Scenario
✅ Bullish Path (Preferred MMC Scenario)
Stage 1: Price retests the 3,300–3,320 zone (Mini S/R).
Stage 2: Buyers step in, leading to a bullish continuation.
Stage 3: Price targets the Minor Resistance (~3,440).
Stage 4: If momentum is sustained, it aims for Major Resistance (~3,470–3,480), completing a clean reversal formation.
This path reflects perfect bullish market structure—a breakout, followed by a retest and rally.
❌ Bearish Invalidation
If the price closes strongly below 3,260, the structure would be invalidated.
This would suggest that the support zone failed, possibly triggering deeper downside toward 3,220–3,200.
🧠 MMC Trader Mindset & Risk Considerations
Don’t Chase: Wait for a confirmed retest of the Mini S/R zone. Let the market come to your entry.
Entry Confirmation: Use candlestick signals like bullish engulfing, pin bars, or inside bars near the Mini S/R.
Volume Consideration: Volume should ideally rise on breakout legs and decline on pullbacks—this confirms healthy bullish structure.
Risk-Reward: With a stop below 3,260 and targets toward 3,470, the RR ratio favors long entries, especially after confirmation.
🔁 Summary Plan for Execution
Entry Zone: 3,300–3,320 (after bullish confirmation)
Stop Loss: Below 3,260 (structure break)
Take Profit 1: 3,440
Take Profit 2: 3,470–3,480
Risk-to-Reward: 1:2+ if planned carefully
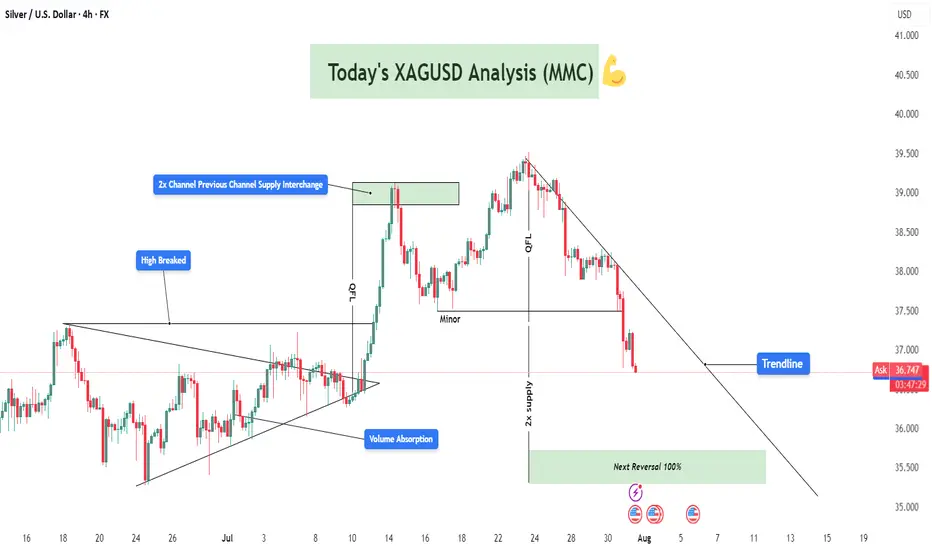
XAGUSD Analysis : Bearish Setup 2x Supply to Next Reversal Zone🔍 Market Context & Technical Overview
Silver (XAGUSD) has recently gone through a sharp corrective phase after breaking above a key structural high and retesting previous resistance. The current price action reflects a clean MMC-patterned behavior, including volume absorption, QFL trap, and interaction with a descending trendline that has now become critical for further directional bias.
🧠 Key Observations Based on MMC Principles
🔵 1. Volume Absorption at the Triangle Breakout
After a prolonged consolidation phase inside a triangle pattern, volume absorption took place—indicating hidden accumulation.
A breakout above the structure was confirmed with momentum (also breaking a previously established “High Breaked” level).
This breakout led to a vertical move towards the 2x Channel Supply Interchange Zone, where price reversed sharply.
🟥 2. Supply Interchange Zone (2x Confirmed)
Price encountered resistance at the green supply block, which acted as a 2x supply zone—a critical confluence where previous sellers re-engaged.
This area had previously served as the channel boundary, creating a supply interchange effect.
⚠️ 3. QFL Zone Trap (Fake Momentum)
The price printed a QFL structure, where it created a flat base, faked a move up, and quickly reversed.
The QFL base acted as a trap for late buyers, which aligned with the start of a bearish phase that is still ongoing.
📉 4. Downtrend & Trendline Respect
Price has respected a strong descending trendline since the reversal at supply.
Each retest has resulted in a lower high, confirming the bearish structure is intact for now.
Currently, the price is trading below this trendline, reinforcing short-term bearish sentiment.
📦 Key Levels to Watch
Zone/Level Type Role
38.70 – 39.20 2x Supply Zone Strong resistance, reversal origin
37.40 – 37.60 Minor Level Short-term support turned resistance
36.00 – 35.40 Next Reversal Zone ✅ High-probability long area, MMC expects reaction
Trendline Dynamic Structure control, needs break for bullish shift
🔁 Scenarios Based on Structure
📈 Scenario 1: Bullish Reversal from Green Demand Block
Price is approaching the next MMC reversal zone (green box below 36.00).
MMC logic suggests a 100% probability of bullish reaction based on:
Volume cycle completion
Downward exhaustion
Proximity to previous institutional accumulation zones
Expected move: bounce toward trendline retest and minor resistance at ~37.50.
📉 Scenario 2: Break Below Green Zone = Panic Sell
If the green zone fails to hold:
A panic drop toward 34.80–35.00 is possible.
However, based on MMC mapping, this is less likely without a major macro catalyst.
💡 Strategic Thoughts (MMC Traders’ Lens)
We’re observing a classic MMC Phase 3 correction following Phase 2 expansion.
The current cycle favors reaccumulation, especially if a wick or engulfing candle forms inside the green zone.
Price action traders should wait for confirmation (e.g., break of trendline, bullish structure on 1H) before entering.
📌 Educational Trade Plan (Not Financial Advice)
Setup Entry Zone Stop Loss Target 1 Target 2
Reversal Long 35.80 – 36.20 35.40 37.50 38.70
Trendline Break Long Above 37.10 36.40 38.00 39.00
Bearish Continuation Below 35.40 36.10 34.80 33.90
🧾 Conclusion & Final Note
Silver is trading at a make-or-break point as it approaches a high-probability reversal zone, identified through MMC methodology. Watch the price action near 36.00 closely—it holds the key to whether we begin a new bullish phase or extend this bearish cycle.
✅ MMC traders will stay reactive, not predictive, and align with structure.
🚨 Patience is key—let the market show its hand before commitment.
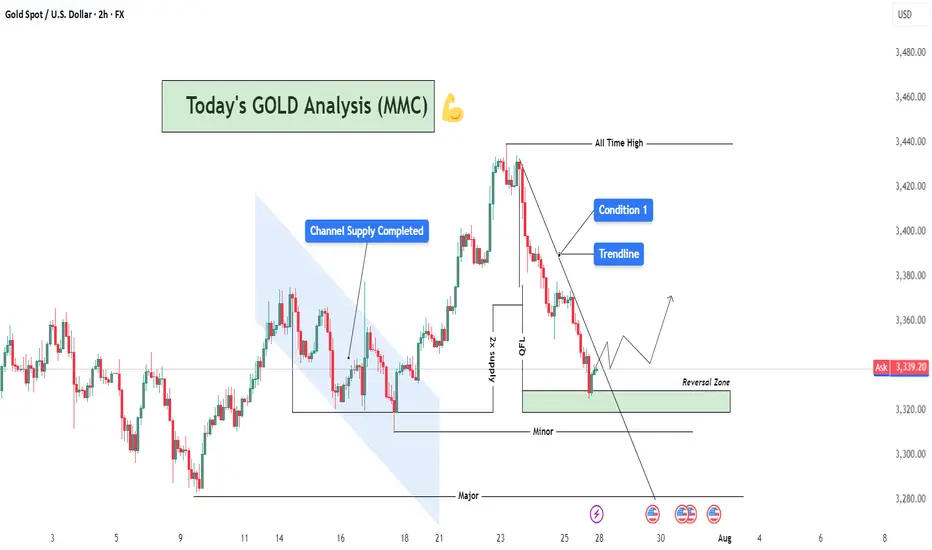
XAUUSD Analysis : Reversal Zone & Trendline Break Setup 🧠 Market Breakdown (Based on MMC Concepts)
Gold (XAU/USD) recently touched an All-Time High, followed by a sharp correction respecting a clean descending trendline — confirming strong selling pressure in the short term.
After price completed a Channel Supply zone (highlighted), it dropped significantly and created a 2x Supply Structure along with a QFL (Quasimodo Failure Level) — a strong indication of liquidity engineering by smart money.
Now, price has entered the Major Reversal Zone, which aligns with a key minor structural demand level. The reaction here becomes highly important, as it could mark the beginning of a new bullish leg.
📌 Technical Conditions
Trendline (Condition 1): Still active; breakout confirmation required for bullish entry.
Reversal Zone (Demand Area): Price currently reacting; signs of rejection forming.
Smart Money Behavior: Liquidity sweep + QFL zone = potential institutional accumulation.
Momentum Watch: Look for bullish engulfing or strong pin bar as confirmation.
🎯 Price Levels to Watch
Upside Targets:
🔹 TP1: 3,360 – 3,380
🔹 TP2: 3,420 – 3,440
Invalidation Zone:
🔻 Break and close below 3,300 = bearish continuation likely.
💡 Conclusion
Gold is approaching a decision point. If this reversal zone holds and we break the trendline, we could see a strong rally back toward previous supply zones. However, failure to hold could bring price lower for further liquidity grabs.
Stay patient. Let price confirm.
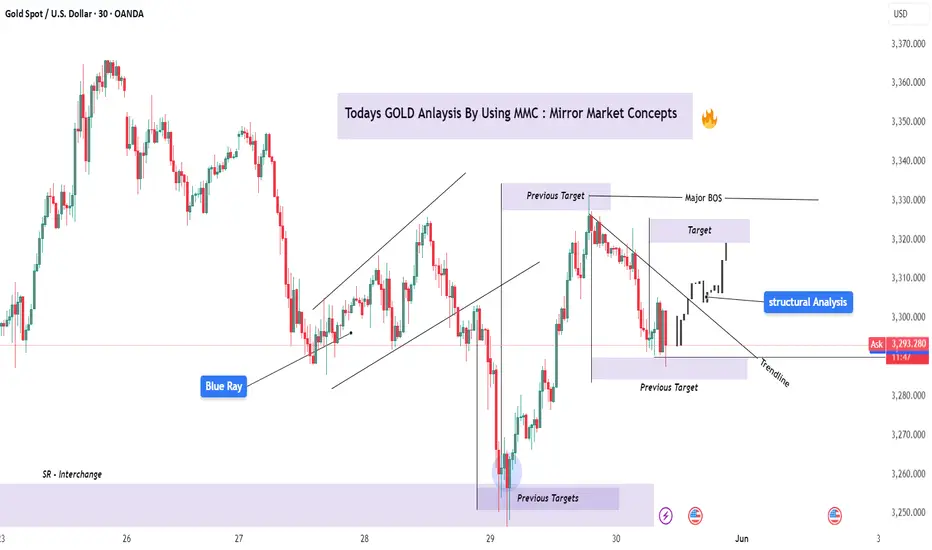
XAU/USD – Gold Analysis Using MMC & Structural Mapping + Target🔎 Market Narrative:
Today’s GOLD analysis is crafted through the lens of Mirror Market Concepts (MMC)—a powerful strategy where historical price behavior is mirrored in the current chart structure. This is combined with traditional structural analysis, offering a clear view of current price behavior, key breakouts, and target levels.
We’re currently seeing an interesting scenario unfold where the market structure is shifting from bearish to bullish, aligning with mirrored reactions from previous key zones.
🧠 MMC Breakdown & Price Psychology:
🔄 Mirror Reaction:
Notice how the market mirrored a previous aggressive sell-off with a similar bullish recovery. This “reflection” is a hallmark of MMC—where market sentiment repeats itself, but in opposite directions.
The "Previous Targets" zone acted as a key SR Interchange (support-turned-resistance / resistance-turned-support). Price dropped into this zone and bounced with strong bullish momentum, signaling smart money accumulation or potential liquidity grab before reversal.
🧱 Structural Analysis:
🔹 Trendline Observation:
A key trendline (drawn from the recent swing highs) was clearly broken, confirming that the bearish structure has shifted into a bullish one. The breakout was followed by a retest, further strengthening the validity of this move.
🔹 Support/Resistance Flip (SR Interchange Zone):
The Blue Ray zone marked on the chart is critical. This area held as support in the past and again acted as a launchpad for the recent upside move.
🔹 Previous Targets Reclaimed:
After hitting the previous support zone, price reversed sharply—another MMC principle in play. These zones often serve as liquidity magnets and reaction zones, where institutional traders are active.
📍 Key Levels To Watch:
✅ Current Support: $3,289–$3,295 (Previously broken resistance, now acting as support)
🎯 Immediate Target Zone: $3,310–$3,320
(This is where the price is expected to face short-term resistance. If broken, the next mirror move could extend further.)
🔻 Trendline Confirmation Level: $3,296
(Holding above this confirms bullish bias short-term)
🛠️ Trading Plan / Bias:
Bias: Bullish
Entry Idea: Look for bullish continuation above $3,296 after minor consolidation or retest
Risk Management: Place stop-loss just below $3,289 (previous demand zone)
Take-Profit: $3,310 – $3,320 zone initially
⚠️ Risk Consideration:
Gold can be volatile, especially during news events. Always assess macroeconomic factors (like Fed policy, NFP, CPI, etc.) and manage your trades with solid risk-to-reward ratios.
🧠 Final Thoughts:
This chart is a great example of how Mirror Market Concepts (MMC) can work hand-in-hand with price action and structure to provide clean, repeatable setups. By understanding the psychology behind price mirroring, we can better anticipate turning points and entry zones—especially when the structure confirms it.
Whether you’re a day trader or swing trader, this concept adds a layer of confluence to your technical analysis toolkit.
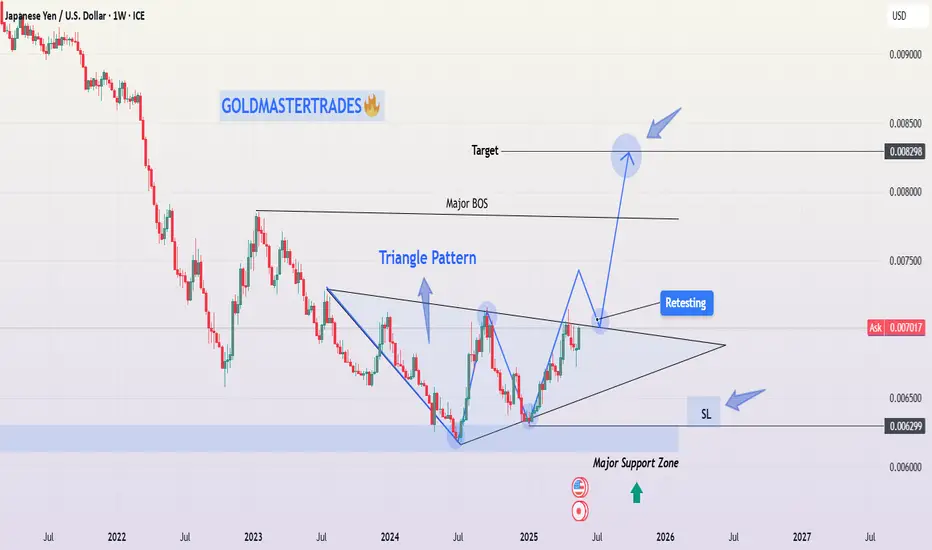
JPY/USD Weekly Chart – Bullish Triangle Breakout Pattern Forming🔍 Chart Pattern Breakdown:
The chart is showing a symmetrical triangle pattern forming on the weekly timeframe of JPY/USD (Japanese Yen vs. US Dollar). This triangle is developing after a massive multi-year downtrend, which started all the way back in 2021. Such a triangle at the bottom of a trend often signals a potential reversal or a strong trend shift.
Here's what's happening technically:
🔺 Triangle Formation (Consolidation Phase):
Lower highs and higher lows indicate a clear symmetrical triangle.
The price has been bouncing between these converging trendlines for months.
This compression is like a spring — it’s storing energy and getting ready to break out.
The triangle pattern is nearing its apex, which means a breakout is likely soon.
📉 Previous Trend Context:
Before the triangle, the market had a strong bearish move — a downtrend that brought the pair into a major weekly support zone.
This support zone (marked in light blue) around 0.0062–0.0063 has been tested and respected multiple times.
📊 Key Technical Zones:
Support Zone: 0.0062 – 0.0063 — this is where price bounced and formed the base of the triangle.
Resistance Zone / Triangle Top: Around 0.0071 – this is the upper boundary of the triangle. A breakout above this will confirm the bullish scenario.
Target Area: 0.00829 – derived from measuring the height of the triangle and projecting it from the breakout point.
Major BOS (Break of Structure): Once price breaks above the triangle and the BOS line, it confirms a shift from bearish to bullish structure.
SL Zone: Stop loss area is just below the support zone at 0.00629 to protect against false breakouts.
🔁 Retest Setup:
After the breakout, it's common to see a pullback to retest the previous resistance (now turned support). That retest often provides a high-probability entry for swing and position traders. If it happens — that’s your golden moment!
🎯 Trade Plan (Example for Education):
Entry Criteria Value/Zone
Breakout Entry Above 0.0071 (confirmed candle close)
Retest Entry 0.0069 – 0.0070 (support flip)
Stop-Loss (SL) Below 0.00629
Target (TP) 0.00829
✅ Why This Setup Matters:
Clear structure on the weekly chart.
Multi-touch points on both trendlines = strong pattern.
Support zone backing the triangle base gives extra conviction.
A breakout from such consolidation patterns often results in sharp movements.
Risk/reward ratio is highly favorable.
⚠️ Risk Management Reminder:
Always trade with a plan, use a stop-loss, and don’t jump into the breakout blindly. Volume confirmation or retest confirmation will help increase the success rate. These kinds of setups are powerful, but only when approached with discipline.
🧠 Final Thoughts:
This JPY/USD triangle on the weekly chart is a textbook example of potential bullish reversal from a major downtrend. It’s showing signs of a structural shift, supported by strong support, tightening price action, and the chance for a breakout to deliver a major upside move toward 0.00829.
If you’re a swing or position trader, keep this on your radar. Momentum is building — don’t miss the move when the breakout hits. 📈🔥
UpdatE: MMC, bought, Take Profit +8.12%, STOP Loss -1.59% NYSE:MMC
UpdatE: MMC, bought, Take Profit +8.12%, STOP Loss -1.59%
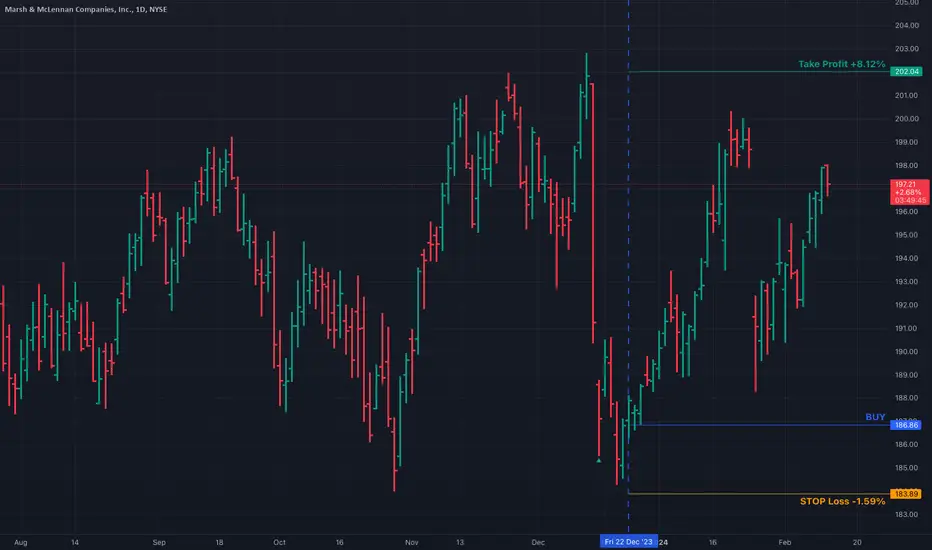
Marsh & McLennan Companies (MMC) Weekly Chart AnalysisCompany: Marsh & McLennan Companies
Ticker: MMC
Exchange: NYSE
Sector: Financial Services
Introduction:
Hello and thank you for taking the time to read my post. Today, we analyze the Marsh & McLennan Companies (MMC) chart on the weekly scale, focusing on a classic price pattern called the "Rectangle Pattern." Marsh & McLennan Companies is a global professional services firm operating in the financial services sector, traded on the NYSE under the ticker MMC.
Classic Rectangle Pattern:
The classic rectangle pattern is a chart pattern formed when the price of an asset moves between two parallel horizontal lines, representing support and resistance levels, over a period of time. In essence, it reflects a consolidation phase where the market is undecided about the direction of the trend.
Analysis:
In the case of MMC, we find a textbook example of a rectangular formation, with several points of contact to the upper and lower boundary. The resistance was at 177.32 and the support at 146.73. The price pattern has formed for 497 days, and now, for the first time, a weekly candle has closed above the resistance level of 177.32. The price is currently retesting the resistance as support, which provides an ideal entry opportunity. The price is clearly above the 200 EMA, implying a bullish environment.
Additional Analysis:
With the breakout above the resistance level, we should closely monitor MMC's price action for confirmation that the breakout is genuine and not a false breakout. A successful retest of the 177.32 level as support could signify that the breakout is valid, and we may expect the price to move towards the target at 203.53, which represents a ~15% price increase.
Conclusion:
The Marsh & McLennan Companies (MMC) weekly chart showcases a classic Rectangle Pattern, reflecting a consolidation phase in the market. A breakout above the resistance level and a successful retest as support indicate a bullish scenario. By closely monitoring the price action and support and resistance levels, traders can be better prepared for any potential price action in the future. As always, it's essential to consider risk management and proper position sizing when trading based on chart patterns.
Please note that this analysis is not financial advice. Always do your own due diligence when investing or trading.
If you found this analysis helpful, please like, share, and follow for more updates. Happy trading!
Best regards,
Karim Subhieh

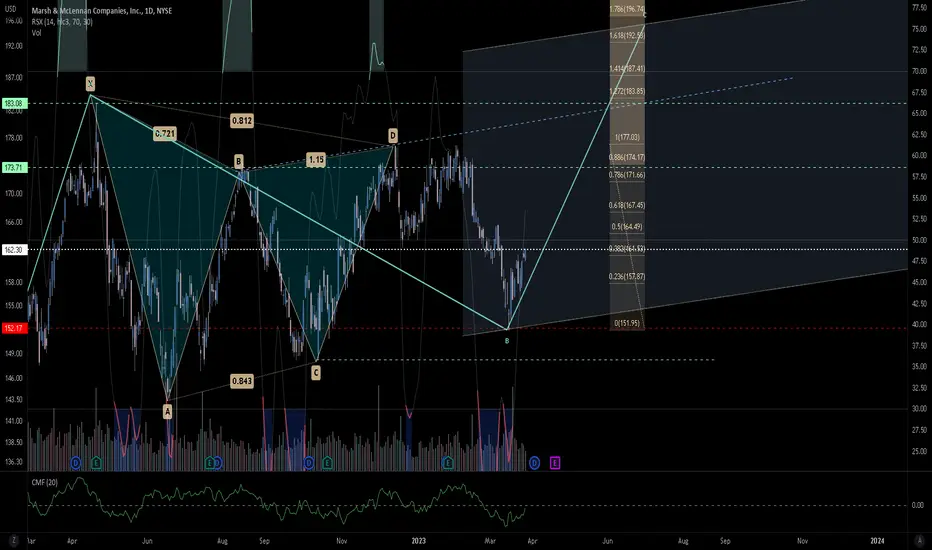
Bouncing up on Marsh&McLennan. MMCWithin a channel, looking like ABCDE according to Elliot. Volume flow toward longs, and I bet P/C Ratio is bullish also.
I never shared an idea on this one for a while, but you can see a Gartley painted in there and the result.
We are not in the business of getting every prediction right, no one ever does and that is not the aim of the game. The Fibonacci targets are highlighted in green with invalidation in red. Confirmation level, where relevant, is a pink dotted, finite line. Fibonacci goals, it is prudent to suggest, are nothing more than mere fractally evident and therefore statistically likely levels that the market will go to. Having said that, the market will always do what it wants and always has a mind of its own. Therefore, none of this is financial advice, so do your own research and rely only on your own analysis. Trading is a true one man sport. Good luck out there and stay safe.
MMC - Similar Trend Line Test InstancesMMC Is testing a parallel resistance zone This can be compared to a previous point in price evolution history where this occurred also Both situations will result in a short rejection

Buzz this yearIs there any intelligent life in crypto land?
People have jumped in this space on the assumption that we are only goin up. This reminds me of a certain film and can be broken down using key character traits.
So we have the followers; not doing much, if any analysis for themselves. Instead buying on the hope that Bitcoin & Crypto can only ever go up!
This isn't helped by the type of influencers who shill coins in pump n dumps and scream in all of their video's - Bitcoin is going to 100k. We saw Cowboy's like M & M crypto, Moonzilla Carl, Plan Bee, C or D and the Rover of Buybits or Big boy! (none of the real names used for no reason at all) The list could go on and on!!!!
Unfortunate for many - these Potato heads have little between the ears.
So although it's how I wanted to stop my drawing, I decided to complete it for this post.
I've said for over a year now here on @TradingView that charts need to go down as well as up. You could see it coming from a mile away. Well, lightyears away to tell the truth! Using techniques like Wyckoff and Elliott (and I've covered these in education terms, here on tradingview) Might seem a little prehistoric, but human sentiment will not change anytime soon!!!
So sometimes a playful dinosaur like @Paul_Varcoe streaming, is worth listening too.
Instead of only UP, UP and AWAY!!! Moon clowns!
Look at their calls and buying each top. And what did we do?
Like I said above - this was mapped out over a year ago now and still playing it's game!
So chill out, it's only doing it's thing! Don't follow the crowd or listen to cowboy's! Enjoy the weekend!!!!
Disclaimer
This idea does not constitute as financial advice. It is for educational purposes only, our principle trader has over 20 years’ experience in stocks, ETF’s, and Forex. Hence each trade setup might have different hold times, entry or exit conditions, and will vary from the post/idea shared here. You can use the information from this post to make your own trading plan for the instrument discussed. Trading carries a risk; a high percentage of retail traders lose money. Please keep this in mind when entering any trade. Stay safe.

Breakout on the MMC chart?NYSE:MMC
Yesterday the price closed above resistance, making a new ATH.
What are your expectations for MMC? Please leave a comment.
This is what I see on the chart, please correct me if I am wrong.
- We have a purple square as support, because MMC opened higher there is a small gap.
- I see a Cup and Handle pattern that started on 30-12-21.
Cup (30-12-21/7-4-22) Handle (8-4-22/19-4-22)
- There is a big volume shelf around $171, this could also indicate possible support.
- Price closed above the highs of 8-12-21 & 28-12-21 & 8-4-22. This means a new ATH,
What I expect: Maybe a small rally from here, or anyway a pullback to the old resistance level ($170.00). I hope that the former resistance level becomes a new support level (Principle of Polarity), and then the price soars to new highs.
This is no financial advise.


Market Review - Sunday, 08 December 2019MMC, AJG, SO, OMC, EIX, AFL, APD, AZN, D, GPC, HEI, LMT, MAA, TJX


Market Review - Sunday, 01 December 2019AON, TGT, OMC, AJG, SO, MMC, APD, AZN, CI, CPB, D, EIX, GWW, SO, Y, TGT

