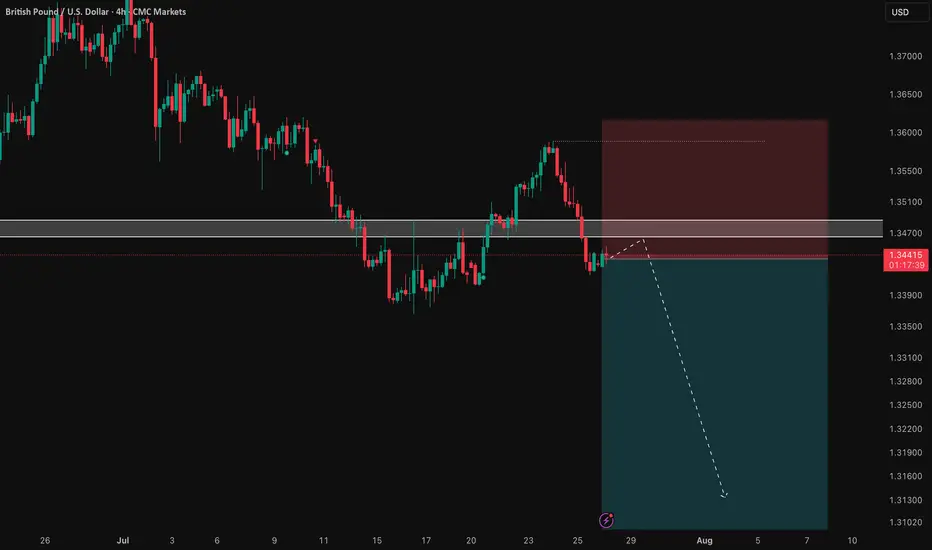
GBP/USD: Following the Bearish Trend to a Key LevelSharing my perspective on a potential short setup in GBP/USD.
This view is based on a combination of weakening UK fundamentals and a clear bearish technical structure.
📰 The Fundamental View
The main driver here is the growing difference in monetary policy. The Bank of England is signaling a more dovish stance due to recent soft economic data out of the UK. In contrast, the US economy is showing more resilience, which may keep the Federal Reserve on a less aggressive easing path. This fundamental divergence puts downward pressure on the Pound versus the Dollar.
📊 The Technical Picture
The chart supports this bearish bias. We can see a clear downtrend in place, defined by a series of lower highs and lower lows. Price is currently trading below its key moving averages, which often act as dynamic resistance. The critical level to watch is the 1.34377 price zone, which was a previous area of support and could now be tested as resistance.
🎯 The Strategy
The plan is to watch for bearish price action as we approach the 1.34377 key level. A rejection from this zone would provide a good opportunity to enter a short position, aiming to ride the next leg of the established downtrend.
As always, this is my own perspective. Manage your risk carefully and trade safe.
Monetarypolicy
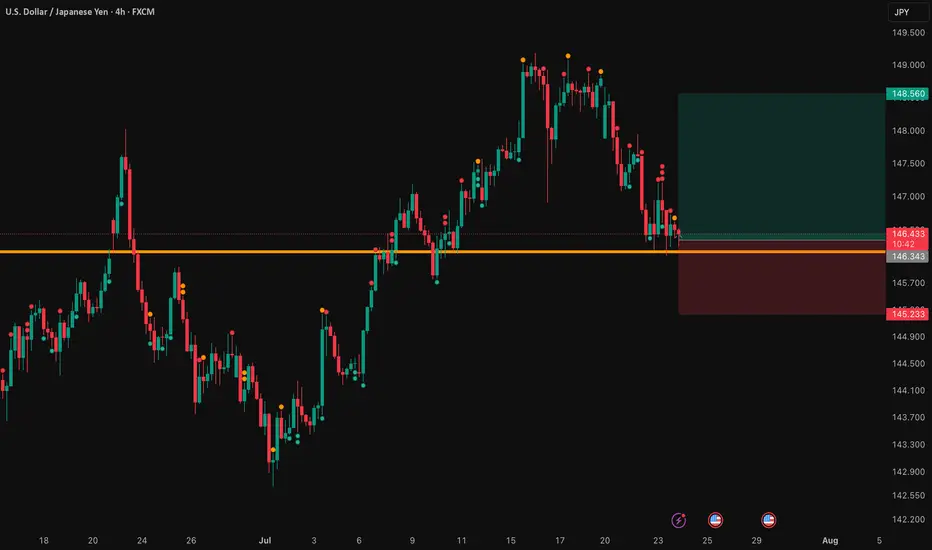
USD/JPY: A Bullish Thesis for Trend ContinuationThis analysis outlines a data-driven, bullish thesis for USD/JPY, identifying a strategic long entry within an established market trend. The setup is supported by a combination of fundamental catalysts and a clear technical structure.
📰 The Fundamental Picture
The primary driver for this trade will be the high-impact US economic data scheduled for release. This release is expected to inject significant volatility into the market. Fundamentally, this trade is a play on the deep policy differences between the US Federal Reserve and the Bank of Japan. While the Fed's future steps are a topic of debate, the Bank of Japan's policy remains one of the most accommodative in the world, creating a long-term headwind for the Japanese Yen. This dynamic provides a strong fundamental basis for relative US Dollar strength against the Yen.
📊 The Technical Structure
Chart analysis reveals that USD/JPY is in a confirmed and healthy uptrend. The current price action indicates a constructive pullback, presenting a strategic opportunity to join the dominant trend at a favorable price. The proposed entry point is positioned at a key technical level that offers a low-risk entry. Technical indicators support the continuation of the trend, suggesting that momentum remains with the bulls.
✅ The Trade Plan
This trade is structured with a clear and favorable risk-to-reward profile, aiming to capitalize on the established trend.
👉 Entry: 146.343
⛔️ Stop Loss: 145.233
🎯 Take Profit: 148.560
⚖️ Risk/Reward Ratio: 1:2
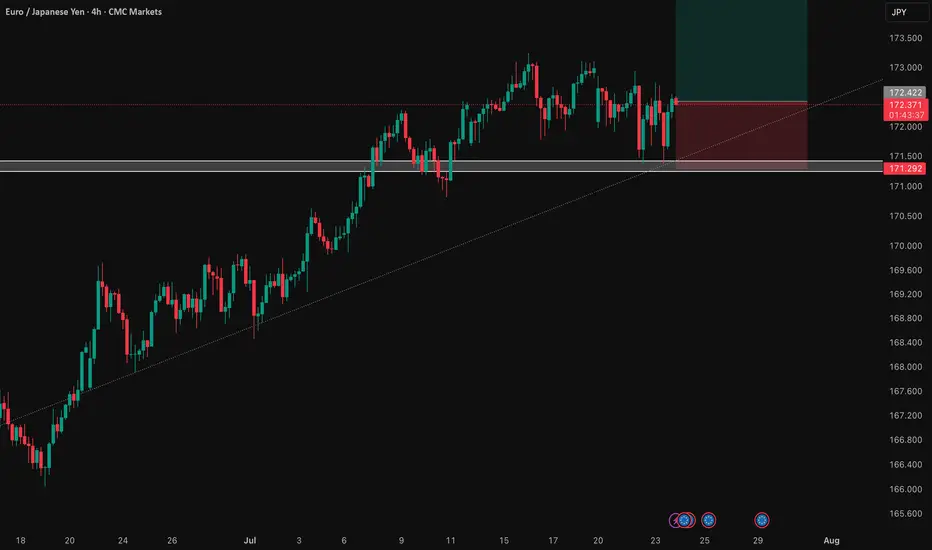
EUR/JPY: Bullish Thesis on Policy DivergenceOur primary thesis is built on a powerful confluence of compelling fundamental drivers and a clear technical structure. We are taking a long position in EUR/JPY with high conviction, anticipating significant upside fueled by a stark monetary policy divergence confirmed by a constructive chart formation.
📰 Fundamental Analysis: The core of this trade is the widening policy gap between the European Central Bank (ECB) and the Bank of Japan (BoJ). While the BoJ is only just beginning to exit its ultra-loose monetary policy, the global environment points toward continued JPY weakness. The upcoming high-impact US news will act as a major catalyst. A "risk-on" reaction to the data would significantly weaken the JPY, providing a strong tailwind for this trade.
📊 Technical Analysis: The chart structure for EUR/JPY is decidedly bullish. The pair has established a clear uptrend, and recent price action indicates a period of healthy consolidation above key support levels. This presents a strategic entry point, as the market appears to be gathering momentum for the next leg higher. The current setup suggests a low-risk entry into a well-defined upward trend.
🧠 The Trade Plan: Based on this synthesis, we are executing a precise trade with a favorable risk profile.
👉 Entry: 172.422
⛔️ Stop Loss: 171.292
🎯 Take Profit: 174.684
⚖️ Risk/Reward: 1:2
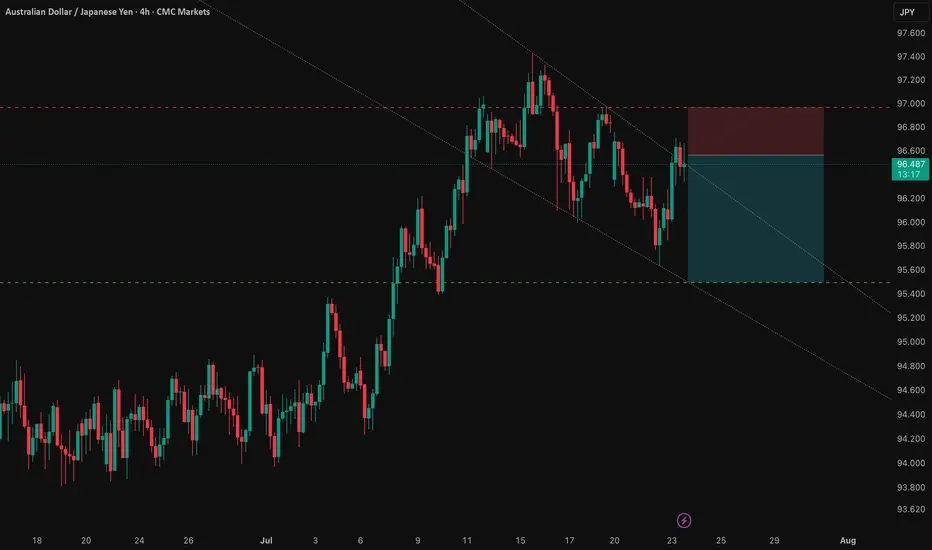
AUD/JPY: Capitalizing on the RBA-BoJ Monetary Policy GapThis analysis outlines a compelling short opportunity in AUD/JPY, driven by a powerful confluence of fundamental and technical factors. The trade is strategically positioned ahead of a key catalyst that could unlock significant downside potential.
1️⃣ The Core Thesis: A Clear Policy Divergence
The primary driver behind this trade is the stark and widening gap in monetary policy between the Reserve Bank of Australia (RBA) and the Bank of Japan (BoJ). The RBA is signaling a clear dovish pivot amid a weakening labor market, making an interest rate cut imminent. Conversely, the BoJ is in a tightening phase, creating a fundamental headwind for the AUD relative to the JPY. This divergence underpins the strategic bearish bias.
2️⃣ The Confirmation: Technical Alignment
This fundamental view is supported by a clear technical picture. The pair is in a well-defined downtrend and is currently testing a critical support level. This alignment of fundamental and technical factors presents a clear short opportunity, with the entry positioned for a breakdown below this key juncture.
3️⃣ The Catalyst: The RBA Bulletin
The immediate catalyst for this trade is the upcoming RBA Bulletin on July 24, 2025. Any dovish language from the RBA concerning Australia's economic outlook will likely reinforce expectations for a rate cut and accelerate the downward move in AUD/JPY.
The Trade Setup ✅
Here is the recommended trade setup:
📉 Trade: SHORT AUD/JPY
👉 Entry: 96.56200
⛔️ Stop Loss: 96.96386
🎯 Take Profit: 95.49900
🧠 Risk/Reward Ratio: 2.65
This setup offers a compelling risk-reward profile, capitalizing on a clear and powerful macroeconomic theme. The trade is designed to perform should the expected catalyst confirm the underlying bearish fundamentals.
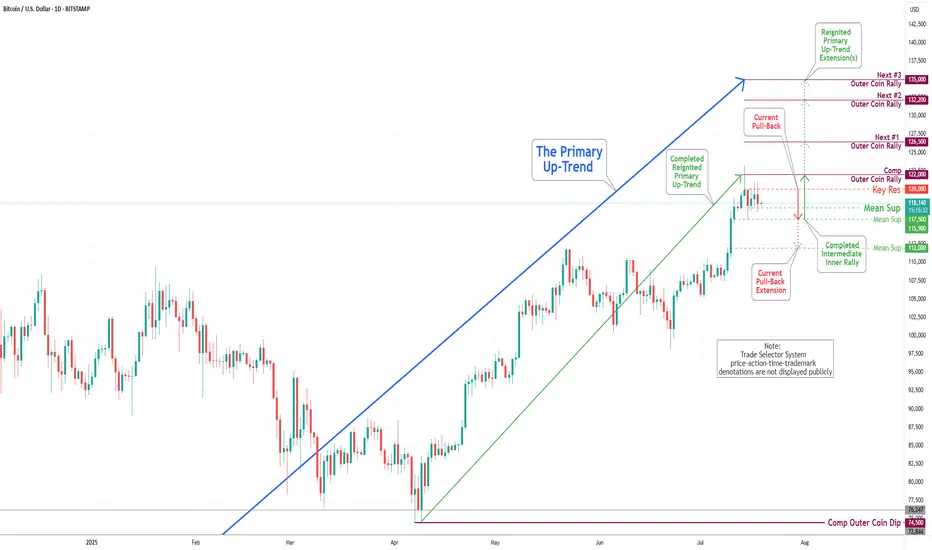
Bitcoin(BTC/USD) Daily Chart Analysis For Week of July 18, 2025Technical Analysis and Outlook:
In last week's trading session, we achieved a new historical high by completing our Outer Coin Rally at 122000. Following this milestone, the coin retraced, as expected, to the newly established Mean Support at 115900 and is currently trading at the Intermediate Mean Support at 117500. Presently, the coin is set to retest the Mean Support at 115900, with the potential for a further pullback to the Mean Support at 112000. This anticipated decline will necessitate a retest for the completed Outer Coin Rally at 122000. The designated targets for the renewed Primary Up-Trend are 126500, 132200, and 135000.
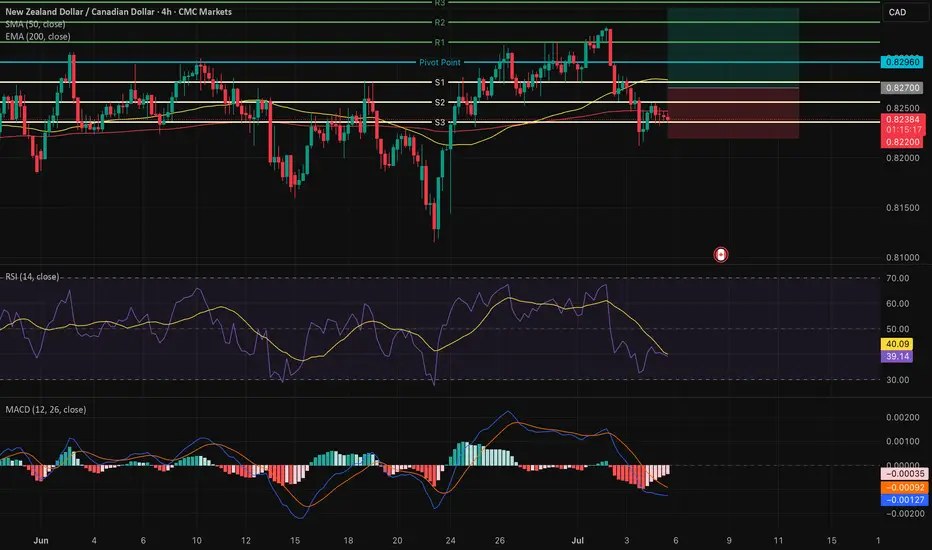
NZDCAD: High-Conviction Long - Fundamental Strength & TechnicalThis analysis identifies an extremely high-conviction long opportunity in the NZDCAD currency pair 📈🇨🇦🇳🇿. Our conviction is primarily driven by a significant divergence in monetary policy outlooks and economic fundamentals between New Zealand and Canada. New Zealand's economic resilience, underpinned by robust dairy prices and a less dovish central bank stance, contrasts sharply with Canada's decelerating growth, rising unemployment, and a central bank poised for further rate cuts amidst trade policy uncertainties. Technically, NZDCAD appears poised for an upward move from key support levels, supported by bullish momentum indicators on the 4-hour chart. This is a medium-term trade expected to play out over days to weeks. 🗓️
I. Fundamental Rationale: Diverging Economic Trajectories 📊🌍
The core of this trade lies in the starkly different economic paths New Zealand and Canada are currently on, creating a compelling fundamental case for NZD appreciation against CAD:
Monetary Policy Divergence:
New Zealand (NZD): The Reserve Bank of New Zealand (RBNZ) maintained its Official Cash Rate (OCR) at 3.25% in June 2025. Analysts anticipate a hold at the upcoming July 9 meeting, balancing growth concerns with an "uncomfortably high near-term inflation outlook". This signals a less aggressive easing path. 🏦🇳🇿
Canada (CAD): In contrast, the Bank of Canada (BoC) held its policy rate steady at 2.75% in June 2025, after nine consecutive 0.25% cuts since June 2024. Market expectations for the upcoming July 30, 2025 meeting indicate a 33% chance of a further 25 basis point cut, with economists anticipating gradual cuts to 2.25% by mid-2025. This clear easing bias is driven by consistently below-target inflation (1.73% in May 2025). 📉🇨🇦
Impact: This creates a clear and widening interest rate differential fundamentally favoring the NZD. 💰
Inflation Outlook:
New Zealand: Annual inflation accelerated to 2.5% in Q1 2025, exceeding market expectations and marking the highest rate since June 2024. This reinforces the RBNZ's cautious stance. ⬆️
Canada: Canada's CPI registered 1.73% in May 2025, notably below the BoC's 2.0% target, providing ample justification for further monetary easing. ⬇️
Economic Performance & Labor Market:
New Zealand: GDP is projected to grow by 1.9% in 2025. The unemployment rate remained unchanged at 5.1% in March 2025, with average hourly earnings increasing by 4.5% annually. 💼✨
Canada: Real GDP contracted by 0.1% in April 2025, with a flash estimate pointing to another 0.1% decline in May, implying an annualized loss of 0.3% in Q2 2025. The unemployment rate rose to 7.0% in May 2025, its highest since September 2016 (excluding pandemic years). 📉🏭
Impact: New Zealand demonstrates greater economic resilience and a more stable labor market. 💪
Commodity & Trade Dynamics:
New Zealand: Benefits significantly from surging dairy prices, its top export commodity, which saw a substantial 10% increase in Q1 2025, with Fonterra forecasting record milk prices and production volumes. This contributed to a robust monthly trade surplus of $1.2 billion in May 2025. 🥛🧀💰
Canada: While the CAD maintains a strong positive correlation with oil prices, energy exports decreased by 5.6% in May, with crude oil exports falling 4.0%. Furthermore, Canadian exports to the US have declined for four consecutive months due to ongoing US tariffs. 🛢️📉
Impact: Strong commodity tailwinds and a healthy trade surplus for NZD, versus tariff-induced headwinds and declining energy exports for CAD. 🌬️
Yield Differential: The New Zealand 10-year government bond yield (4.57% as of June 30, 2025) is notably higher than Canada's (3.38% as of July 3, 2025). This provides a positive carry for holding NZD over CAD. 📊
II. Technical Rationale: Chart Insights (4-Hour Timeframe) 📈🔍
The technical picture on the 4-hour chart supports a bullish reversal from current levels, complementing the fundamental outlook:
Current Price Action & Long-Term Trend: NZDCAD is currently approximately 0.8277 (as of July 1, 2025). While short-term analyses may show a "sharp bearish trend," the pair is described as "trading in an uptrend and currently is in a correction phase" as it approaches a key support area. The 1-month change for NZDCAD is +0.13%, and year-to-date is +2.45%, indicating a longer-term bullish bias despite recent fluctuations. This corrective dip presents a favorable entry point. 📉➡️📈
Key Support & Resistance Levels:
Entry Point (0.8270) is strategically chosen near the immediate support cluster, specifically around the Pivot Point 1st Support of 0.8276 and an identified buying opportunity zone around 0.82700. ✅
Take Profit (TP) of 0.8350 is positioned just below the Pivot Point 3rd Level Resistance of 0.8356. 🎯
Stop Loss (SL) of 0.8220) is carefully placed below the key support levels of 0.8240 (Pivot Point 3rd Support) and 0.8236 (Pivot Point 3rd Support). A sustained break below this level would invalidate the bullish thesis. 🛑
Momentum Indicators:
RSI (14): The 14-day RSI for NZDCAD is around 41.78 to 54.33, suggesting a neutral to slightly bullish sentiment, with room for upward movement. 📊
MACD (12, 26, 9): A "bullish divergence" has been identified on the hourly timeframe, often signaling a return of buying interest. The MACD line is also observed to be slightly above its signal line, hinting at a potential bullish crossover. ⬆️
Moving Averages: The 50-day Simple Moving Average (SMA) is positioned slightly above the 200-day Exponential Moving Average (EMA). This configuration suggests a potential bullish crossover of longer-term moving averages, generally considered a positive long-term signal. 📈
III. Trade Setup: 📋✨
Currency Pair: NZDCAD 🇳🇿🇨🇦
Direction: Long (Buy) ⬆️
Entry Point: 0.8270
Take Profit (TP): 0.8350
Stop Loss (SL): 0.8220
Calculated Risk (in pips): 50 pips
Calculated Reward (in pips): 80 pips
Risk-Reward Ratio: Approximately 1.6:1 (A favorable ratio for a high-probability setup!) ✅
Key Considerations: Always adhere to strict risk management principles, risking no more than 1-2% of your total trading capital on this single trade. Be mindful of potential volatility around upcoming high-impact economic events in July, particularly the RBNZ and Bank of Canada interest rate decisions, and inflation data. 🗓️🔔
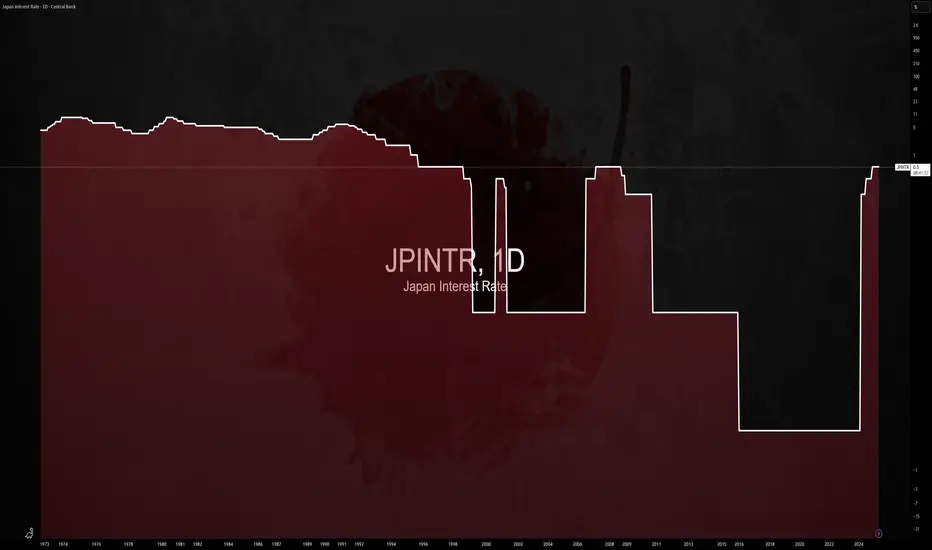
$JPINTR -Japan Interest Rates (June/2025)ECONOMICS:JPINTR
(June/2025)
source: Bank of Japan
- The Bank of Japan kept its key short-term interest rate unchanged at 0.5% during its June meeting, maintaining the highest level since 2008 and aligning with market expectations.
The unanimous decision underscored the central bank’s cautious stance amid escalating geopolitical risks and lingering uncertainty over U.S. tariff policies, both of which continue to pose threats to global economic growth.
Tokyo and Washington agreed to extend trade talks after failing to achieve a breakthrough during discussions on the sidelines of the G7 Summit in Canada. Meanwhile, as part of its gradual policy normalization, the BoJ reaffirmed its plan to cut Japanese government bond purchases by JPY 400 billion each quarter through March 2026.
Starting April 2026, it will then slow the reduction to JPY 200 billion per quarter through March 2027, targeting a monthly purchase level of around JPY 2 trillion—signaling a measured but steady path away from ultra-loose monetary policy.
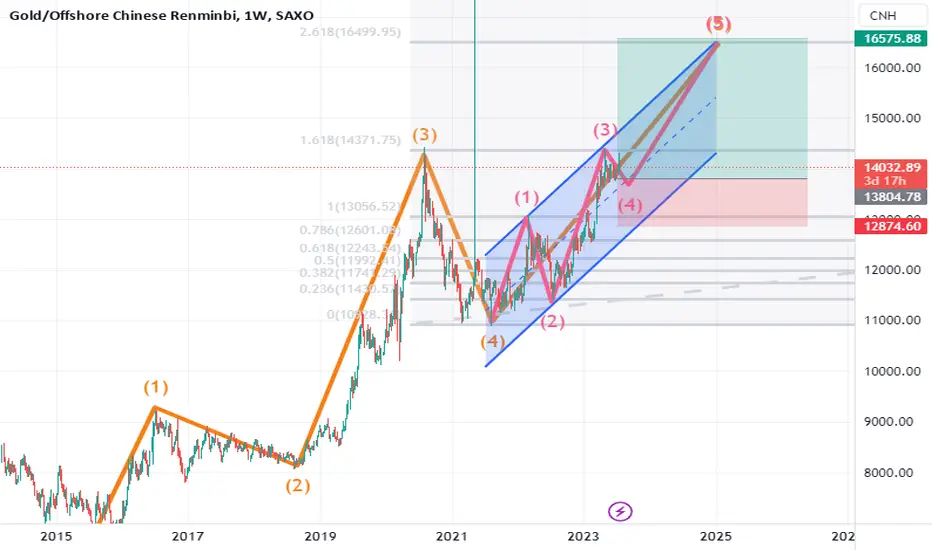
Gold Poised to Shine - 18% Upside Projected by Completing Wave 5Gold is currently trading around 494.92 RMB per gram in China as of July 25, 2023. Based on the technical analysis on XAUCNY showing we are currently in wave 5, subwave 4 of an upward trend, the prediction is that by January 2025, the price for 1 ounce of gold will reach 16575 RMB.
Given that 1 ounce equals 28.3495 grams, a price of 16575 RMB per ounce implies that the price per gram of gold is expected to reach around 584 RMB by January 2025.
This represents an increase of approximately 18% from the current price of 494.92 RMB per gram. Going from subwave 4 to subwave 5 typically signals the final leg of an advancing trend before it completes the larger degree wave 5. If the analysis is correct, we can expect the 18% price increase to occur over the next 1.5 years as gold enters the terminal subwave 5.
The ongoing expansionary monetary policies by central banks globally serves as a key driver supporting higher gold prices. High inflation levels in many economies incentivizes investors to allocate more funds to gold as an inflation hedge. Geopolitical tensions, such as the Russia-Ukraine conflict also increase safe-haven demand for gold.
While risks remain, such as potential interest rate hikes that strengthen the dollar, the overall backdrop still seems conducive for higher gold prices. From a technical perspective, the upside projection toward 584 RMB per gram over the next 1.5 years aligns with the view that subwave 5 will see accelerating upside momentum toward completing wave 5.
In summary, based on current technical analysis, the prediction is that gold will reach 584 RMB per gram by January 2025, an 18% increase from today's levels, as it completes the final wave 5 uptrend over the coming months. The macroeconomic and geopolitical environment also seem supportive of this view.
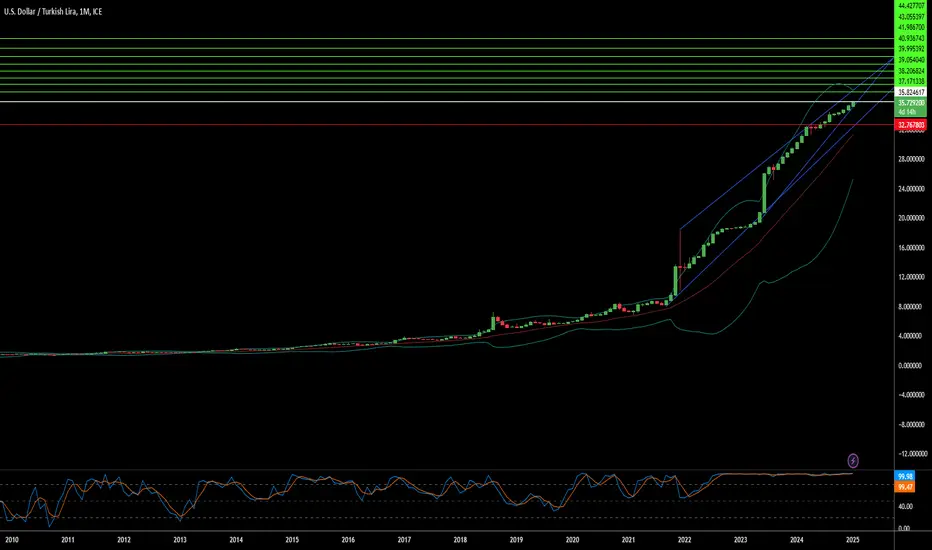
Can Turkey's Lira Dance with the Dollar?Turkey stands at a pivotal moment in its economic journey, navigating through the complexities of fiscal management and monetary policy to stabilize the Turkish Lira against the US Dollar. The nation has embarked on a strategic pivot towards domestic funding, significantly increasing the issuance of Turkish Government Bonds to manage soaring inflation and debt service costs. This approach, while stabilizing in relative terms, challenges Turkey to balance between stimulating growth and controlling inflation, a dance that requires both precision and foresight.
The Central Bank of Turkey's decision to cut rates amidst rising inflation paints a picture of calculated risk and strategic optimism. The bank is threading a needle between fostering economic activity and maintaining price stability by targeting a reduction in inflation over the medium term while allowing short-term increases. This policy shift, coupled with a focus on local funding, not only aims to reduce external vulnerabilities but also tests the resilience of Turkey's economy against global economic currents, including the impact of international political changes like the US election.
Globally, the economic landscape is fraught with uncertainties, and Turkey's strategy of maintaining a stable credit rating while forecasting a decrease in inflation sets an intriguing stage. The country's ability to attract investment while managing its debt profile, especially in light of global monetary policy shifts by major players like the Federal Reserve and the ECB, will be a testament to its economic stewardship. This narrative invites readers to delve deeper into how Turkey might leverage its economic policies to not only survive but thrive in a fluctuating global market.
The enigma of the USD/TRY exchange rate thus becomes a compelling study of economic strategy, where every policy decision is a move in a larger game of financial chess. Turkey's attempt to balance its books while dancing with the dollar challenges conventional economic wisdom and invites observers to ponder: Can a nation truly master its currency's fate in the global marketplace?
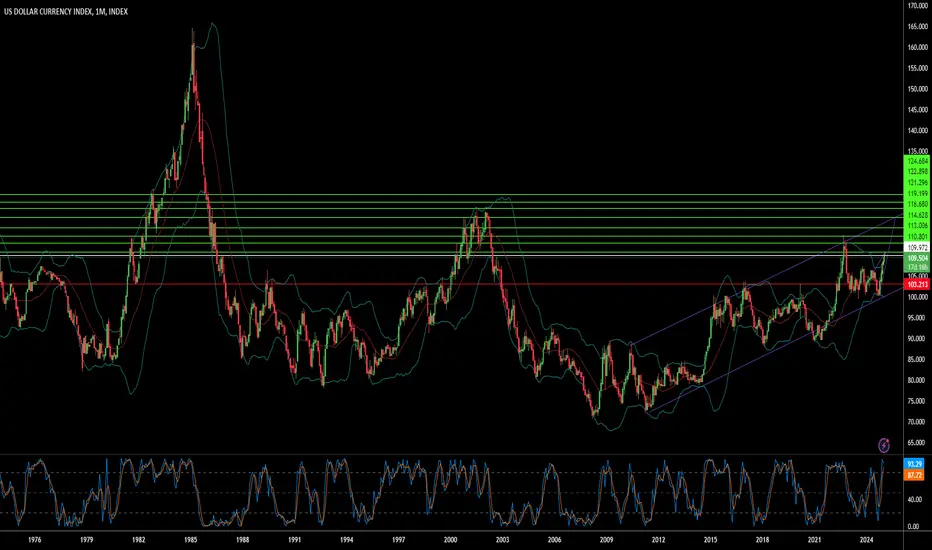
Can the Dollar Index Predict Global Chaos?In the intricate dance of global finance, the U.S. Dollar Index has emerged as a pivotal player, reaching heights unseen in over two years. This surge, coinciding with Donald Trump's anticipated return to the White House, underscores a market bracing for significant policy shifts. The index's climb is not just a number; it's a beacon reflecting the resilience of the U.S. economy amidst high interest rates and a low unemployment rate, painting a picture of optimism where investors envision a 'goldilocks' scenario under new economic policies.
However, this rise is shadowed by tariff threats, hinting at potential global trade disruptions. The depreciation of European currencies against the dollar signals a market in flux, with investors recalibrating their strategies in light of possible protectionist measures. This scenario challenges us to ponder the broader implications: How will these tariffs reshape international trade dynamics, and what does this mean for the global economic order that has favored open trade for decades?
The Dollar Index's ascent also prompts a deeper reflection on currency as a barometer of geopolitical stability. With the U.S. potentially stepping into a new era of economic policy, the world watches closely. This moment invites investors and policymakers alike to consider global economic relations' immediate impacts and long-term trajectory. Will this lead to a reevaluation of the dollar's role as the world's reserve currency, or will it strengthen its position amidst global uncertainties? This question is not just about economics; it's about understanding the undercurrents of power and influence in a world at a crossroads.
Forex Traders Await the Fed's DecisionForex Traders Await the Fed's Decision
The Federal Reserve is set to announce its interest rate decision today at 21:00 GMT+2, with Fed Chair Jerome Powell holding a press conference 30 minutes later. According to Forex Factory, the market expects a rate cut to 4.25%-4.50% from the current 4.50%-4.75%.
Analysts at Apollo Global Management, in their Economic Outlook, predict:
→ In 2025, the Fed will continue lowering rates but at a slower pace than the market anticipates;
→ By the end of 2025, the rate is expected to settle at 4.0%.
In anticipation of today's decision, the currency markets are experiencing a period of calm.
The technical analysis of the EUR/USD chart shows that the pair consolidates between the upper boundary of a descending channel and the lower black support line, forming a narrowing triangle pattern (highlighted in purple).
Today's Fed meeting could trigger a surge in volatility, potentially driving sharp movements in USD pairs. For EUR/USD, opposite scenarios are possible:
→ An upward movement with a bullish breakout of the upper boundary of the long-term descending channel;
→ Continuation of the downtrend with a breakout below the lower black support line.
This article represents the opinion of the Companies operating under the FXOpen brand only. It is not to be construed as an offer, solicitation, or recommendation with respect to products and services provided by the Companies operating under the FXOpen brand, nor is it to be considered financial advice.

4-Year Cycles [jpkxyz]Brief Introduction why Crypto moves in Cycles.
"Crypto is an expression of Macro."
The 2007-2008 global financial crisis was a pivotal moment that fundamentally transformed monetary policy, particularly in how central banks manage economic cycles through liquidity manipulation.
Before the crisis, central banks primarily used interest rates as a blunt instrument for economic management. The 2008 financial crisis exposed deep vulnerabilities in the global financial system, particularly the interconnectedness of financial institutions and the risks of unregulated credit markets.
In response, central banks, led by the Federal Reserve, developed a more sophisticated approach to economic management:
1. Quantitative Easing (QE)
The Federal Reserve introduced large-scale asset purchases, essentially creating money to buy government bonds and mortgage-backed securities. This unprecedented monetary intervention:
- Prevented a complete economic collapse
- Provided liquidity to frozen credit markets
- Kept interest rates artificially low
- Supported asset prices and prevented a deeper recession
2. Synchronized Global Monetary Policy
Central banks worldwide began coordinating their monetary policies more closely, creating a more interconnected approach to economic management:
- Coordinated interest rate decisions
- Shared information about economic interventions
- Created global liquidity pools
3. Cyclical Liquidity Management
The new approach involves deliberately creating and managing economic cycles through:
- Periodic liquidity injections
- Strategic interest rate adjustments
- Using monetary policy as a proactive economic tool rather than a reactive one
The 4-year cycle emerged as a pattern of:
- 2-3 years of expansionary policy
- Followed by a contraction or normalization period
This cycle typically involves:
- Expanding money supply
- Lowering interest rates
- Supporting asset prices
- Then gradually withdrawing support to prevent overheating
The 2007-2008 crisis essentially forced central banks to become more active economic managers, moving from a passive regulatory role to an interventionist approach that continuously adjusts monetary conditions.
This approach represents a significant departure from previous monetary policy, where central banks now see themselves as active economic architects rather than passive observers.

Can a Currency's Destiny Be Rewritten?The Hungarian forint stands at a critical crossroads, embodying a profound economic narrative that extends far beyond mere exchange rates. Its persistent decline—losing 59% against the US dollar over a decade—represents more than a statistical anomaly; it symbolizes a nation's complex struggle with monetary sovereignty, economic strategy, and global financial integration. This isn't simply a story about currency depreciation, but a nuanced exploration of how economic policies intersect with political ambitions and market realities.
At the heart of this financial drama lies a compelling debate about euro adoption, which has transformed from a distant possibility to an increasingly urgent consideration. Investment experts like Viktor Zsiday are challenging the very sustainability of maintaining an independent currency that appears systematically mismanaged. The forint's trajectory reveals deeper structural challenges: while a weaker currency has temporarily benefited Hungary's export-oriented economy, it has simultaneously obscured fundamental competitiveness issues and exposed the country to significant economic vulnerabilities.
The unfolding scenario presents a fascinating intellectual puzzle for economists and policymakers. With the Hungarian National Bank preparing for leadership transition and the government maintaining a complex stance on monetary policy, the forint represents a living case study of the delicate balance between national autonomy and global economic integration. The potential shift towards a more dovish monetary approach could either destabilize the currency further or open new pathways for economic recalibration, making this a moment of critical strategic significance.
As Hungary confronts these intricate monetary challenges, the forint's journey becomes a metaphorical lens through which we can examine broader questions of economic adaptation, political will, and national economic strategy. The coming months will likely reveal whether Hungary will embrace transformative monetary reforms or continue navigating its current uncertain trajectory—a decision that could reverberate far beyond its borders and provide valuable insights into the complex dynamics of emerging market economies in an increasingly interconnected global financial landscape.

When Do Breaking ATMs Signal More Than Just Technical Failure?In a fascinating twist of economic irony, Turkey's banking system faces a crisis not from a shortage of money, but from an overwhelming abundance of near-worthless banknotes. This peculiar situation, where ATMs physically break down from dispensing too many low-value bills, serves as a powerful metaphor for the broader economic challenges facing emerging markets in an era of hyperinflation.
The numbers tell an extraordinary tale: a 700% currency depreciation since 2018, 80% of circulating notes being the highest denomination available, and a stark disparity between official inflation rates of 49% and independent estimates of 89%. Yet perhaps most intriguing is the government's reluctance to print larger denominations – a psychological barrier rooted in the traumatic memory of million-lira notes from the 1990s. This resistance to adaptation, despite the obvious operational strain on the banking system, raises profound questions about the role of political psychology in economic policy-making.
What emerges is a complex narrative about the intersection of technological capacity, monetary policy, and human psychology. As Turkish banks spend entire days counting money for simple transactions and regulators continuously delay implementing hyperinflationary accounting standards, we witness a unique case study of how modern financial systems can be overwhelmed not by sophisticated cyber threats or market crashes, but by the sheer physical weight of devalued currency. This situation challenges our traditional understanding of banking crises and forces us to reconsider the practical limits of monetary policy in an increasingly digital age.
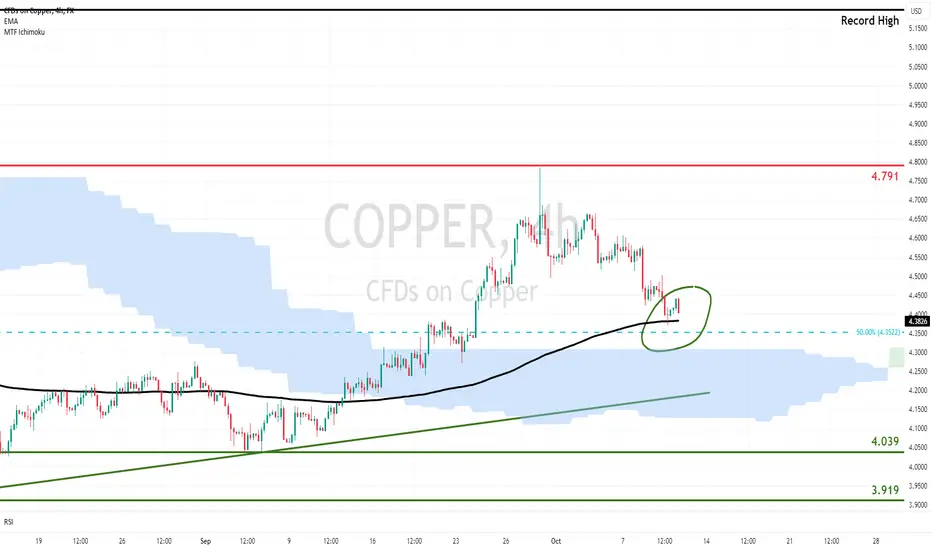
Copper Pulls Back as China Optimism FadesCopper extended the August rebound into autumn and reached three-month highs, helped by the Fed’s jumbo rate cut and massive stimulus from Chinese authorities aiming to prop the economy and the property sector. However the measures do little to address the structural problems and the real estate market is unlikely to return to its former glory, while the lack of follow through on the fiscal front this week caused prior optimism to subside. Furthermore, the Fed has struck a more cautious approach towards further easing and Friday’s strong jobs report supported the reserved commentary. Markets have now priced out previous aggressive bets for 75 bps of cuts this year, aligning with the Fed’s 50 bps projections.
Copper pulls back as a result, threatening the EMA200 (black line) and the 50% Fibonacci of the recent recovery. A breach would pause the upside bias, send the non-ferrous metal into the daily Ichimoku Cloud and expose it to the ascending trend line from the August lows. Deeper correction however does not look easy under the current technical and fundamental backdrop.
There are still hopes for additional Chinese stimulus (potentially within the weekend), while prospects of US soft-landing and easier monetary policies in major economies can support higher prices. So do the AI boom and the green energy transition. Copper tries to defend the EMA200 that maintains its recovery momentum. This will allow it to push again towards 4.791, but we are cautious around further strength at this stage.
Stratos Markets Limited (www.fxcm.com):
CFDs are complex instruments and come with a high risk of losing money rapidly due to leverage. 64% of retail investor accounts lose money when trading CFDs with this provider . You should consider whether you understand how CFDs work and whether you can afford to take the high risk of losing your money.
Stratos Europe Ltd (trading as “FXCM” or “FXCM EU”) (www.fxcm.com):
CFDs are complex instruments and come with a high risk of losing money rapidly due to leverage. 66% of retail investor accounts lose money when trading CFDs with this provider . You should consider whether you understand how CFDs work and whether you can afford to take the high risk of losing your money.
Stratos Trading Pty. Limited (www.fxcm.com):
Trading FX/CFDs carries significant risks. FXCM AU (AFSL 309763). Please read the Financial Services Guide, Product Disclosure Statement, Target Market Determination and Terms of Business at www.fxcm.com
Stratos Global LLC (www.fxcm.com):
Losses can exceed deposits.
Any opinions, news, research, analyses, prices, other information, or links to third-party sites contained on this video are provided on an "as-is" basis, as general market commentary and do not constitute investment advice. The market commentary has not been prepared in accordance with legal requirements designed to promote the independence of investment research, and it is therefore not subject to any prohibition on dealing ahead of dissemination. Although this commentary is not produced by an independent source, FXCM takes all sufficient steps to eliminate or prevent any conflicts of interests arising out of the production and dissemination of this communication. The employees of FXCM commit to acting in the clients' best interests and represent their views without misleading, deceiving, or otherwise impairing the clients' ability to make informed investment decisions. For more information about the FXCM's internal organizational and administrative arrangements for the prevention of conflicts, please refer to the Firms' Managing Conflicts Policy. Please ensure that you read and understand our Full Disclaimer and Liability provision concerning the foregoing Information, which can be accessed via FXCM`s website:
Stratos Markets Limited clients please see: www.fxcm.com
Stratos Europe Ltd clients please see: www.fxcm.com
Stratos Trading Pty. Limited clients please see: www.fxcm.com
Stratos Global LLC clients please see: www.fxcm.com
Past Performance is not an indicator of future results.
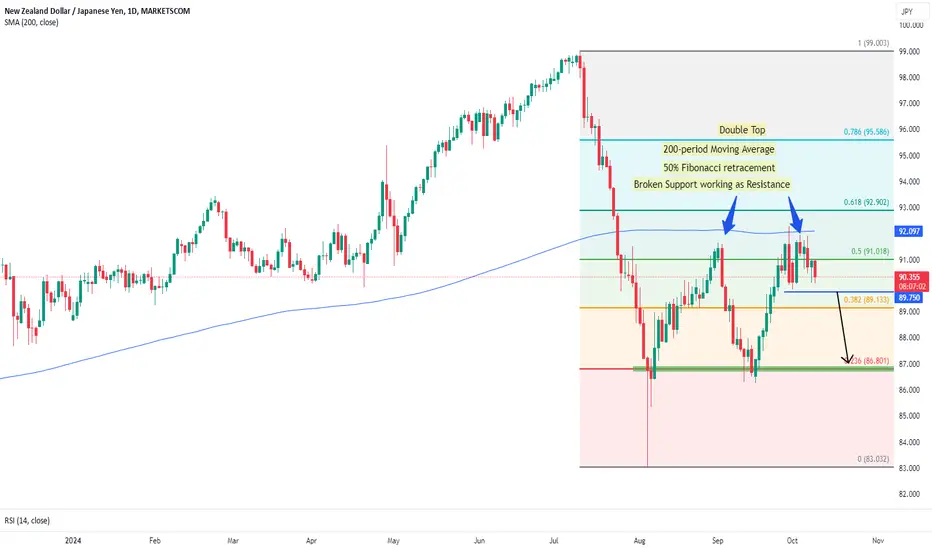
NZDJPY breaks 200-day SMA; downward movement imminent?The New Zealand dollar to Japanese yen currency pair (NZD/JPY) saw an uptrend on the daily chart from March 2020 to July 2024, gaining 66.58% over the four-year period.
Recently, however, the pair broke below the 200-day Simple Moving Average (SMA) on the daily chart, signaling a potential trend reversal. The 200-day SMA, which had served as support for four years, now appears to be acting as resistance.
Additionally, the NZD/JPY formed a double top, indicating that buyers were once more unable to push the price above the 92.00 mark. This double top region coincides with the 50% level of the bearish Fibonacci.
Upward trend in NZDJPY driven by RBNZ-BOJ interest rate differential
The strong upward trend had been driven by the interest rate differential between the New Zealand dollar and the Japanese yen.
New Zealand, like many countries around the world, slashed interest rates during the COVID-19 pandemic to stimulate its economy. However, as the economy began to recover, the Reserve Bank of New Zealand (RBNZ) moved to raise rates to control inflation and avoid rampant price increases.
With inflation now under control, the RBNZ has started cutting rates, with yesterday marking the third consecutive cut, as the central bank reduced New Zealand’s key interest rate from 5.25% to 4.75%.
Japan, on the other hand, followed the opposite path, keeping its interest rate below 0 while other countries raised borrowing costs to control inflation — which is why the JPY has depreciated so much in recent years.
However, in its most recent meetings, the Bank of Japan (BOJ) — Japan’s central bank — changed its stance and raised interest rates for the first time since 2016.
With New Zealand’s interest rate declining and Japan’s interest rate increasing, there is potential for a medium-term devaluation of the NZD against the JPY.
Downward movement in NZDJPY possible in coming months
From a technical perspective, the following factors are at play:
1. Break of the uptrend on D1.
2. The 200-day SMA, which previously acted as support, is now serving as resistance.
3. A double top has formed on the daily chart.
4. The 50% Fibonacci region is bearish.
Considering these technical factors and the diverging monetary policies of the central banks in Japan and New Zealand, a downward movement in NZD/JPY is possible in the coming months.
If the price manages to break below 89.75, it is possible that it will fall to the 86.70 region in a few days.
Disclaimer:
74% of retail investor accounts lose money when trading CFDs with this provider. You should consider whether you understand how CFDs work and whether you can afford to take the high risk of losing your money. Past performance is not necessarily indicative of future results. The value of investments may fall as well as rise and the investor may not get back the amount initially invested. This content is not intended for nor applicable to residents of the UK.
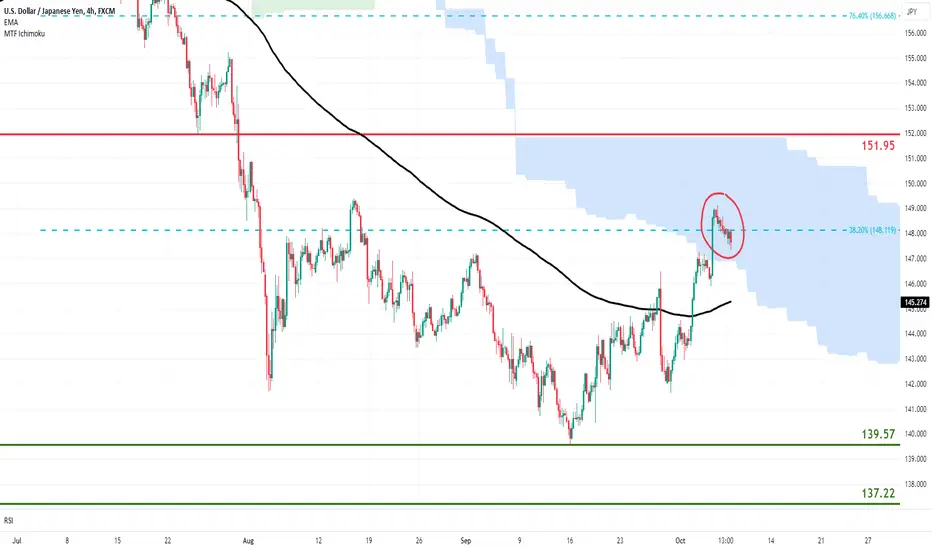
USDJPY Rebound Faces Pushback at Key ResistanceAfter the Fed’s jumbo pivot in September and aggressive easing path, Chair Powell adopted a more reserved approach at the start of the previous week. The cautious messaging was extrapolated at the end of that same week by the strong jobs report. Markets have now priced out bets for another outsized move, expecting 50 bps of cuts by the end of the year, in line with the Fed’s projections.
At the same time, the Bank of Japan has shifted to a more patient approach to monetary tightening, after last month's hold, removing guidance for further hikes ahead. The August deceleration in wage growth adds a reason for caution, while the current political landscape does not favor aggressive tightening. With elections due later this month, the new Prime Minister does not see the need for more hikes.
As a result of these developments, USD/JPY posted its best week of the year and extends its gains into the daily Ichimoku Cloud, testing the pivotal 38.2% Fibonacci. This creates scope for further recovery towards 151.90, but we are cautious about sustained advance as the upside is unfriendly technically and fundamentally.
Inflation (ex-fresh food) in Japan has been rising for the past four months and remains above the 2% target for more than two years, wages are elevated and GDP posted strong growth in Q2. One more rate hike within the year is still reasonable and BoJ officials still see more tightening if the economy evolves as projected. Chair Powell may have struck a more cautious tone, but officials still expect another 150 bps of cuts by the end of next year, so the broader policy dynamics remains unfavorable for USD/JPY.
The pair faces pushback at the 38.2% Fibonacci and rejection could send it back below the EMA200 (black line) and reaffirm the bearish bias. This would in turn create scope for new 2024 lows (139.57), although strong catalyst would be required.
Stratos Markets Limited (www.fxcm.com):
CFDs are complex instruments and come with a high risk of losing money rapidly due to leverage. 62% of retail investor accounts lose money when trading CFDs with this provider . You should consider whether you understand how CFDs work and whether you can afford to take the high risk of losing your money.
Stratos Europe Ltd (trading as “FXCM” or “FXCM EU”) (www.fxcm.com):
CFDs are complex instruments and come with a high risk of losing money rapidly due to leverage. 59% of retail investor accounts lose money when trading CFDs with this provider . You should consider whether you understand how CFDs work and whether you can afford to take the high risk of losing your money.
Stratos Trading Pty. Limited (www.fxcm.com):
Trading FX/CFDs carries significant risks. FXCM AU (AFSL 309763). Please read the Financial Services Guide, Product Disclosure Statement, Target Market Determination and Terms of Business at www.fxcm.com
Stratos Global LLC (www.fxcm.com):
Losses can exceed deposits.
Any opinions, news, research, analyses, prices, other information, or links to third-party sites contained on this video are provided on an "as-is" basis, as general market commentary and do not constitute investment advice. The market commentary has not been prepared in accordance with legal requirements designed to promote the independence of investment research, and it is therefore not subject to any prohibition on dealing ahead of dissemination. Although this commentary is not produced by an independent source, FXCM takes all sufficient steps to eliminate or prevent any conflicts of interests arising out of the production and dissemination of this communication. The employees of FXCM commit to acting in the clients' best interests and represent their views without misleading, deceiving, or otherwise impairing the clients' ability to make informed investment decisions. For more information about the FXCM's internal organizational and administrative arrangements for the prevention of conflicts, please refer to the Firms' Managing Conflicts Policy. Please ensure that you read and understand our Full Disclaimer and Liability provision concerning the foregoing Information, which can be accessed via FXCM`s website:
Stratos Markets Limited clients please see: www.fxcm.com
Stratos Europe Ltd clients please see: www.fxcm.com
Stratos Trading Pty. Limited clients please see: www.fxcm.com
Stratos Global LLC clients please see: www.fxcm.com
Past Performance is not an indicator of future results.
USDCHF Reaffirms Bearish Bias after Timid SNB & US PCEThe Swiss National Bank was the first major institution to shift to monetary easing and remains at the forefront after its third consecutive rate cut this week. However, it stuck with the small 0.25% increments, which are meager compared to the Fed’s jumbo 0.5% pivot and aggressive easing path. Furthermore, with rates already at 1%, the SNB easing runway may not be very long. Today’s US inflation figures favor the Fed’s dovishness, as headline PCE decelerated to 2.2% and the lowest in more than three years. These dynamics weigh on the pair and reaffirm the bearish below the EMA200. This sustains risk for further losses below 0.8333 and levels not seen since at least 2015, although sustained weakness below it is hard.
Core PCE ticked up to 2.7% y/y and the Fed’s frontloading may fuel further persistence in price pressures and lead to fewer cuts later on. On the Swiss front, policymakers may not be able to avoid larger rate cuts. Inflation dropped to 1.1% in August and they expect further deceleration to 0.6% next year, while the elevated Franc harms exports and ads to the pressure for bigger policy moves and/or FX intervention. Despite the post-pandemic shift, the SNB has generally sought to keep the Swiss Franc from appreciating and has kept rates below zero for most of the past ten years.
As a result, we can see another effort surpass the EMA200 and pause the bearish bias. This would bring the 38.2% Fibonacci of the May-September slump into the spotlight, but we are cautious around the ascending prospects as the upside looks unfriendly.
Stratos Markets Limited (www.fxcm.com):
CFDs are complex instruments and come with a high risk of losing money rapidly due to leverage. 62% of retail investor accounts lose money when trading CFDs with this provider . You should consider whether you understand how CFDs work and whether you can afford to take the high risk of losing your money.
Stratos Europe Ltd (trading as “FXCM” or “FXCM EU”) (www.fxcm.com):
CFDs are complex instruments and come with a high risk of losing money rapidly due to leverage. 59% of retail investor accounts lose money when trading CFDs with this provider . You should consider whether you understand how CFDs work and whether you can afford to take the high risk of losing your money.
Stratos Trading Pty. Limited (www.fxcm.com):
Trading FX/CFDs carries significant risks. FXCM AU (AFSL 309763). Please read the Financial Services Guide, Product Disclosure Statement, Target Market Determination and Terms of Business at www.fxcm.com
Stratos Global LLC (www.fxcm.com):
Losses can exceed deposits.
Any opinions, news, research, analyses, prices, other information, or links to third-party sites contained on this video are provided on an "as-is" basis, as general market commentary and do not constitute investment advice. The market commentary has not been prepared in accordance with legal requirements designed to promote the independence of investment research, and it is therefore not subject to any prohibition on dealing ahead of dissemination. Although this commentary is not produced by an independent source, FXCM takes all sufficient steps to eliminate or prevent any conflicts of interests arising out of the production and dissemination of this communication. The employees of FXCM commit to acting in the clients' best interests and represent their views without misleading, deceiving, or otherwise impairing the clients' ability to make informed investment decisions. For more information about the FXCM's internal organizational and administrative arrangements for the prevention of conflicts, please refer to the Firms' Managing Conflicts Policy. Please ensure that you read and understand our Full Disclaimer and Liability provision concerning the foregoing Information, which can be accessed via FXCM`s website:
Stratos Markets Limited clients please see: www.fxcm.com
Stratos Europe Ltd clients please see: www.fxcm.com
Stratos Trading Pty. Limited clients please see: www.fxcm.com
Stratos Global LLC clients please see: www.fxcm.com
Past Performance is not an indicator of future results.

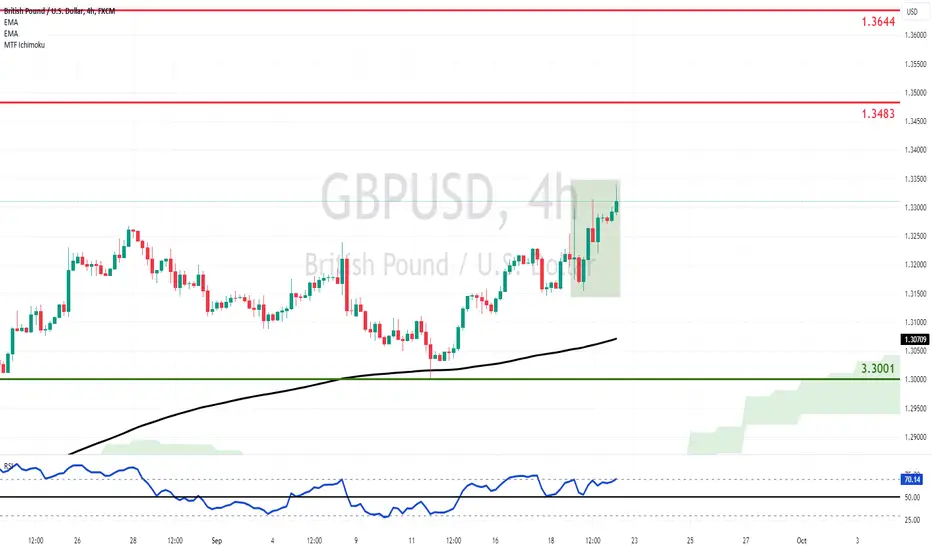
GBPUSD Sets 2+ Year Highs as the Fed Out-Cuts its UK PeerThe pair gains nearly 5% this year and the latest round of policy decisions by the Fed and the BoE, sent it the highest levels since the first quarter of 2022. The US Fed on Wednesday made its belated pivot with an outsized 0.5% reduction and pointed to another 50 bps worth of cuts by the end of the year. The Bank of England started lowering rates earlier than its US counterpart, with the 0.25% cut of August. Still wary over price pressures though, it has maintained a cautious stance around further easing. This apprehension was reaffirmed on Thursday, as policymakers stood pat on rates.
The Fed out-cut the BoE and is on track to deliver more reductions, setting up a favorable monetary policy differential for GBP/USD. Bulls now have the opportunity to push for the 1.3483 handle, but we are cautious at this time for further strength.
The Fed may have pointed to steep rate cut path as it tries to ensure a strong labor market and a soft landing, but may have a hard time implementing it, as it could put upward pressure to prices. On the other hand, despite the BoE’s trepidation, pressure could mount for faster pace and two more cuts are not unreasonable. Furthermore, the RSI moves towards overbought conditions, so we could see pressure. Daily closes below the EMA200 (black line) would be needed for the bullish bias to pause, but that is hard to justify under current monetary policy dynamics.
Stratos Markets Limited (www.fxcm.com):
CFDs are complex instruments and come with a high risk of losing money rapidly due to leverage. 62% of retail investor accounts lose money when trading CFDs with this provider . You should consider whether you understand how CFDs work and whether you can afford to take the high risk of losing your money.
Stratos Europe Ltd (trading as “FXCM” or “FXCM EU”) (www.fxcm.com):
CFDs are complex instruments and come with a high risk of losing money rapidly due to leverage. 59% of retail investor accounts lose money when trading CFDs with this provider . You should consider whether you understand how CFDs work and whether you can afford to take the high risk of losing your money.
Stratos Trading Pty. Limited (www.fxcm.com):
Trading FX/CFDs carries significant risks. FXCM AU (AFSL 309763). Please read the Financial Services Guide, Product Disclosure Statement, Target Market Determination and Terms of Business at www.fxcm.com
Stratos Global LLC (www.fxcm.com):
Losses can exceed deposits.
Any opinions, news, research, analyses, prices, other information, or links to third-party sites contained on this video are provided on an "as-is" basis, as general market commentary and do not constitute investment advice. The market commentary has not been prepared in accordance with legal requirements designed to promote the independence of investment research, and it is therefore not subject to any prohibition on dealing ahead of dissemination. Although this commentary is not produced by an independent source, FXCM takes all sufficient steps to eliminate or prevent any conflicts of interests arising out of the production and dissemination of this communication. The employees of FXCM commit to acting in the clients' best interests and represent their views without misleading, deceiving, or otherwise impairing the clients' ability to make informed investment decisions. For more information about the FXCM's internal organizational and administrative arrangements for the prevention of conflicts, please refer to the Firms' Managing Conflicts Policy. Please ensure that you read and understand our Full Disclaimer and Liability provision concerning the foregoing Information, which can be accessed via FXCM`s website:
Stratos Markets Limited clients please see: www.fxcm.com
Stratos Europe Ltd clients please see: www.fxcm.com
Stratos Trading Pty. Limited clients please see: www.fxcm.com
Stratos Global LLC clients please see: www.fxcm.com
Past Performance is not an indicator of future results.
EURGBP Bearish Bias Reaffirmed after UK CPI but BoE LoomsThe Bank of England lowered rates last month, for the first time in four years, joining major peers in their shift to less restrictive monetary settings. However, officials adopted a cautious and non-committal approach on further easing, as they remain wary of inflation which they expect to rise further this year. Today’s inflation report will likely strengthen the BoE’s apprehension, as CPI stayed above the 2% target, while core accelerated to 3.6% y/y in August.
EURGPB faces pushback as a result, at the critical resistance cluster provided by the EMA200 (black line) and the 23.6% Fibonacci of the August fall. Bearish bias is intact below that level, sustaining risk for further losses towards and beyond 0.8381. The monetary policy differential is unfavorable for the pair, as the ECB has already slashed rates twice this year and at least one more cut is expected this year.
The Bank of England will have a hard time moving again on Wednesday, but pressure for faster easing pace is likely to increase. Wage growth moderated substantially and this can allow greater tolerance for slower return of inflation to target, while the economy remains fragile, despite exiting its brief recession.
EUR/GBP has contained its fall in recent weeks and a break above the aforementioned resistance cluster would pause the bearish bias and provide the launching pad for taking out the 38.2% Fibonacci. Greater recovery however towards the 61.8% levels looks hard under current policy dynamics.
Stratos Markets Limited (www.fxcm.com):
CFDs are complex instruments and come with a high risk of losing money rapidly due to leverage. 6 2% of retail investor accounts lose money when trading CFDs with this provider . You should consider whether you understand how CFDs work and whether you can afford to take the high risk of losing your money.
Stratos Europe Ltd (trading as “FXCM” or “FXCM EU”) (www.fxcm.com):
CFDs are complex instruments and come with a high risk of losing money rapidly due to leverage. 59% of retail investor accounts lose money when trading CFDs with this provider . You should consider whether you understand how CFDs work and whether you can afford to take the high risk of losing your money.
Stratos Trading Pty. Limited (www.fxcm.com):
Trading FX/CFDs carries significant risks. FXCM AU (AFSL 309763). Please read the Financial Services Guide, Product Disclosure Statement, Target Market Determination and Terms of Business at www.fxcm.com
Stratos Global LLC (www.fxcm.com):
Losses can exceed deposits.
Any opinions, news, research, analyses, prices, other information, or links to third-party sites contained on this video are provided on an "as-is" basis, as general market commentary and do not constitute investment advice. The market commentary has not been prepared in accordance with legal requirements designed to promote the independence of investment research, and it is therefore not subject to any prohibition on dealing ahead of dissemination. Although this commentary is not produced by an independent source, FXCM takes all sufficient steps to eliminate or prevent any conflicts of interests arising out of the production and dissemination of this communication. The employees of FXCM commit to acting in the clients' best interests and represent their views without misleading, deceiving, or otherwise impairing the clients' ability to make informed investment decisions. For more information about the FXCM's internal organizational and administrative arrangements for the prevention of conflicts, please refer to the Firms' Managing Conflicts Policy. Please ensure that you read and understand our Full Disclaimer and Liability provision concerning the foregoing Information, which can be accessed via FXCM`s website:
Stratos Markets Limited clients please see: www.fxcm.com
Stratos Europe Ltd clients please see: www.fxcm.com
Stratos Trading Pty. Limited clients please see: www.fxcm.com
Stratos Global LLC clients please see: www.fxcm.com
Past Performance is not an indicator of future results.

JPN225 Correction Persists Ahead of the BoJThe Japanese index managed to swiftly rebound from the plunge caused by the central bank’s second rate hike and hawkish messaging at the end of July, as the market rout created some apprehension around the policy shift. Furthermore, the monetary setting remains accommodative and interests rates are still near-zero, while the stock market’s appeal goes beyond monetary policy and weak Yen.
JPN225 comes from a strong week, fueled largely by the upbeat messaging from Nvidia CEO Jensen Huang that spilled over to Japanese chip makers. Advantest and Tokyo Electron, two of Nikkei’s largest constituents, jumped more than 7%. As a result the index tries to regain the EMA200 that would allow it to exit its correction and challenge the August highs (39,204).
However, the index is cautious this week, as tech optimism wanes and markets await the BoJ’s decision, preceded by inflation update. Policymakers are unlikely to raise rates again, but communication around the path ahead will be crucial. Official have pointed to further tightening ahead and another hike this year is reasonable, as inflation is well above 2%, wages have increased and Q2 GDP posted strong growth. Furthermore, the monetary policy shift and the Yen’s rebound have led to outflows from foreigners over the past seven months.
JPN225 stays in correction and below the EMA200 the risk of bear market persists, although sustained below that threshold has a higher degree of difficulty.
Stratos Markets Limited (www.fxcm.com):
CFDs are complex instruments and come with a high risk of losing money rapidly due to leverage. 62% of retail investor accounts lose money when trading CFDs with this provider. You should consider whether you understand how CFDs work and whether you can afford to take the high risk of losing your money.
Stratos Europe Ltd (trading as “FXCM” or “FXCM EU”) (www.fxcm.com):
CFDs are complex instruments and come with a high risk of losing money rapidly due to leverage. 59% of retail investor accounts lose money when trading CFDs with this provider. You should consider whether you understand how CFDs work and whether you can afford to take the high risk of losing your money.
Stratos Trading Pty. Limited (www.fxcm.com):
Trading FX/CFDs carries significant risks. FXCM AU (AFSL 309763). Please read the Financial Services Guide, Product Disclosure Statement, Target Market Determination and Terms of Business at www.fxcm.com
Stratos Global LLC (www.fxcm.com):
Losses can exceed deposits.
Any opinions, news, research, analyses, prices, other information, or links to third-party sites contained on this video are provided on an "as-is" basis, as general market commentary and do not constitute investment advice. The market commentary has not been prepared in accordance with legal requirements designed to promote the independence of investment research, and it is therefore not subject to any prohibition on dealing ahead of dissemination. Although this commentary is not produced by an independent source, FXCM takes all sufficient steps to eliminate or prevent any conflicts of interests arising out of the production and dissemination of this communication. The employees of FXCM commit to acting in the clients' best interests and represent their views without misleading, deceiving, or otherwise impairing the clients' ability to make informed investment decisions. For more information about the FXCM's internal organizational and administrative arrangements for the prevention of conflicts, please refer to the Firms' Managing Conflicts Policy. Please ensure that you read and understand our Full Disclaimer and Liability provision concerning the foregoing Information, which can be accessed via FXCM`s website:
Stratos Markets Limited clients please see: www.fxcm.com
Stratos Europe Ltd clients please see: www.fxcm.com
Stratos Trading Pty. Limited clients please see: www.fxcm.com
Stratos Global LLC clients please see: www.fxcm.com
Past Performance is not an indicator of future results.

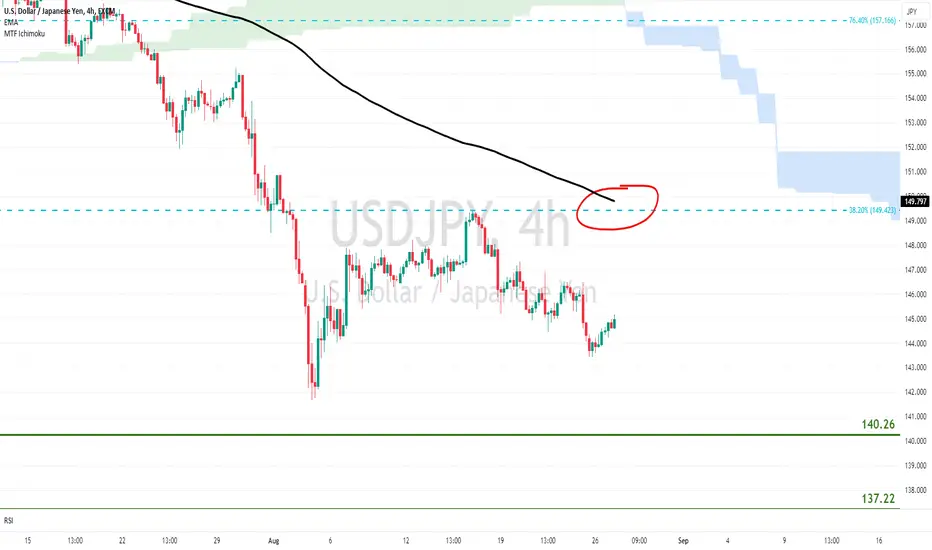
USDJPY Vulnerable on Monetary Policy DynamicsThe pair is heading towards its second straight losing month, due to the shift in monetary policy dynamics, which could fuel further losses and new 2024 lows towards 140.26. Chair Powell offered the strongest signal to date of a September pivot, bolstering market optimism for multiple rate cuts ahead. The bank of Japan is on the opposite direction, trying to make policy less loose. Stepping up its effort, it raised rates for second time in this cycle and pointed to more moves, while Governor Ueda stack to script last week.
On the other hand, Mr Powell did not offer any insights around the size and pace of rate cuts, while market pricing for four moves this year is stretched. The BoJ’s latest rate hike meanwhile sparked volatility and forced the bank to pledge to not hike again while markets are unstable. Furthermore, the rate differential will still be wide even if the BoJ hikes again and the Fed cuts more than once.
As such, a recovery effort would not be surprising, but the EMA200 (black line) and the 38.2% Fibonacci of the recent slump can cap the upside. Sustained strength above this resistance confluence does not easy under the current policy dynamics.
Stratos Markets Limited (www.fxcm.com):
CFDs are complex instruments and come with a high risk of losing money rapidly due to leverage. 62% of retail investor accounts lose money when trading CFDs with this provider . You should consider whether you understand how CFDs work and whether you can afford to take the high risk of losing your money.
Stratos Europe Ltd (trading as “FXCM” or “FXCM EU”) (www.fxcm.com):
CFDs are complex instruments and come with a high risk of losing money rapidly due to leverage. 59% of retail investor accounts lose money when trading CFDs with this provider . You should consider whether you understand how CFDs work and whether you can afford to take the high risk of losing your money.
Stratos Trading Pty. Limited (www.fxcm.com):
Trading FX/CFDs carries significant risks. FXCM AU (AFSL 309763). Please read the Financial Services Guide, Product Disclosure Statement, Target Market Determination and Terms of Business at www.fxcm.com
Stratos Global LLC (www.fxcm.com):
Losses can exceed deposits.
Any opinions, news, research, analyses, prices, other information, or links to third-party sites contained on this video are provided on an "as-is" basis, as general market commentary and do not constitute investment advice. The market commentary has not been prepared in accordance with legal requirements designed to promote the independence of investment research, and it is therefore not subject to any prohibition on dealing ahead of dissemination. Although this commentary is not produced by an independent source, FXCM takes all sufficient steps to eliminate or prevent any conflicts of interests arising out of the production and dissemination of this communication. The employees of FXCM commit to acting in the clients' best interests and represent their views without misleading, deceiving, or otherwise impairing the clients' ability to make informed investment decisions. For more information about the FXCM's internal organizational and administrative arrangements for the prevention of conflicts, please refer to the Firms' Managing Conflicts Policy. Please ensure that you read and understand our Full Disclaimer and Liability provision concerning the foregoing Information, which can be accessed via FXCM`s website:
Stratos Markets Limited clients please see: www.fxcm.com
Stratos Europe Ltd clients please see: www.fxcm.com
Stratos Trading Pty. Limited clients please see: www.fxcm.com
Stratos Global LLC clients please see: www.fxcm.com
Past Performance is not an indicator of future results.
template for researching equity price wrt monetary policyThe template shows an equity price (e.g. QQQ) comparing to SPY,
with indicators of major economic variables
1. Unemployment rate (UNRATE);
2. CPI index (USCCPI);
3. Interest rate (USINTR);
4. FED balance sheet (USCBBS);
5. Dollar strength (DXY);
Unemployment rate and CPI are the two major conflicting variables that central bank (FED) tries to balance, via the method of adjusting interest rate and FED balance sheet (e.g. Quantitative easing). And the dollar strength gives some a peek of the world economic via US currency exchange rates.
Combining these economic indicators can hopefully give some insights of the growth or decline of the US economics which will partially be correlated with equity prices.
